The recently released music video for Jack White’s “High Ball Stepper” is a fantastic marriage of science and art. The audio is paired with visuals based around vibration effects using both granular materials and fluids. There are many examples of Faraday waves, the rippling patterns formed when a fluid interface becomes unstable under vibration. There are also cymatic patterns and even finger-like protrusions formed by when shear-thickening non-Newtonian fluids get agitated. (Video credit: J. White, B. Swank and J. Cathcart; submitted by Mike and Marius)
Search results for: “shear”

The Kaye Effect
The Kaye effect is particular to shear-thinning non-Newtonian fluids – that is, fluids with a viscosity that decreases under deformation. The video above includes high-speed footage of the phenomenon using shampoo. When drizzled, the viscous liquid forms a heap. The incoming jet causes a dimple in the heap, and the local viscosity in this dimple drops due to the shear caused by the incoming jet. Instead of merging with the heap, the jet slips off, creating a streamer that redirects the fluid. This streamer can rise as the dimple deepens, but, in this configuration, it is unstable. Eventually, it will strike the incoming jet and collapse. It’s possible to create a stable version of the Kaye effect by directing the streamer down an incline. (Video credit: S. Lee)
The Structure of Turbulence
Though they may appear random at first glance, turbulent flows do possess structure. The video above shows a numerical simulation of a mixing layer, a flow in which two adjacent regions of fluid move with different velocities. The upper third of the frame shows a top view, and the bottom frame shows a side view, in which the upper fluid layer moves faster than the lower one. The difference in velocities creates shear which quickly drives the mixing layer into turbulence. But watch the chaos carefully, and your eye will pick out vortices rolling clockwise in the largest scales of the mixing layer. These features are known as coherent structures, and they are key to current efforts to understand and model turbulent flows. (Video credit: A. McMullan)
Reader Question: What is Viscosity?
Reader thesnazz asks:
Is there a difference between surface tension and viscosity, or are they two manifestations of the same process and/or principles? If you know a given fluid’s surface tension, can you predict its viscosity, and vice versa?
This is a good question! To answer it, let’s think about where surface tension and viscosity come from. Like many concepts in fluid dynamics, these quantities describe for a whole fluid the properties that arise from interactions between molecules.
To prevent this becoming overly long, I’m going to tackle this over a couple posts. Today, I’ll talk about viscosity.
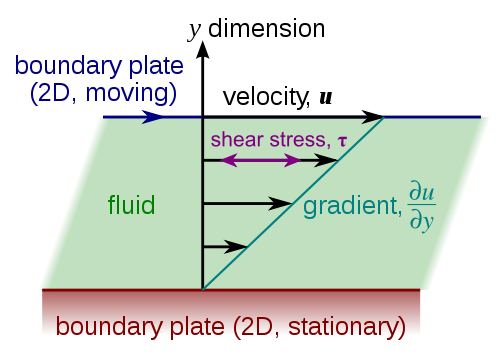
One way to describe a fluid’s viscosity is as a measure of its resistance to deformation. Another way to think of it is how easily momentum is transmitted from one part of the fluid to another. The diagram above is the classic representation. A layer of fluid is sandwiched between two flat plates. If the top plate moves, friction requires that the fluid particles in contact with the plate get dragged along. This shears the fluid just below that and drags it along, but not quite as much. Those fluid particles do the same to their neighbors and so on down to the stationary second plate, where the fluid is at rest.
Viscosity is the property that determines how much those neighboring fluid particles move; the more viscous the fluid, the more the neighboring bits of fluid resist getting pulled along. This is a property that’s inherent to a fluid. It comes from how the molecules of the fluid interact with one another, but there are no simple expressions to calculate the viscosity of a liquid or a gas from the individual interactions of its molecules. Instead we experimentally measure viscosity values and use empirical formulas to approximate how viscosity changes with temperature and other effects. (Image credit: Wikimedia)

Pitcher Plant Fluid Dynamics
Carnivorous pitcher plants owe much of their efficacy to the viscoelasticity of their digestive fluid. A viscoelastic fluid’s resistance to deformation has two components: the usual viscous component that resists shearing and an elastic component, often derived from the presence of polymers, that resists stretching – kind of like a liquid rubber band. It’s the latter effect that’s important when it comes to the pitcher plant trapping insects. When a fly or ant falls into the liquid within the plant, it will flail and try to swim, thereby straining the fluid. In part © of the image above, you can see how long fluid filaments stretch as the fly moves; this is because the digestive fluid’s extensional viscosity, the elastic component, is 10,000 times larger than its shear viscosity, the usual viscous component, for motions like the fly’s. This viscoelastic fluid is so effective at trapping insects that, as seen in part (b) above, it has to be diluted by more than 95% before insects can escape it! (Image credit: L. Gaume and Y. Forterre)

Shocked Interfaces
The Richtmyer-Meshkov instability occurs when two fluids of differing density are hit by a shock wave. The animation above shows a cylinder of denser gas (white) in still air (black) before being hit with a Mach 1.2 shock wave. The cylinder is quickly accelerated and flattened, with either end spinning up to form the counter-rotating vortices that dominate the instability. As the vortices spin, the fluids along the interface shear against one another, and new, secondary instabilities, like the wave-like Kelvin-Helmholtz instability, form along the edges. The two gases mix quickly. This instability is of especial interest for the application of inertial confinement fusion. During implosion, the shell material surrounding the fuel layer is shock-accelerated; since mixing of the shell and fuel is undesirable, researchers are interested in understanding how to control and prevent the instability. (Image credit: S. Shankar et al.)The APS Division of Fluid Dynamics conference begins this Sunday in Pittsburgh. I’ll be giving a talk about FYFD Sunday evening at 5:37pm in Rm 306/307. I hope to see some of you there!
Cornstarch Physics
Oobleck, a non-Newtonian fluid made up of water and cornstarch, is a perennial Internet favorite for its ability to dance and the fact that one can run across a pool of it. It’s typically described as a shear-thickening fluid and only exhibits solid-like behavior under impact. Strictly speaking, oobleck is a suspension of solid grains of cornstarch in water. When struck, the initially compressible grains jam together, creating a region more like a solid than a liquid. From this point of impact, a solidification front expands through the suspension, jamming more grains together and enabling the fluid to absorb large amounts of momentum. The process is known as dynamic solidification. (Video credit: University of Chicago; research credit: S. Waitukaitis & H. Jaeger)

How Erosion Shapes a Flow
Erosion creates all manner of strange shapes as wind and water cut away at solids. But why does the interaction of the fluid and solid result in the geometries we observe? Above is a collage from an experiment in which a soft clay sphere was immersed in a water tunnel. After 70 minutes, the sphere had worn into a roughly conical body (Image A) reminiscent of a re-entry capsule. Images B and C show instantaneous streaklines around the clay at 10 minutes and 70 minutes, respectively. Images D and E show diagrams of the flowfield seen in B and C. Fast-moving flow above and below the stagnation point (SP) wears the front of the body into a conical shape, whereas the recirculating vortices aft of the separation point (SL) create a sloped shoulder and flattened back in the clay. The results are consistent with a model in which erosion tries to create uniform shear stress at the solid surface – essentially the process is keeping the frictional force between the fluid and air constant along the surface. This makes sense. If a region’s shear stress is higher, it will be worn more quickly than the surrounding solid, causing it to recede and experience decreased shear stress (relative to the surrounding area) as a result. (Image credit: L. Ristroph et al.)

Oil Flow Viz
Fluorescent oil sprayed onto a model in the NASA Langley 14 by 22-Foot Subsonic Wind Tunnel glows under ultraviolet light. Airflow over the model pulls the initially even coat of oil into patterns dependent on the air’s path. The air accelerates around the curved leading edge of the model, curling up into a strong lifting vortex similar to that seen on a delta wing. At the joint where the wings separate from the body those lifting vortices appear to form strong recirculation zones, as evidenced by the spiral patterns in the oil. Dark patches, like those downstream of the engines could be caused by an uneven application of oil or by areas of turbulent flow, which has larger shear stress at the wall than laminar flow and thus applies more force to move the oil away. Be sure to check out NASA’s page for high-resolution versions of the photo. (Photo credit: NASA Langley/Preston Martin; via PopSci)
Bubbles With Tails
In water and other Newtonian fluids, a rising bubble is typically spherical, but for non-Newtonian fluids things are a different story. In non-Newtonian fluids the viscosity–the fluid’s resistance to deformation–is dependent on the shear rate and history–how and how much deformation is being applied. For rising bubbles, this can mean a teardrop shape or even a long tail that breaks up into fishbone-like ligaments. The patterns shown here vary with the bubble’s volume, which affects the velocity at which it rises (due to buoyancy) and thus the shear force the bubble and surrounding non-Newtonian fluid experience. (Video credit: E. Soto, R. Zenit, and O. Manero)
