Photographer Mike Olbinski has captured a spectacular timelapse of a supercell thunderstorm over the plains of Texas. Supercells are characterized by a strong, rotating updraft known as a mesocyclone, seen clearly in the video. These storms are commonly isolated occurrences, forming when horizontal vorticity in the form of wind shear is redirected upwards by an updraft. Such a strong updraft is typically created by a capping inversion, a situation where a layer of warmer air traps the colder air beneath it. (This is why one sees a distinctive cut-off at the top of some clouds.) As warm air rises from the surface, either the air above the cap will cool or the air below the cap will warm. Either situation results in an instability with cooler air on top of warmer air, providing a catalyst for the kind of dramatic weather seen here. (Video credit: M. Olbinski; via io9)
Search results for: “shear”
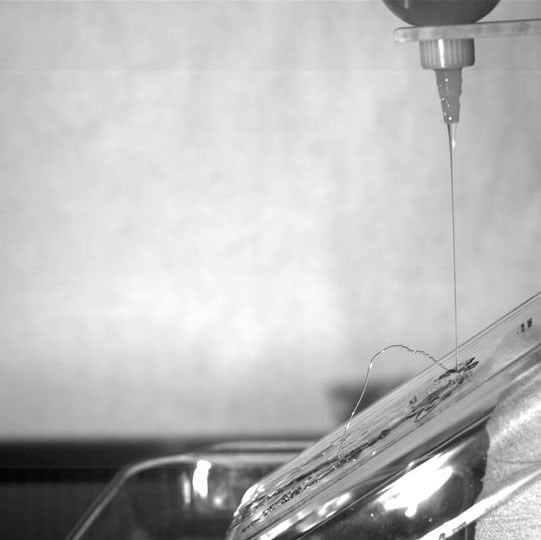
The Kaye Effect
When a viscous fluid falls onto a surface, it will form a heap, like honey coiling. But for shear-thinning liquids like soap or shampoo something a little wild can happen as the heap grows. A dimple can form and, when the incoming jet of fluid hits that dimple, it slips against it and is ejected outward. If you wonder why you don’t see this every day in the shower, it’s because the outgoing jet usually hits the incoming jet, causing the whole system to collapse in less than 300 ms. By dropping the fluid on an inclined surface, one can keep the two jets from colliding, thereby creating a stable Kaye effect. (Photo credit: E. Eichelberger)

Mixing While Laminar
Although turbulent flows are known for their mixing efficiency, in manufacturing there can often be a need to mix laminar fluid streams without the increased shear stress of a turbulent flow. This can be particularly important for polymeric liquids, where too much shear stress could damage the polymer chains. One possibility is using a static mixer, such as the one demonstrated in this video, which, when placed in pipe flow, will deflect the pipe’s contents in such a way as to produce efficient mixing over a short distance. Here two streams of high-viscosity epoxy are mixed through such a static mixer, hardened, and then ground to show the mixing at each level of the static mixer. (Video credit: Sulzer)
Inside a Blender
The fluid dynamics of a commercial-quality blender amount to a lot more than just stirring. Here high-speed video shows how the blender’s moving blades create a suction effect that pulls contents down through the middle of the blender, then flings them outward. This motion creates large shear stresses, which help break up the food, as well as turbulence that can mix it. But if you watch carefully, you’ll also see tiny bubbles spinning off the blades. These bubbles, formed by the pressure drop of fluid accelerated over the arms of the blades, are cavitation bubbles. When they collapse, or implode, they create localized shock waves that further break up the blender’s contents. This same effect is responsible for damage to boat propellers and lets you destroy glass bottles. (Video credit: ChefSteps; via Wired; submitted by jshoer)
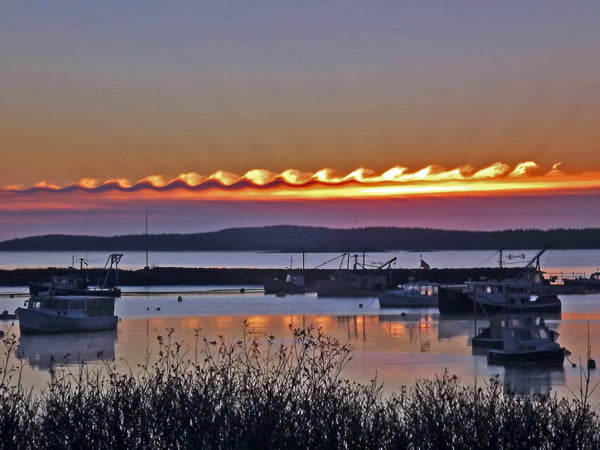
Ocean Waves in the Sky
These wave-like Kelvin-Helmholtz clouds can form due to shear between different layers of air in the atmosphere. When one region of air has a higher velocity than the other, their interface forms a shear layer, which can break down in this wavy pattern. In this case, the lower layer of air was moist enough to form condensation and clouds, making the pattern visible to the naked eye. (Photo credit: Gene Hart; via Flow Visualization)
The Kaye Effect
The Kaye effect is an instability particular to a falling stream of non-Newtonian fluids with shear-thinning properties. When these fluids are deformed, their viscosity decreases; this, for example, is why ketchup flows out of a bottle more easily once it’s moving. Like most fluids, the falling shampoo creates a heap on the surface. The Kaye effect is kicked off when the incoming jet creates enough shear on part of the heap that the local viscosity decreases, causing the streamer–or outgoing jet–to slip off the side of the heap. As the incoming jet continues, a dimple forms in the heap where the streamer originates. As the dimple deepens, the streamer will rise until it strikes the incoming jet. This perturbation to the system collapses the streamer and ends the Kaye effect. This video also has a good explanation of the physics, along with demonstrations of a stable form of the Kaye effect in which the streamer cascades down an incline. (Video credit: Minute Laboratory; inspired by infplusplus)

Saturn’s Polar Vortex
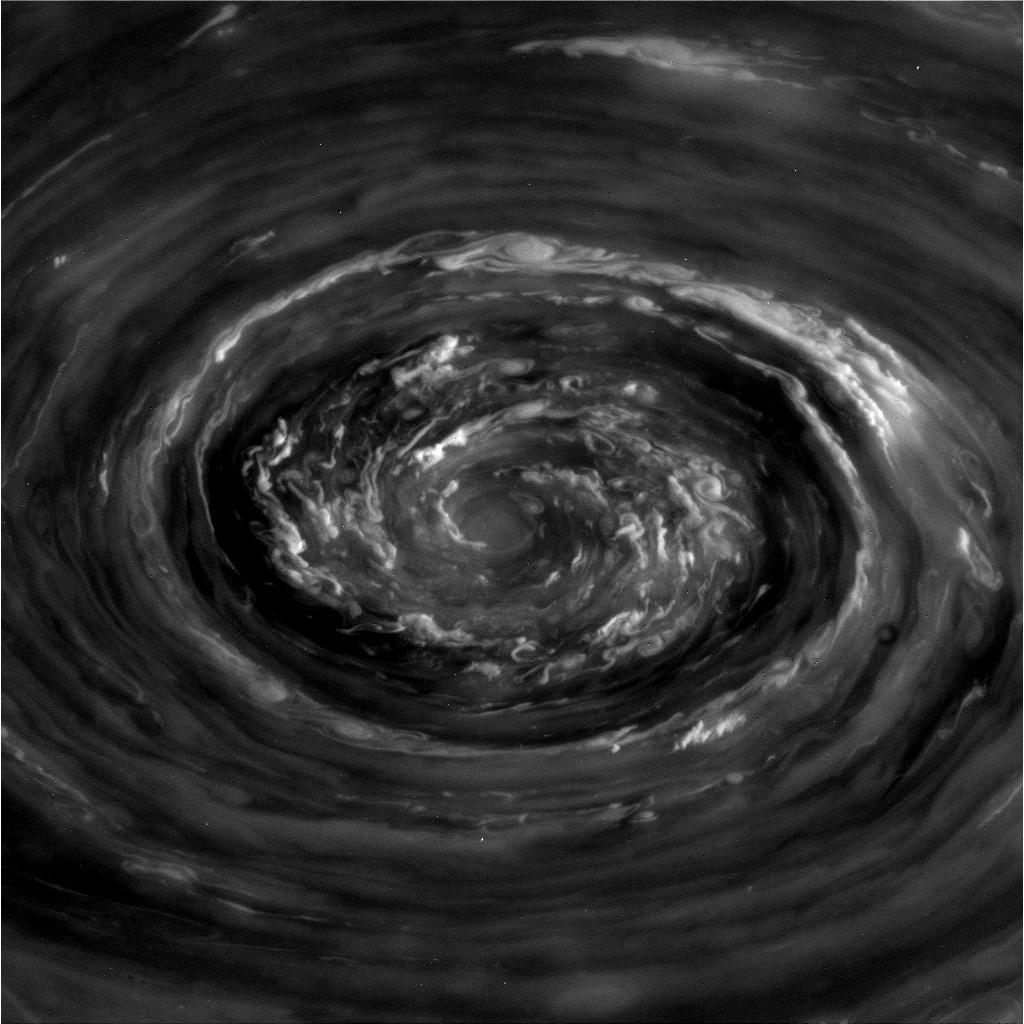
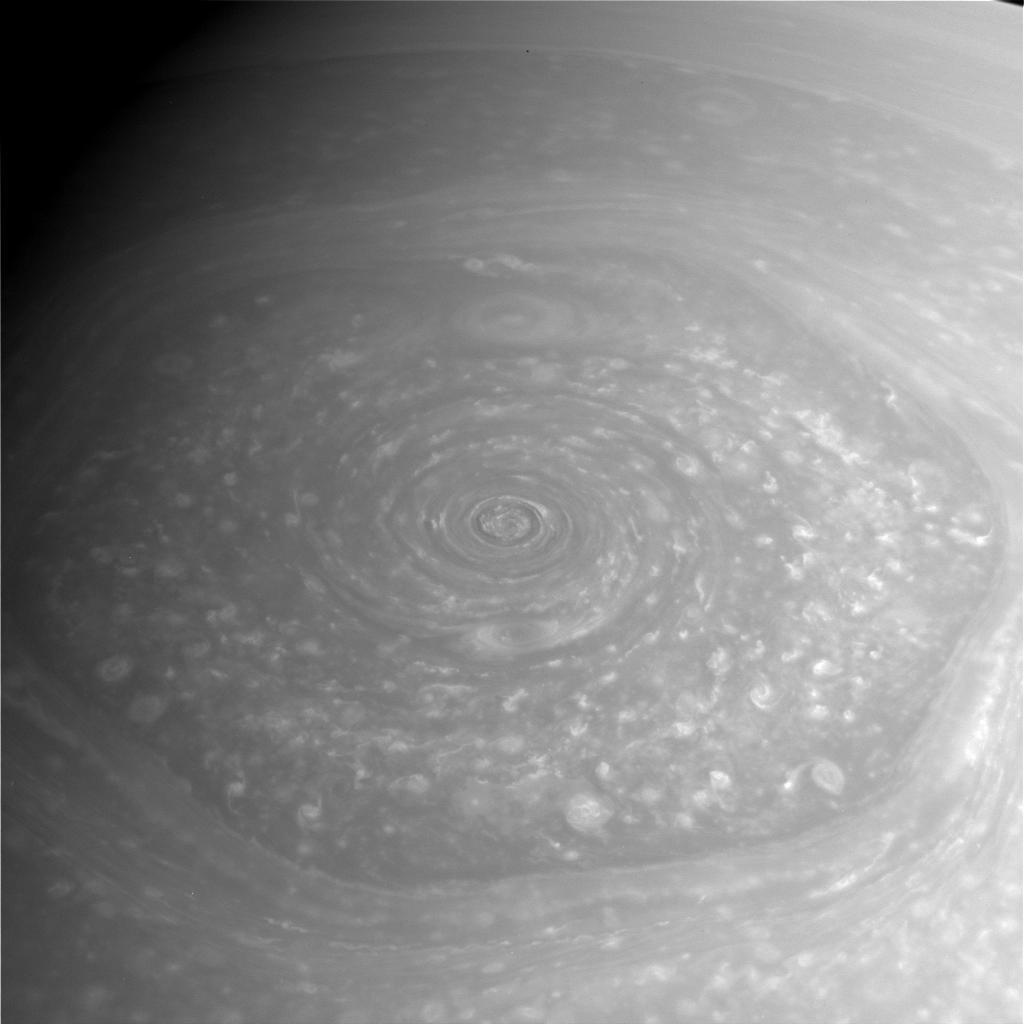
Nothing quite compares to the beauty of fluid dynamics on astronomical scales. What you see here are raw photographs of recent storms at Saturn’s north pole. The recent change in Saturnian seasons has afforded Cassini a sunlit view of the northern pole, which had previously lain in darkness. A roiling vortex filled with clouds being twisted and sheared was revealed near the center of its famed polar hexagon. (Photo credit: NASA/JPL-Caltech/Space Science Institute; submitted by J. Shoer)
Viscoelastic Jets
Unlike Newtonian fluids, such as air and water, viscoelastic fluids exhibit non-uniform reactions to deformation. In this video, researchers explore the effects of this behavior when a liquid jet falls into another fluid. When fluids move past one another at different speeds in this manner, there is a shearing force which often leads to the wave-like Kelvin-Helmholtz instability between the fluids. Here we see for a variety of wavelengths how the breakdown of a Newtonian and viscoelastic jet differ. The Newtonian jets form clean lines and complicated tulip-like shapes, but the viscoelasticity of the non-Newtonian jets inhibits the growth of these instabilities, surrounding the central jet with wisps of escaping fluid. For more, see Keshavarz and McKinley. (Video credit: B. Keshavarz and G. McKinley)

Reader Question: How Useful is Flow Viz?



Reader Andrew asks:
I’ve noticed you’ve posted a bunch of flow visualization/wind tunnel content. I’m just curious where how useful information is obtained from these. Is it just observation? Or are there instruments that are usually used in conjunction with these techniques to provide data?
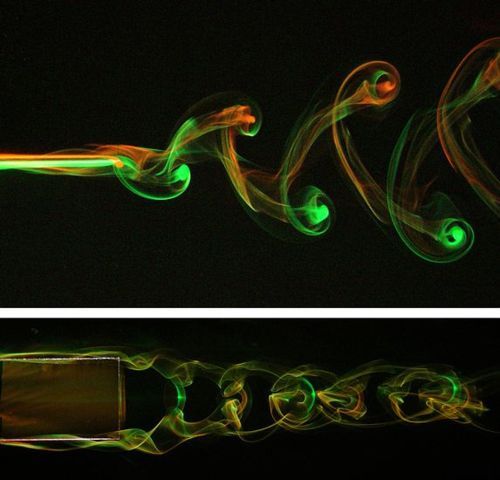
Great question, Andrew! The answer can vary based on the technique and application. In some cases, flow visualization is used for purely qualitative observation, but in others it can provide more quantifiable data. For example, the water tunnel flow visualization of Google’s heliostat array gave very qualitative data about flow around a given configuration but allowed quick evaluation of many configurations. Flow visualization can also help identify key features for additional study like vortices in a wake. This identification of structure can be so useful that even in computational fluid dynamics, where researchers have all possible information about pressure, temperature, and velocity in a flow field, flow visualization is regularly used to identify underlying structures.
Some flow visualization methods can also give very specific information. Oil-flow visualization gives a snapshot of shear stress at the surface of an object, letting an engineer identify at a glance areas of laminar and turbulent flow as well as regions with vortices and streaks. Naphthalene flow visualization and infrared thermography are both great for identifying the location of laminar-turbulent transition and can do so across the span of an object, which is much easier than trying to traverse a probe across the entire object. And some forms of flow visualization allow for extraction of velocity field information, as in particle image velocimetry. In this technique, tiny particles seed the flow and carefully timed image pairs are taken and correlated to determine the flow field velocity based on the changes in particle positions between images.
Like every measurement, flow visualization methods have their strengths and limitations. But for many applications, flow visualization provides much more than just pretty pictures and thus remains an important tool in any fluid dynamicist’s arsenal!
Atomizing
High-speed video reveals the complexity of fluid instabilities leading to atomization–the breakup of a liquid sheet into droplets. A thin annular liquid sheet is sandwiched between concentric air streams. As the velocity of the air on either side of the liquid sheet varies, shear forces cause the sheet to develop waves that result in mushroom-like shapes that break down into ligaments and droplets. Quick breakup into droplets is important in many applications, most notably combustion, where the size and dispersal of fuel droplets affects the efficiency of an engine. (Video credit: D. Duke, D. Honnery, and J. Soria)