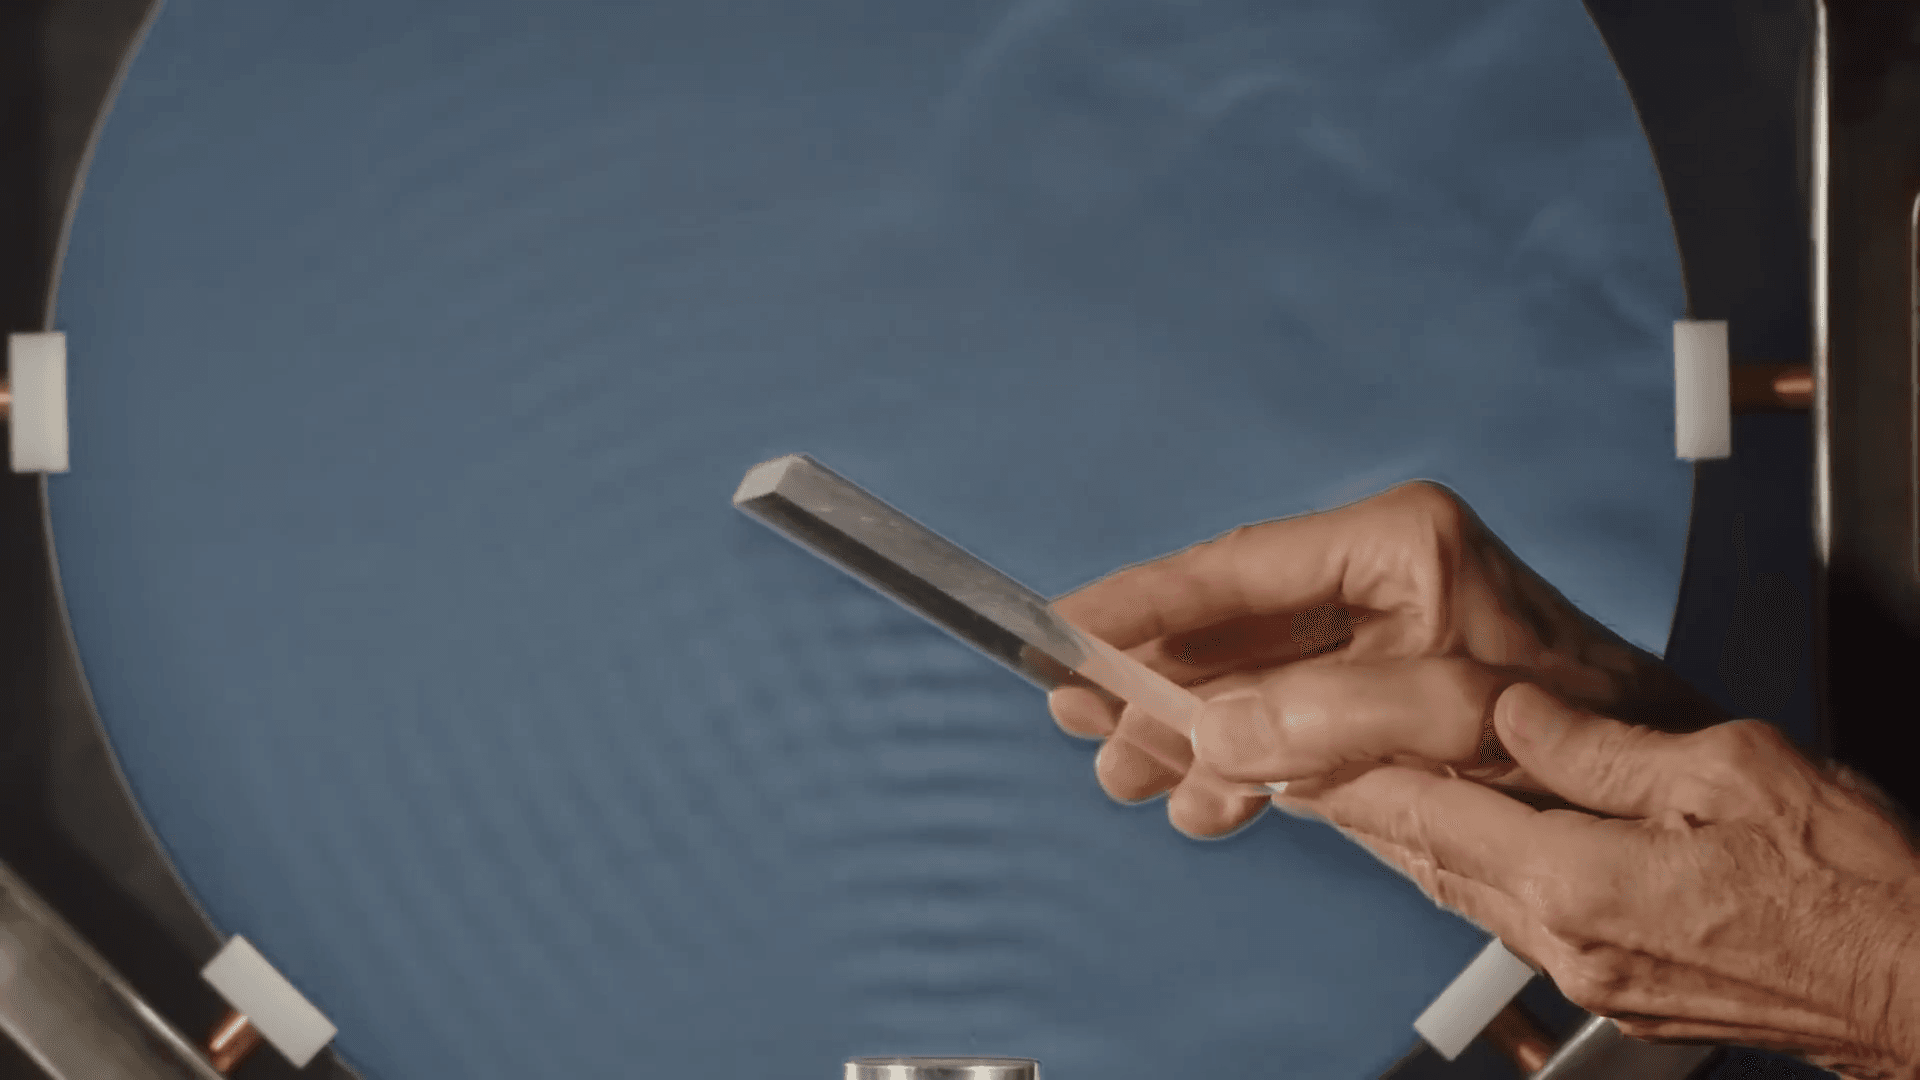
Sound is not something we can typically see, though there are ways to visualize it, including cymatics and special acoustic cameras. This video pursues a different tactic: using schlieren photography and stroboscopic lighting to show how sound waves reflect and deflect. It’s no easy feat, but one worth enjoying–especially when others have already done the hard part for you! (Video and image credit: All Things Physics; submitted by David J.)
Tag: flow visualization

Mixing Bubble Caps
When bubbles form atop the ocean or in our cups, they typically live short lives. Although the bubble can exchange fluid with the pool below, this only happens at the foot of the bubble cap. There, thinner patches form and, due to their buoyancy, rise up along the bubble’s surface. Over time, these lighter, thinner patches reduce the amount of fluid in the cap–causing the bubble to thin and eventually burst.

Here, researchers show that thinning–visible in the dark blue plumes rising up the bubble cap–when there’s no turbulence in the surrounding air. But as turbulence outside the bubble increases, the thinner patches stretch and deform across the cap. In the image series, turbulence increases moving from top to bottom. (Image credit: T. Aurégan and L. Deike)

“Arctic Fox in Blizzard”
A blue arctic fox bears the wind and snow of a Norwegian blizzard in this image by photographer Klaus Hellmich. The wind is strong enough to move snowflakes several centimeters in the time the camera’s shutter is open. This leaves the image full of streaklines that reveal the paths taken by the wind and snow. This visualization technique is useful in the lab, too. (Image credit: K. Hellmich; via Colossal)


Swirling Without Blades
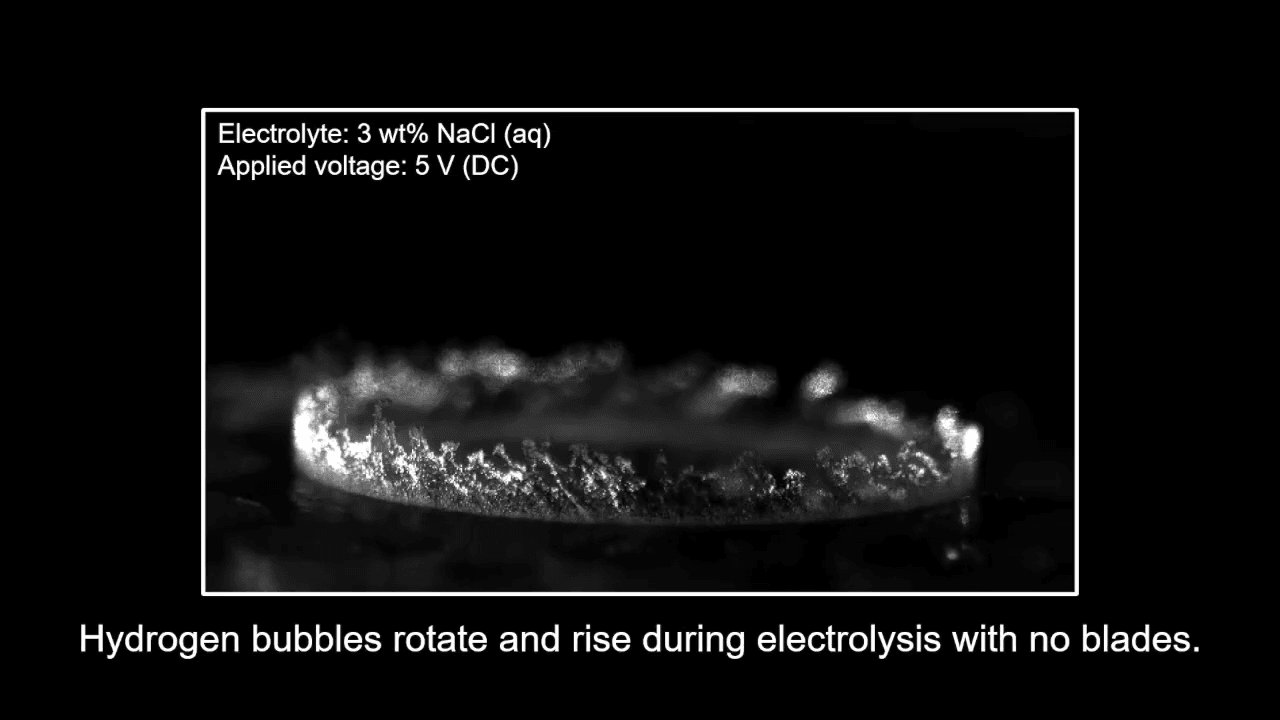
A ring of hydrogen bubbles rises, rotating clockwise, in this video of electrolysis. But there are no fan blades to cause this swirl, so why do the bubbles rotate? The answer is a Lorentz force induced by the electromagnetic set-up of the experiment. Watch to see how researchers manipulate the Lorentz force to affect the flow. (Video and image credit: Y. Cho et al.)

Understanding Schlieren
Schlieren techniques are one of my favorite forms of flow visualization. They cleverly make the invisible visible through an optical set-up that’s sensitive to changes in density. They’re great–as seen in the examples here–for seeing local buoyant flows like the plumes that rise from a candle, or for making gases like carbon dioxide visible. They’re also excellent for visualizing shock waves.
In this video, physicist David Jackson explains how one particular flavor of schlieren–one using a spherical mirror–works. There are lots of other possible schlieren set-ups, too, though each one has its quirks. (Video and image credit: All Things Physics; submitted by David J.)

Inside Cepheid Variable Stars
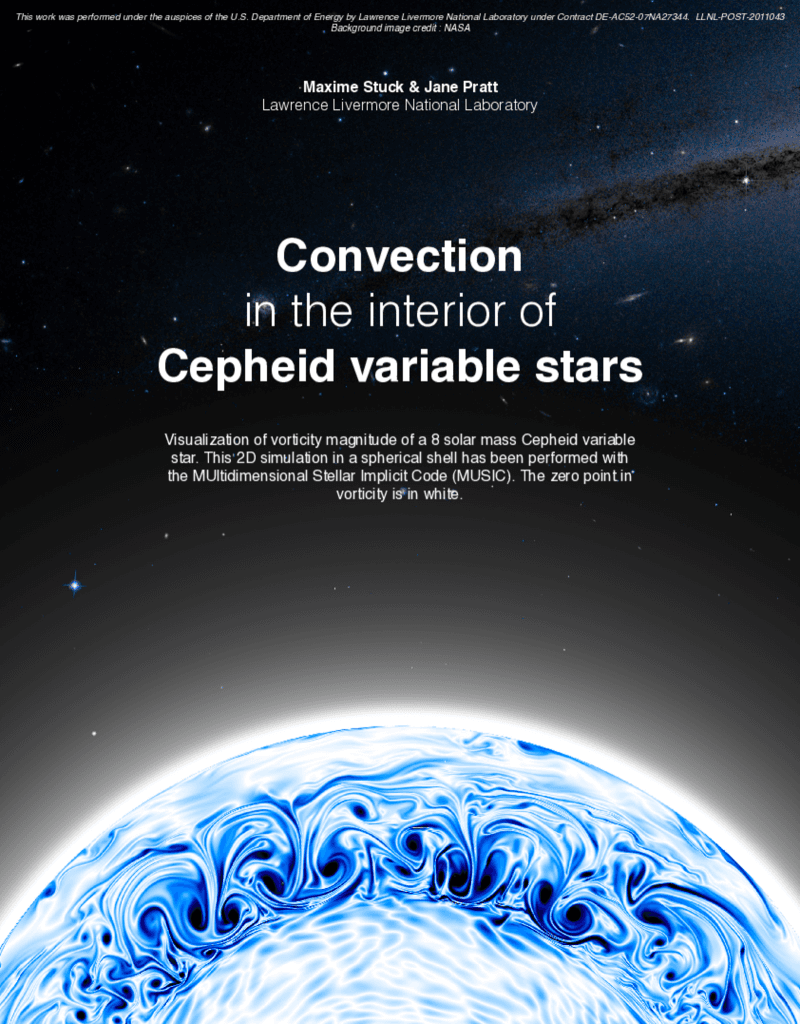
Cepheid variable stars pulsate in brightness over regular periods. That’s one reason astronomers use them as a standard candle to judge distances–even for stars well outside our galaxy. In this image, researchers display a simulation of convection inside a Cepheid eight times more massive than our sun. The colors represent vorticity, with zero vorticity in white.(Image credit: M. Stuck and J. Pratt)


Recreating Atmospheric Rivers
During the winter months, those of us living in the mid-latitudes sometimes experience atmospheric rivers. Formed from the interaction of cold winter storms with warm, moist tropical air, atmospheric rivers can deliver intense rainfall across long distances. In this video, the UCLA SpinLab team shows how you can recreate the effect with a relatively simple and affordable DIYnamics apparatus. (Video and image credit: UCLA SpinLab)

“Broken Water, Like Broken Glass”
How can you break water? By accelerating it so quickly that the pressure drop forms cavitation bubbles. Here, a steel piston rests against a transparent plate, all underwater. When a hammer strike accelerates the piston away at around 1000g, the severe pressure drop tears the water into bubbles (bottom, left). As the bubbles expand, the nearby piston squishes them into pancakes (bottom, center). As they continue growing, the bubbles press into one another, squeezing thin ridges of water between them. The result (center) resembles broken glass. (Image credit: J. da Silva et al.)


Instabilities in a Particle Flow
Even though particles are not (strictly speaking) a fluid, they often behave like one. Here, researchers investigate what happens when two layers of particles–with different size and density–slide down an incline together. The video is tilted so that the flow instead appears from left to right.
When the larger, denser particles sit atop a layer of smaller, lighter particles, shear between the two layers causes a Kelvin-Helmholtz instability that runs in the direction of the flow. This creates a wavy interface that lets some small particles work upward while large particles shift downward.
At the same time, a slice across the flow shows that plumes of small particles are pushing up toward the surface, driven by a Rayleigh-Taylor instability. The researchers also look at what happens when the particles are fluidized by injecting a gas able to lift the particles. (Video and image credit: M. Ibrahim et al.; via GFM)

A Supernova in Motion
In 1604, astronomers first caught sight of Kepler’s Supernova Remnant, a massive explosion some 17,000 light-years away. Twenty-five years of observations from the Chandra X-ray Observatory went into making this timelapse, which shows the supernova remnant‘s material pushing into the surrounding gas and dust.

In its fastest regions, the supernova remnant is moving around 2% of the speed of light–some 22 million kilometers per hour. Slower parts of the remnant are moving at just 0.5% of light-speed. (Image credit: NASA/CXC/SAO/Pan-STARRS; via Gizmodo)


![Composite image of bed layers for 4 different particle density ratios. Text reads, "The wave amplitude and growth rate increase with particle density ratio but only if [the density of large particles is greater than the smaller particle density]." Composite image of bed layers for 4 different particle density ratios. Text reads, "The wave amplitude and growth rate increase with particle density ratio but only if [the density of large particles is greater than the smaller particle density]."](https://fyfluiddynamics.com/wp-content/uploads/KHbed3-1024x576.png)