Today’s video shows red blood cells flowing through a capillary network in a rat’s skeletal muscle. At this resolution, our eyes can follow the paths of individual red blood cells squeezing through each capillary, as well as the faster blur of thicker capillaries where many cells can pass at once. Watching videos like this is a great way to build intuition for particle image velocimetry, streaklines, and other flow visualization methods as our brains can readily recognize where the cells are moving fast and where they are slower. (Video and image credit: Dr. G. McEvoy et al.; via Colossal)
Tag: particle image velocimetry

Biodegradable PIV Particles
Particle image velocimetry–PIV, for short–is used to visualize fluid flows. The technique introduces small, neutrally-buoyant particles into the flow and illuminates them with laser light. By comparing images of the illuminated particles, computer algorithms can work out the velocity (and other variables) of a flow. Typical methods use hollow glass spheres or polystyrene beads as the particles that follow the flow, but these options have many downsides. They’re expensive–as much as $200/pound–and they can potentially harm test subjects, like animals whose swimming researchers are studying. Instead, researchers are now looking at biodegradable options for PIV particles.
One study found that corn and arrowroot starches were good candidates, at least for applications using artificial seawater. The powders were close to neutrally-buoyant, had uniform particle sizes, and accurately captured the flow around an airfoil, live brine shrimp, and free-swimming moon jellyfish. (Image credit: M. Kovalets; research credit: Y. Su et al.; via Ars Technica)
Fediverse Reactions
-

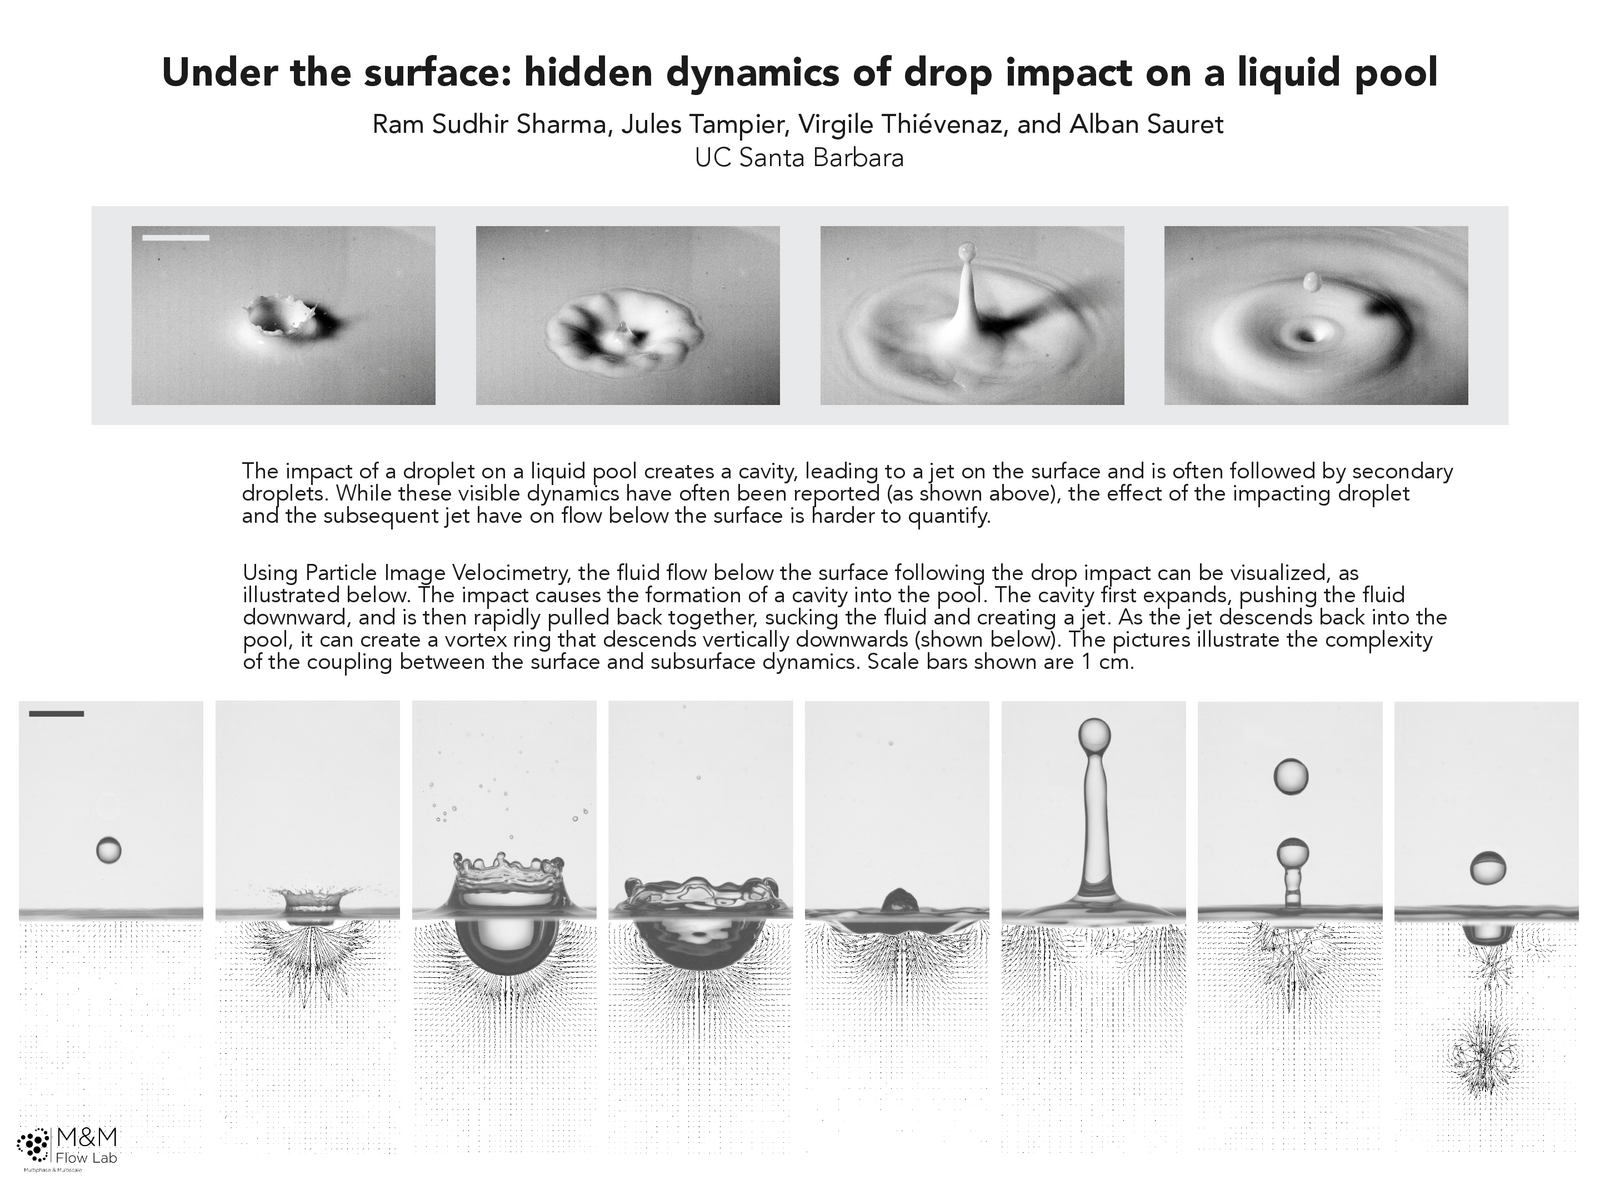
Beneath the Cavity
When a drop falls into a pool of liquid, it creates a distinctive cavity, followed by a jet. From above the surface, this process is well-studied. But this poster offers us a glimpse of what goes on beneath the surface, using particle image velocimetry. This technique follows the paths of tiny particles in the fluid to reveal how the fluid moves.
As the cavity grows, fluid is pushed away. But the cavity’s reversal comes with a change in flow direction. The arrows now point toward the shrinking cavity — and they’re much larger, indicating a strong inward flow. It’s this convergence that creates the Worthington jet that rebounds from the surface. And, as the jet falls back, its momentum gets transferred into a vortex ring that drifts downward from the point of impact. (Image credit: R. Sharma et al.)

Inside Hydroplaning


When a tire spins over a wet roadway, pressure at the front of the tire generates a lifting force; if that lift exceeds the weight of the car, it will start hydroplaning. To prevent this, the grooves of a tire’s tread are designed to redirect the water. Now researchers have visualized flow inside these grooves for the first time, using a version of particle image velocimetry (PIV). PIV techniques use fluorescent particles to track the flow.
The results reveal a complicated, two-phase flow inside the tire grooves. As seen in the images above, bubble columns form inside the tire grooves. The team’s results suggest that the bubble columns depended on groove width, spacing, and intersections with other grooves. They also saw evidence of vortices inside some grooves. (Image credit: tires – S. Warid, others – D. Cabut et al.; research credit: D. Cabut et al.; via Physics World; submitted by Kam-Yung Soh)

Decelerating Jets
For more than a century, scientists have been fascinated by the jet that forms after a drop impacts a liquid. In this study, researchers tracked fluorescent particles in the fluid to understand the velocity and acceleration of flow inside the jet. They found that, within the first 10ms after the jet appears, it decelerates at up to 20 times the gravitational acceleration. That’s much too fast for gravity to cause, pointing instead to the critical importance of surface tension in dictating the behavior of these fast-moving jets. (Image and research credit: C. van Rijn et al.; via APS Physics; submitted by Kam-Yung Soh)

Snowflake Velocimetry
In our era of remote learning, students don’t always have a chance to do hands-on lab experiments in the usual fashion. But that doesn’t mean they can’t explore important flow diagnostic techniques. Here a simple smartphone video of snow falling gets turned into a lesson on particle image velocimetry, or PIV, a major technique for measuring flow velocities.
A nearby house acts as a fixed backdrop, and by comparing snowflake positions from one frame to the next, students can measure the instantaneous flow patterns in the snowfall. Of course, that’s a tedious task to do by hand, but luckily there are computer programs that do it automatically. Simply run the smartphone video through the software, and analyze the patterns it reveals!
As a bonus, students don’t have to get distracted by the complexities of laser sheets and flow seeding that are normally a part of PIV. Instead, the flow and the lighting are already right outside their window, and they can concentrate instead on learning the principles of the technique and how to use the software. (Image and submission credit: J. Stafford)
Phytoplankton Swirl
During the warm summer months, phytoplankton blooms pop up in waters around the world. This natural-color satellite image shows a bloom in the Gulf of Finland. The tiny phytoplankton serve as tracker particles for the flow, revealing large-scale features like the spectacular vortex in the center of this image. The presence of the phytoplankton here suggests that this vortex could be pumping nutrients up from the deep.
Researchers also use particles for flow visualization. This can be as simple as adding small, neutrally buoyant particles, illuminating smoke, or even using natural snowfall to see what’s happening in the flow. (Image credit: NASA/USGS/J. Stevens/L. Dauphin)

Visualizing Flow with Snowfall
One of the challenges in engineering and operating wind turbines is that full-scale turbines rarely behave as predicted in smaller-scale laboratory experiments and simulations. One way to reconcile these differences (and discover what our experiments and simulations are missing) is to take the experiments out into the field. One research group has done this by using snowfall to visualize the flow around wind turbines. In this video, they share some of their observations, which include interactions of tip vortices with one another and with the vortex from the tower. My favorite part starts around 1:50 where you can observe tip vortices leap-frogging one another behind the wind turbine! (Video credit: Y. Liu et al.)

Laser Goggles for Parrotlets


Many experimental techniques in fluid dynamics use lasers. One such technique, particle image velocimetry (PIV), introduces tiny particles into the flow and uses a laser to illuminate the particles. By taking pictures in rapid succession and comparing them, researchers can measure the velocity in different parts of the flow. This technique is incredibly powerful but it’s rarely used to study topics like animal flight, except using mechanical substitutes for live animals.
Part of the reason researchers don’t typically use live animals in this type of experiment is that these very powerful lasers can blind people or animals that aren’t properly protected. So to protect their test subject, Stanford researchers designed and built a special pair of laser safety goggles for their parrotlet. This let the bird fly safely despite the lasers and enabled the researchers to measure flow around realistic bird flight conditions. (Image credit: Stanford News, source, and E. Gutierrez; research credit: E. Gutierrez et al.; submitted by Simon H. via Wired)

Flying with Large Ears
Evolution often requires compromise between competing effects. Large-eared bats, for example, rely on the size of their ears to aid their echolocation, but such large ears can hurt them aerodynamically, thus limiting their flight. Results from a recent experiment, however, suggest that large ears are not a total loss aerodynamically speaking. Researchers used particle image velocimetry to study the wakes behind free-flying, large-eared bats and found significant downward flow behind the bats’ bodies. This indicates that the bats generate some lift with their ears, body, and/or tail. The position and tilt of the ears in flight is similar to forward swept wings, which the authors suggest could help contract the wake behind the ears and reduce its negative influence on flow over the wings. Although the evidence is not yet conclusive, the study does suggest that large ears may be more aerodynamically beneficial than they appear. (Image credit: L. Johansson et al./Lund University, source; via Jalopnik)

The next FYFD webcast will be this Saturday, May 21st at 1pm EDT. My guests will be Professor Jean Hertzberg of the University of Colorado at Boulder and Professor Kate Goodman of the University of Colorado at Denver. Dr. Hertzberg is the creator of the course Flow Visualization, an interdisciplinary course combining engineering, art, and fluid dynamics. It’s a class (and website) that’s been an inspiration for me and FYFD since the early days! Dr. Goodman, an expert in engineering education, earned her PhD studying the Flow Viz course and its impact. This will be wide-ranging discussion – with everything from experimental fluid dynamics and engineering education to art, photography, and hopefully even cardiac fluid dynamics!
(Original images: P. Davis et al.; B. Moore; L. Swift et al.)