Have you ever wondered what happens inside a jet of fluid as it breaks into droplets? Such events are not commonly or readily measured. This video uses a double emulsion–in which immiscible fluids are encapsulated into a multi-layer droplet–to demonstrate interior fluid flow during the Plateau-Rayleigh instability. The innermost drops and the fluid encapsulating them have a low surface tension between them, thanks to the addition of a surfactant to the inner drops. As a result, the inner drops are easily deformed by motion in the fluid surrounding them. Flow on the left side of the jet is clearly parabolic, similar to pipe flow. Closer to the pinch-off, the inner droplets shift to vertical lines, indicating that the interior flow’s velocity is constant across the jet. After pinch-off, the inner droplets return to a spherical shape because they are no longer being deformed by fluid movement around them. The coiling of the inner drops inside the bigger one is due to the electrical charges in the surfactant used. (Video credit: L. L. A. Adams and D. A. Weitz)
Tag: flow visualization

Meeting the Wall
Even something as simple as a falling sphere meeting a wall is composed of beautiful fluid motion. In Figure 1 above, we see side-view images of a sphere at low Reynolds number falling toward a wall over several time. Initially an axisymmetric vortex ring is visible in the sphere’s wake; when the sphere touches the wall, secondary vortices form and the wake vortex moves down and out along the wall in an axisymmetric fashion (Figure 2, top view). At higher Reynolds numbers, like those in Figure 3, this axisymmetric spreading of the vortex ring develops an instability and ultimately breaks down. (Photo credit: T. Leweke et al.)

Reader Question: Does Flow Viz Alter Flow?
") gorbax asks:
gorbax asks: I’ve been wondering for a while, actually, how do we know when the method of flow visualization doesn’t actually alter the flow of a fluid itself?
This is a great question and one that fluid dynamicists have to deal with all the time. Ideally, we’d love to measure everything we want from a flow at all points at all times without doing anything to affect it. In reality, however, that just doesn’t happen. Some measurement techniques are less intrusive than others, but just about everything risks having some effect. This raises two questions: 1) How small can we make that effect? and 2) Do we even care if we’re affecting the flow?
With regards to the first, the onus is typically on the experimentalist to show that whatever visualization technique he/she uses is not significantly affecting the flow. For something like particle image velocimetry, which requires seeding the flow with particles, this means selecting particles that follow the flow rather than changing it and considering carefully how and where to seed the flow such that any added vorticity from the injection does not alter the flow significantly. Checking for this can be done many ways, for example with comparisons to other measurement techniques (with and without seeding) or by comparing to simulation.
The second question–do we care?–is also a significant consideration. Because the purpose of flow visualization is often to get a qualitative feel for the flow field rather than quantitative information, it is often not a significant concern if there is some slight effect from the visualization technique. This can often be the case with smoke-wire and dye visualizations where we just want to see what’s going on.
Finally, there are some instances of flow visualization which are completely unobtrusive to the flow. Schlieren photography and infrared thermography are two examples. Both are optical techniques that act from a distance and take advantage of extant flow properties to make certain features visible. The real key is knowing what technique(s) will work for the flow you have and will give you the information you want. After that, it’s all about proper and thorough execution. (Photo credits: N. Vandenberge et al., T. Omer, M. Canals, P. Danehy et al., A. Wilkens et al., W. Saric et al.)

Visualization Via Temperature
One downside to many flow visualization techniques, like those using dye, smoke, or particles, is the difficulty of dealing with their aftermath. You can only introduce so much of them into a wind or water tunnel before it’s necessary to shutdown and clean everything. One alternative is to use temperature, as shown in the video above. By simply introducing a warmer fluid and using an IR camera, it’s possible to accomplish many of the same effects without the mess. (Video credit: A. Khandekar and J. Jacob; submitted by J. Jacob)

Visualizing F-18 Flow
Flow visualization techniques are helpful outside of wind and water tunnels, too. The photo above comes from the F-18 High Alpha Research Vehicle (HARV) program in which techniques like smoke and dye visualization were used in-flight to visualize airflow around an F-18 at large angles of attack. During flight a glycol-based liquid dye was released from tiny holes along the plane’s forebody, creating the pattern seen here later on the ground. This particular test corresponded to about 26 degrees angle of attack. (Photo credit: NASA Dryden)

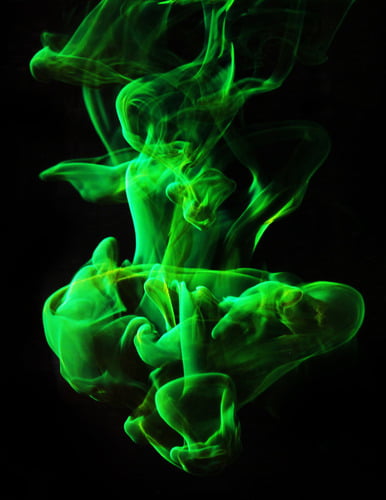
Dye Droplet
A drop of fluorescent dye falling into quiescent water forms fantastical structures that are a mixture of vorticity, turbulence, and molecular diffusion. The horseshoe-like shape near the front of the drop is a typical shape for two fluids strained by moving past one another. The main section of the drop billows outward like a parachute, but the turbulence of its wake stretches the dye into fine threads that quickly disperse in the water. (Photo credit: D. Quinn et al.)
Effects of Hills on Flow
Hills and other topology can have interesting and complex effects on a flowfield. With the FAITH experiment, NASA has been investigating an axisymmetric model hill using a combination of experimental methods. The video above shows flow visualization over the hill in a water channel using dye injection both upstream and downstream of the model. They’ve also done wind tunnel tests with oil-flow visualization, particle-image velocimetry, pressure sensitive paint and other measurement techniques. There are nice photos of some of these by Rob Bulmahn. By combining qualitative and quantitative flow measurement techniques, the researchers are able to capture many different aspects of the flow, which can then be shared and compared with other groups’ works. (Video credit: NASA Ames Research Center)

Mercedes-Benz Tornado


The world’s most powerful artificial tornado is part of the Mercedes-Benz Museum in Stuttgart, Germany. Though popular enough with visitors that the staff will bring out smoke generators to make it visible, the tornado was not built as an attraction – It’s actually part of the building’s fire protection system. The modern open design of the museum meant that conventional smoke removal systems were inadequate. Instead vorticity is generated in the central lobby with 144 wall-mounted jets. The angular velocity created by the jets is strongest at the middle, in the vortex core, due to conservation of angular momentum – exactly the way a spinning ice skater speeds up by pulling his arms in. The core of the vortex is a low pressure area, which draws outside air toward it – this is how the tornado pulls in smoke when there is a fire. The fan on the ceiling provides the pressure draw necessary for the smoke to be pulled up and out of the building at a supposed rate of 4 tons per minute. See the tornado in action here. (Photo credit: Mercedes-Benz Passion; submitted by Ivan)
Flapping Foil Wake
This gorgeous visualization shows the flow behind a flapping foil. Flow in the water tunnel is from right to left, with dye introduced to show streamlines. A flapping foil is a good base model for most flapping flight as well as finned swimming – anything that oscillates to create thrust. As the foil flaps, vorticity is generated and shed along the trailing edge, creating a regularly patterned wake of trailing vortices. (Video credit: R. Godoy-Diana)
(Source: https://player.vimeo.com/)
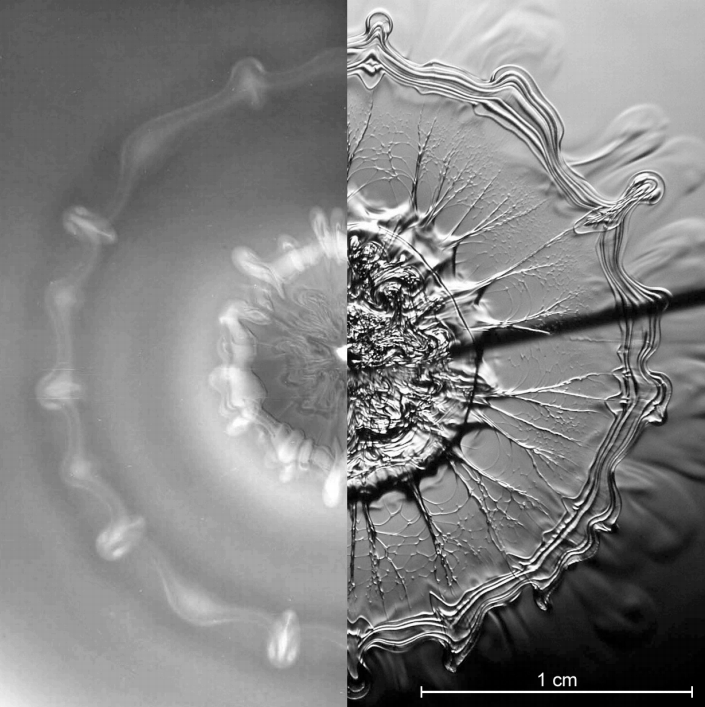
Droplet Impact Visualized
When a drop falls from a moderate height into a shallow pool, its impact creates a complicated pattern. The photo above is a composite image showing a top-down view 100 ms after such an impact. On the left side, the flow is visualized using dye whereas the right shows a schlieren photograph, in which contrast indicates variations in density. Both methods show the same general structure – an inner vortex ring generated at the edge of the impact crater and formed mostly of drop fluid and an outer vortex ring, consisting primarily of pool fluid, formed by the spreading wave. Both regions show signs of instability and breakdown. (Photo credit: A. Wilkens et al.)


")
")
")
")
 and schlieren photograph (right) of a droplet impact (from A. Wilkens et al.)") gorbax
gorbax