Tag: numerical simulation

  • Cars Helping Cyclists

    Cars Helping Cyclists

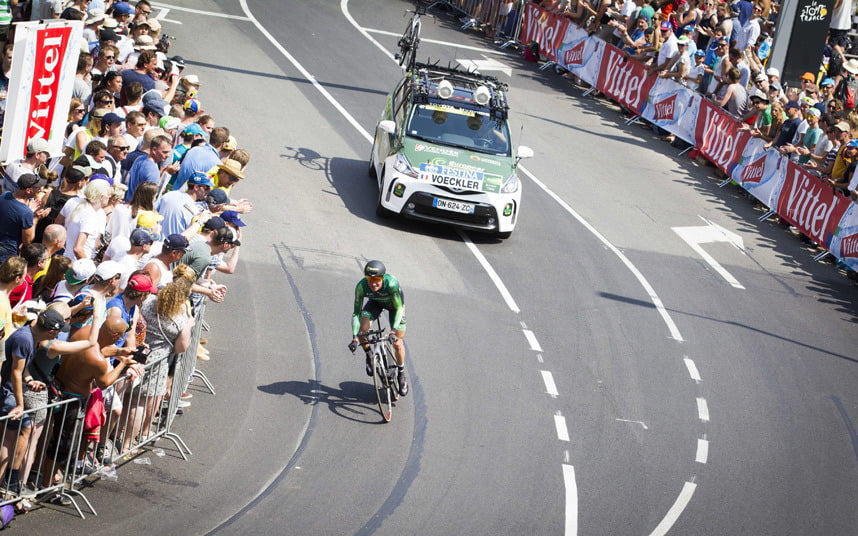
    This year’s Tour de France opened with an individual time trial stage in which riders competed solo against the clock. But, according to numerical simulations, some riders may get an unfair aerodynamic advantage in the race if they have a following car. The top image shows the pressure fields around a rider with a car following 5 meters behind versus 10 meters behind. The size of the car means that it displaces air well in advance of its arrival. By following a rider closely, that car’s high pressure region can help fill in a cyclist’s wake, thereby reducing the drag the rider experiences. For a short time trial like the 13.8 km race that kicked off this year’s tour, a rider whose car follows at 5 meter could save 6 seconds over one whose car followed at the regulation 10 meter distance. (As it happens, the stage was decided by a 5 second margin.) Since not all riders get a team follow car, it’s especially important to ensure that those who do aren’t receiving an additional advantage. For more about cycling aerodynamics, check out our previous cycling posts and Tour de France series. (Image credit: TU Eindhoven, EPA/J. Jumelet; via phys.org; submitted by @NathanMechEng)

  • Featured Video Play Icon

    Inside the Strait of Gibraltar

    When a fluid is stratified into layers, it’s possible to have waves generated and transmitted along the interface between layers. Because these waves remain inside the bulk fluid, they are called internal waves. They often occur in the atmosphere or the ocean as fluids with different properties move past changing terrain. The Strait of Gibraltar is an excellent source of internal waves. The tidal exchange of waters between the Mediterranean Sea and Atlantic Ocean takes place through a narrow corridor interrupted by the peak of Camarinal Sill. The internal waves generated by the constriction are large enough that their effect on the surface flow is visible to satellites. The video above visualizations data from a numerical simulation of flow through the Strait, showing the obstacles, flow, and wave structures generated. (Video credit: J.C. Sanchez Garrido et al.)

  • Supernova Simulation

    Supernova Simulation

    New research shows that supermassive first-generation stars may explode in supernovae without leaving behind remnants like black holes. The work is a result of modeling the life and death of stars 55,000 to 56,000 times more massive than our sun. When such stars reach the end of their lives, they become unstable due to relativistic effects and begin to collapse inward. The collapse reinvigorates fusion inside the star and it begins to rapidly fuse heavier elements like oxygen, magnesium, or even iron from the helium in its core. Eventually, the energy released overcomes the binding energy of the star and it explodes outward as a supernova. The image above is a slice through such a star approximately one day after its collapse is reversed. Hydrodynamic instabilities like the Rayleigh-Taylor instability produce mixing of the heavy elements throughout the expanding interior of the star. The mixing should produce a signature that can be observed in the aftermath as these stars seed their galaxies with the heavy elements needed to form planets. For more, see Science Daily and Chen et al. (Image credit: K. Chen et al., via Science Daily; submitted by mechanicoolest)

  • Featured Video Play Icon

    City Winds Simulated

    Anyone who has spent much time in an urban environment is familiar with the gusty turbulence that can be generated by steady winds interacting with tall buildings. To the atmospheric boundary layer–the first few hundred meters of atmosphere just above the ground–cities, forests, and other terrain changes act like sudden patches of roughness that disturb the flow and generate turbulence. The video above shows a numerical simulation of flow over an urban environment. The incoming flow off the ocean is relatively calm due to the smoothness of the water. But the roughness of an artificial island just off the coast acts like a trip, creating a new and more turbulent boundary layer within the atmospheric boundary layer. It’s this growing internal boundary layer whose turbulence we see visualized in greens and reds. (Video credit: H. Knoop et al.)

  • Supernova Explosion

    Supernova Explosion

    Type 1a supernovae occur in binary star systems where a dense white dwarf star accretes matter from its companion star. As the dwarf star gains mass, it approaches the limit where electron degeneracy pressure can no longer oppose the gravitational force of its mass. Carbon fusion in the white dwarf ignites a flame front, creating isolated bubbles of burning fluid inside the star. As these bubbles burn, they rise due to buoyancy and are sheared and deformed by the neighboring matter. The animation above is a visualization of temperature from a simulation of one of these burning buoyant bubbles. After the initial ignition, instabilities form rapidly on the expanding flame front and it quickly becomes turbulent. (Image credit: A. Aspden and J. Bell; GIF credit: fruitsoftheweb, source video; via freshphotons)

  • Hummingbird Hovering

    Hummingbird Hovering

    The hummingbird has long been admired for its ability to hover in flight. The key to this behavior is the bird’s capability to produce lift on both its downstroke and its upstroke. The animation above shows a simulation of hovering hummingbird. The kinematics of the bird’s flapping–the figure-8 motion and the twist of the wings through each cycle–are based on high-speed video of actual hummingbirds. These data were then used to construct a digital model of a hummingbird, about which scientists simulated airflow. About 70% of the lift each cycle is generated by the downstroke, much of it coming from the leading-edge vortex that develops on the wing. The remainder of the lift is creating during the upstroke as the bird pulls its wings back. During this part of the cycle, the flexible hummingbird twists its wings to a very high angle of attack, which is necessary to generate and maintain a leading-edge vortex on the upstroke. The full-scale animation is here. (Image credit: J. Song et al.; via Wired; submitted by averagegrdy)

  • Featured Video Play Icon

    The Upside-Down Jellyfish

    The upside-down jellyfish, Cassiopea, rests its bell against the ocean floor and points its frilly oral arms up toward the sun for the benefit of the symbiotic algae living on it. In return, the algae provide some of the nutrients the jellyfish needs. The rest it obtains by filter feeding for zooplankton. The video above shows how a combination of flow visualization and simplified computational modeling can reveal the jellyfish’s methods for eating. A simple pulsing bell has limited fluid flow in the region of the jellyfish’s mouths, but the addition of a permeable layer (representative of the oral arms) significantly enhances mixing. (Video credit: T. Rodriguez et al.)

  • Protostellar Jets

    Protostellar Jets

    As young stars form, they often produce narrow high-speed jets from their poles. By astronomical standards, these fountains are dense, narrowly collimated, and quickly changing. The jets have been measured at velocities greater than 200 km/s and Mach numbers as high as 20. The animation above (which you should watch in its full and glorious resolution here) is a numerical simulation of a protostellar jet. Every few decades the source star releases a new pulse, which expands, cools, and becomes unstable as it travels away from the star. Models like these, combined with observations from telescopes like Hubble, help astronomers unravel how and why these jets form. (Image credit: J. Stone and M. Norman)

    ETA: As it happens, the APOD today is also about protostellar jets, so check that out for an image of the real thing. Thanks, jshoer!

  • Featured Video Play Icon

    The Structure of Turbulence

    Though they may appear random at first glance, turbulent flows do possess structure. The video above shows a numerical simulation of a mixing layer, a flow in which two adjacent regions of fluid move with different velocities. The upper third of the frame shows a top view, and the bottom frame shows a side view, in which the upper fluid layer moves faster than the lower one. The difference in velocities creates shear which quickly drives the mixing layer into turbulence. But watch the chaos carefully, and your eye will pick out vortices rolling clockwise in the largest scales of the mixing layer. These features are known as coherent structures, and they are key to current efforts to understand and model turbulent flows. (Video credit: A. McMullan)

  • Featured Video Play Icon

    Stingray Wakes

    This numerical simulation shows a swimming stingray and the vorticity generated by its motion. Stingrays are undulatory swimmers, meaning that the wavelength of their motion is much shorter than their body length. Manta rays, in contrast, move their fins through a wavelength longer than their body length, making them oscillatory swimmers. Observe the difference in this video. To swim faster, stingrays increase the frequency of their undulation, not the amplitude. This is quite common among swimmers because increasing the amplitude also increases projected frontal area, which causes additional drag. Increasing the frequency of motion does not affect the projected area, making it the more efficient locomotive choice. (Video credit: G. Weymouth; additional research credit: E. Blevins; submitted by L. Buss)

    Also, FYFD now has a Google+ page for those who prefer to follow along and share that way. – Nicole