Tag: tour de france

  • Reader Question: Drafting in Time Trials

    Reader Question: Drafting in Time Trials

    In a comment on this recent post regarding drafting advantages to a leader, reader fey-ruz asks:

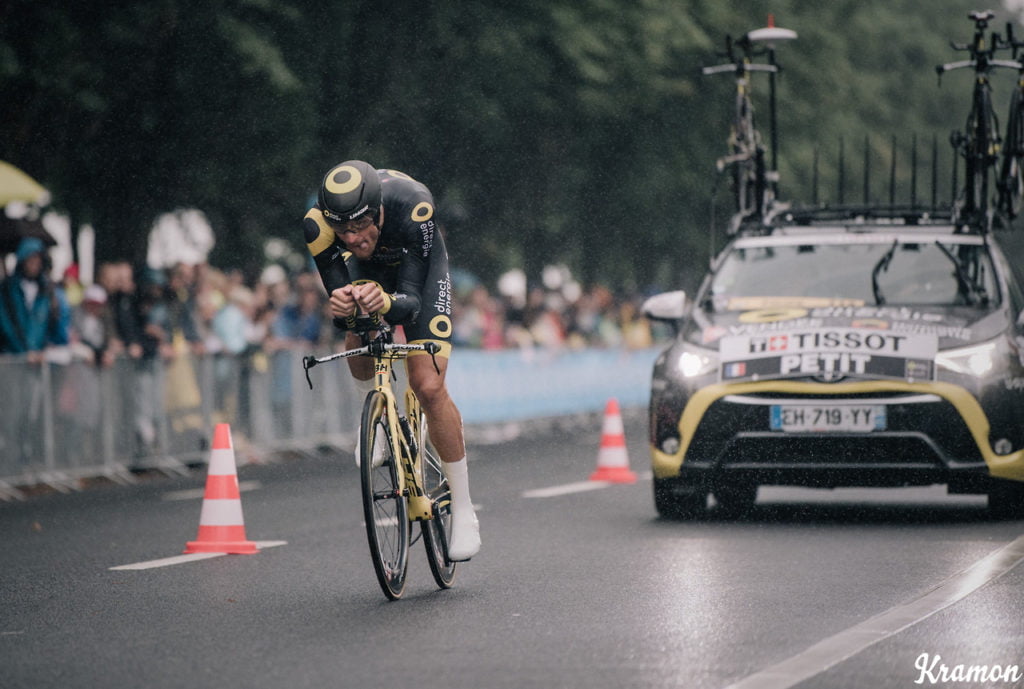
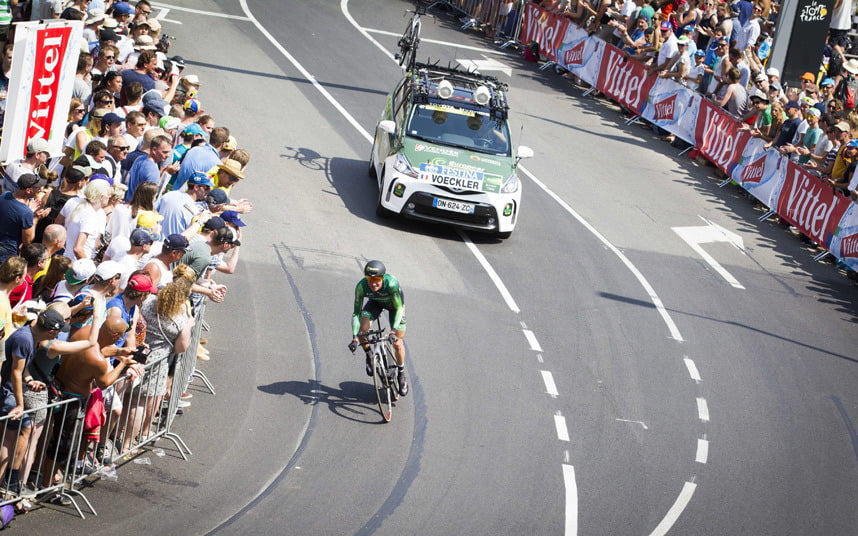
    in cycling, team follow cars are required to maintain a minimum distance from their riders during time trials for this very reason (although i imagine the effects in that context are much smaller and dependent on the conditions, esp the wind speed, direction, and strength). FYFD, is there a simple way to understand where this upstream influence comes from? or a specific term in the navier-stokes equations that it results from?

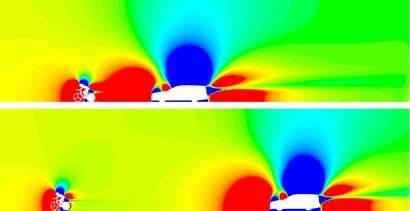
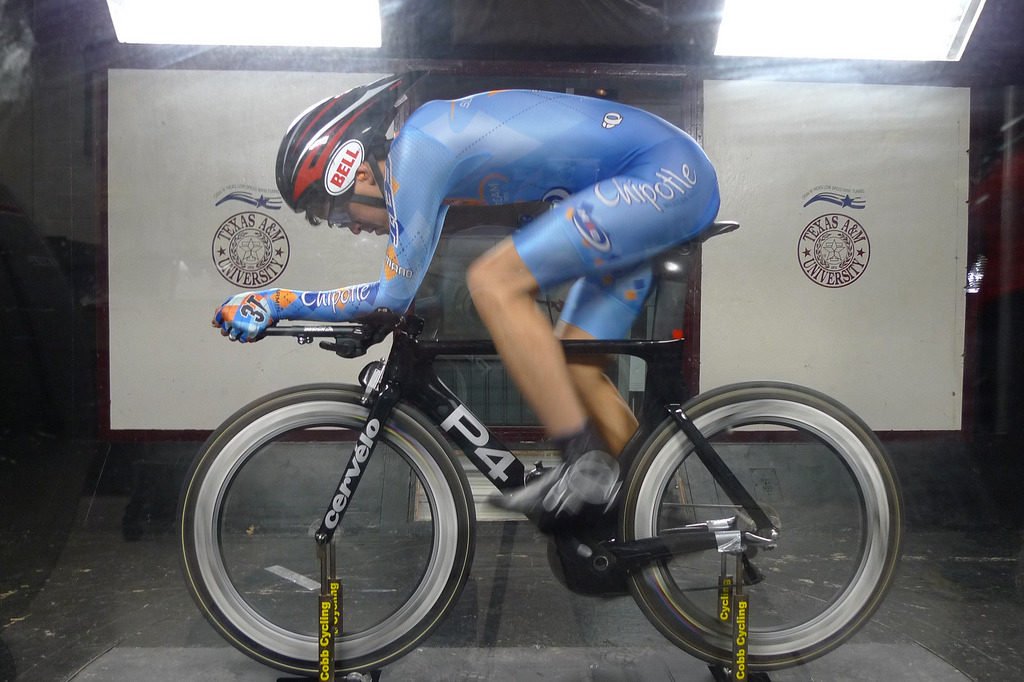
    Cars following riders during a time trial can actually make a huge difference! One study from a couple of years ago estimated that a car following a rider in a short (13.8 km) time trial could take 6 seconds off the rider’s time. The images up top show a simulation from that study with a car following at 5 meters versus 10 meters. The colors indicate the pressure field around the car and rider. Red is high pressure, blue is low pressure. Both the car and the rider have high pressure in front of them; you can think of this as a result of them pushing the air in front of them.

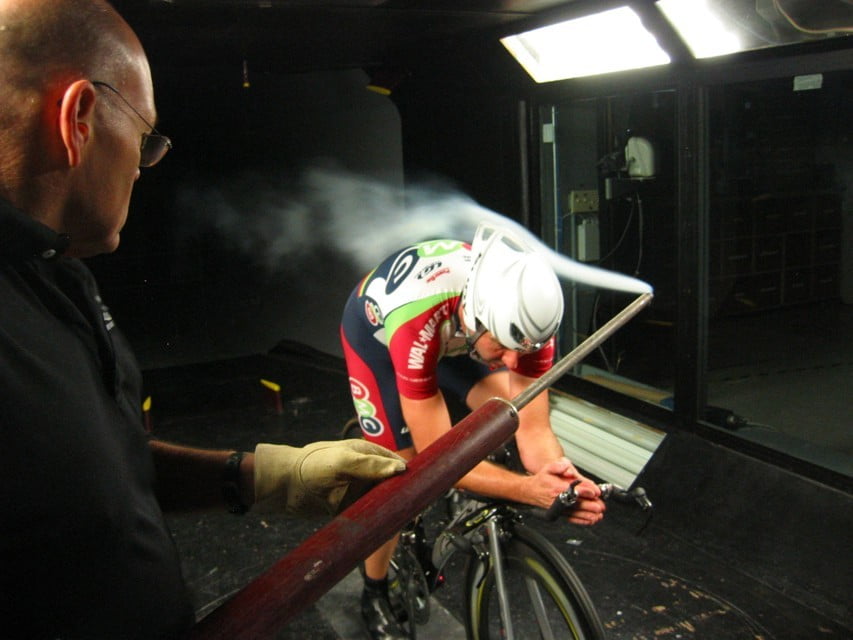
    A large part of the rider’s drag comes from the difference in pressure ahead and behind them. (For a look at flow around a cyclist that focuses on velocity instead, check out my video on cycling aerodynamics.) When a car drives close behind a cyclist, it’s essentially pushing air ahead of it and into the cyclist’s wake. This actually reduces the difference in pressure between the cyclist’s front and back sides, thereby reducing his drag. Because cars are large, they have an oversized effect in this regard, but having a motorbike or another rider nearby also helps the lead cyclist aerodynamically.

    As for the Navier-Stokes equation – this effect isn’t one that you can really pin down to a single term since it’s a consequence of the flow overall. (Image credits: TU Eindhoven; K. Ramon)

  • Cycling Skinsuits and Vortex Generators

    Cycling Skinsuits and Vortex Generators

    It didn’t take long for an aerodynamic controversy to crop up in this year’s Tour de France. At the 14km individual time trial, riders from Team Sky wore custom Castelli skinsuits with integrated dot-like patterns on their upper arms (shown above). By the next day, a sports scientist with a competing team cried foul play, claiming that these fabrics could have given Team Sky as much as 25 seconds’ advantage over other riders. The Sky team finished with 4 out of the top 10 places on the time trial, and their leader, three-time Tour winner Chris Froome, finished some 35 seconds ahead of his expected competitors for the yellow jersey.

    Vortex generators explained

    So how could a few dots make a measurable difference? These protrusions are vortex generators meant to modify flow around a cyclist. Humans are not aerodynamic and what typically happens when air flows over a cyclist’s arms is shown in the flow visualization above: the air follows the curve of the arm part way, then it separates from the body, leaving a region of recirculation that increases drag. Vortex generators can help prevent or delay that drag-inducing flow separation by adding extra energy and turbulence to the air near the arm’s surface. Because turbulent boundary layers can follow a curve longer before separating, this helps reduce the drag by reducing the recirculation zone.

    About that time savings

    Aerodynamically speaking, those vortex generators can make a difference, but the question is, how much? In his complaint, Grappe cites a 2016 paper by L. Brownlie et al. that wind-tunnel tested different vortex generator patterns for use in running apparel. The speeds tested included those relevant to cycling. The specific numbers Grappe quotes aren’t directly relevant, however:

    As noted above, race garments that contain VG provide reductions in Fd of between 3.7 and 6.8% compared to equivalent
    advanced race apparel developed for the 2012 London Olympics which in turn provided substantially lower drag than
    conventional race apparel.

    the effectiveness of 5, 10 and 15 cm wide strips of VG applied to each flank of a sleeveless singlet revealed that the 5 cm wide
    strips provided between 3.1 and 7.1% less Fd than the 10 cm wide strips and between 1.9 and 4.3% less Fd than the 15 cm wide
    strips.  

    Here Brownlie et al. are specifically describing the savings for running apparel, which uses vortex generators in very different places than you would on a cyclist. Note the second quote even refers to a sleeveless singlet, so the vortex generators measured are definitely not in the same place as these skinsuits!

    The bottom line

    I fully expect that vortex generators give a marginal aerodynamic edge, which is why Sky and other teams have already been using them in competition. But I hesitate to declare that the savings is as high as 5-7%, and I have no way to verify Grappe’s subsequent claims that this translates to 18-25 seconds in the time trial. Those are numbers he gives without citing what model is being used to translate drag gains into time.

    In the end, what is needed is clarification of the rules. As they stand, one rule seems to allow the skinsuits because the vortex generators are integrated into the fabric, whereas another states clothing is forbidden “to influence the performances of a rider such as reducing air resistance”. Those two stances seems contradictory, and, for now, the race officials’ verdict to allow the suits stands.

    If you want to learn more about aerodynamics and cycling, be sure to check out my latest FYFD video. (Image credits: B. Tessier/Reuters; Getty Images; L. Brownlie et al. 2009; h/t to W. Küper)

  • How Cycling Position Affects Aerodynamics

    How Cycling Position Affects Aerodynamics

    New FYFD video! How much does a rider’s position on the bike affect the drag they experience? To find out I teamed up with folks from the University of Colorado at Boulder and at SimScale to explore this topic using high-speed video, flow visualization, and computational fluid dynamics. 

    Check out the full video below, and if you need some more cycling science before the Tour de France gets rolling, you can find some of my previous cycling-related posts here. (Image and video credit: N. Sharp; CFD simulation – A. Arafat)

    ETA: Please note that the video contained in this post was sponsored by SimScale.

  • Cars Helping Cyclists

    Cars Helping Cyclists

    This year’s Tour de France opened with an individual time trial stage in which riders competed solo against the clock. But, according to numerical simulations, some riders may get an unfair aerodynamic advantage in the race if they have a following car. The top image shows the pressure fields around a rider with a car following 5 meters behind versus 10 meters behind. The size of the car means that it displaces air well in advance of its arrival. By following a rider closely, that car’s high pressure region can help fill in a cyclist’s wake, thereby reducing the drag the rider experiences. For a short time trial like the 13.8 km race that kicked off this year’s tour, a rider whose car follows at 5 meter could save 6 seconds over one whose car followed at the regulation 10 meter distance. (As it happens, the stage was decided by a 5 second margin.) Since not all riders get a team follow car, it’s especially important to ensure that those who do aren’t receiving an additional advantage. For more about cycling aerodynamics, check out our previous cycling posts and Tour de France series. (Image credit: TU Eindhoven, EPA/J. Jumelet; via phys.org; submitted by @NathanMechEng)

  • Tour de France Physics: Wind Tunnel Testing

    Tour de France Physics: Wind Tunnel Testing


    Over hours of racing, even a few grams of drag can be the difference between the top of the podium and missing out. For manufacturers as well as for individual professional cyclists, hours of wind tunnel testing help determine optimum configurations of equipment and positioning. During a day of wind tunnel testing, a cyclist may complete dozens of runs, in which bikes, wheels, helmets, skinsuits, and positioning are all tested and tweaked to find the best combination of aerodynamics.

    But wind tunnel results don’t always translate perfectly to the road, where buildings, people, cars and other cyclists may interfere with the freestream. And, as any cyclist will attest, the wind is constantly shifting and changing speeds as one rides. The Garmin-Cervelo pro team has developed a rig to measure wind speeds and angles experienced by cyclists in real world conditions. (The exact components used are unclear, but probably include some form of Pitot tube or 5-hole probe.) As more on-the-road data is collected, wind tunnel tests can be improved by placing greater emphasis on the most common wind angle conditions. (Photo credits: John Cobb, Flo Cycling, and Nico T)

    This completes FYFD’s weeklong celebration of the Tour de France and the fluid dynamics of cycling. See previous posts on drafting in the peloton, pacelining and echelons, the art of the sprint lead-out train, and the aerodynamics of time-trialing.

  • Tour de France Physics: Time Trials

    Tour de France Physics: Time Trials

    Unlike road stages in which cyclists can draft off one another to reduce drag, in the time trial a cyclist is on a solo race against the clock with nowhere to hide. As a result, the event features lots of technologies designed to reduce both pressure drag and skin friction on the cyclist. For time trials, cyclists wear skinsuits and shoe covers to eliminate any sources of flapping fabrics and to reduce skin friction. They ride bicycles designed to be as light and aerodynamic as possible. Instead of rounded tubing in the frames, these bikes consist of elongated airfoil profiles that direct air past and prevent separation that may increase pressure drag. The rims of their tires are wider and the back wheel is replaced with a disc wheel that allows no airflow aross the wheel. Like the airfoil tubing, these changes help prevent separation. Similarly, riders wear elongated helmets designed to be as aerodynamic as possible while the rider is in the “aero” position, with arms directed out over the wheels, head level, elbows tucked, and back flat. In wind tunnel tests, the rider best able to hold this position will experience the least drag. Even the addition or subtraction of a water bottle is not left to chance, with many time trial bikes designed to be more aerodynamic with a water bottle onboard (though you probably won’t catch the cyclists breaking their aero position to get a drink)! (Photos by Veeral Patel)

    FYFD is celebrating the Tour de France with a weeklong exploration of the fluid dynamics of cycling. See previous posts on drafting in the peloton, and pacelining and echelons, and the art of the lead-out train.

  • Tour de France Physics: Lead-Out Trains

    [original media no longer available]

    One of the most impressive cycling techniques for drag reduction on a rider is the lead-out train that delivers a sprinter to the finish line. No current team is better at this than HTC-Highroad. Watch for them in the white and yellow from about ~4:00 in the above video.

    The lead-out train begins 5 km or so before the line, with the entire team in a line at the front of the peloton with the sprinter in the final position. The rider at the front will ride for as long and hard as he can, ensuring that the pace is such that no riders from the main field are able to pull ahead. This accelerates the sprinter to higher speeds while sheltering him in the wake of the rest of the team.

    One by one, the riders of the team will do their time at the front, expending their energy while protecting the sprinter. The final lead-out rider will be sprinting a few hundred meters from the finishing line; at this point the sprinter in the back may be riding 70 kph while enjoying protection from the wind. Finally, with the finish line in sight, he will swing out around his lead-out man and go all out for the line. Sprinters can hit speeds of nearly 80 kph in these short bursts.

    FYFD is celebrating the Tour de France with a weeklong exploration of the fluid dynamics of cycling. See previous posts on drafting in the peloton, and pacelining and echelons.

  • Featured Video Play Icon

    Tour de France Physics: Breakaways

    In cycling, a small group of riders often leave the protection of the peloton in a breakaway. These riders will often spend 80% or more of a stage or race outside of the peloton, trying to reach the finish line before they’re caught. Because the pressure drag is so draining on a lone cyclist, it’s vital that breakaway riders work together. When the wind comes predominantly from the front or back, riders will form one or two lines, riding with their wheels within a foot of one another (see ~0:23). This paceline rotates so that every rider takes a turn at the front, bearing the brunt of the effort while other cyclists recover in their wake, where they experience less drag.

    If the wind blows predominantly across the riders, they will form a diagonal line with the frontmost rider rotating behind for shelter from the wind after a pull. This drag reduction technique is called an echelon (see ~1:40). As seen above, for experienced riders the echelon can protect individuals even in bike-stealingly high winds.

    FYFD is celebrating the Tour de France with a weeklong exploration of the fluid dynamics of cycling. See part one on drafting in the peloton.

  • Tour de France Physics: Pelotons

    Tour de France Physics: Pelotons

    July is well underway and for cycling fans around the world that means it’s time for the Tour de France. This week at FYFD we’re going to do something a little different: in honor of cycling’s biggest race, every post this week will focus on some of the fluid dynamics involved in the sport.

    On a bicycle, except when climbing, the majority of a rider’s energy goes toward overcoming aerodynamic drag. Riders wear close-fitting clothes to reduce skin friction and loss to flapping fabric, but most of their drag is pressure-based. A blunt object disturbs the airflow around it, usually resulting in separated flow in its wake. A high pressure region forms in front of the rider and a low pressure region forms in the separated flow behind them. This pressure difference literally pulls the rider backwards. Since drag goes roughly as speed squared, adding a headwind makes matters even worse for a cyclist.

    In races, especially on flat stages, the majority of the riders will stay in a large group called a peloton in order to counteract these aerodynamics. By riding in the wakes of those in the front, riders in the peloton experience a much smaller front-to-back pressure difference and thus much less drag. For a rider in the midst of the peloton, the drag reduction can be as great as 40% (#). This allows riders to conserve energy for solo efforts near the end of the race or stage, like breaking away from the peloton in the final kilometers or winning a sprint for the finish line. (Photo credit: Wade Wallace)