A telescope’s resolution is set by the size of its reflective surface. Our largest space telescope, JWST, has a 6.5-meter reflector, the largest we could manage given manufacturing constraints and the need to launch it in a rocket. To reach even larger sizes, researchers are considering a new type of reflector: one made of liquid.
A fluidic telescope has some obvious advantages: surface tension makes it atomically smooth, and liquids can be packed into any convenient shape for launch. But there are challenges, also. Like, what happens to the reflector when you point it in an new direction?
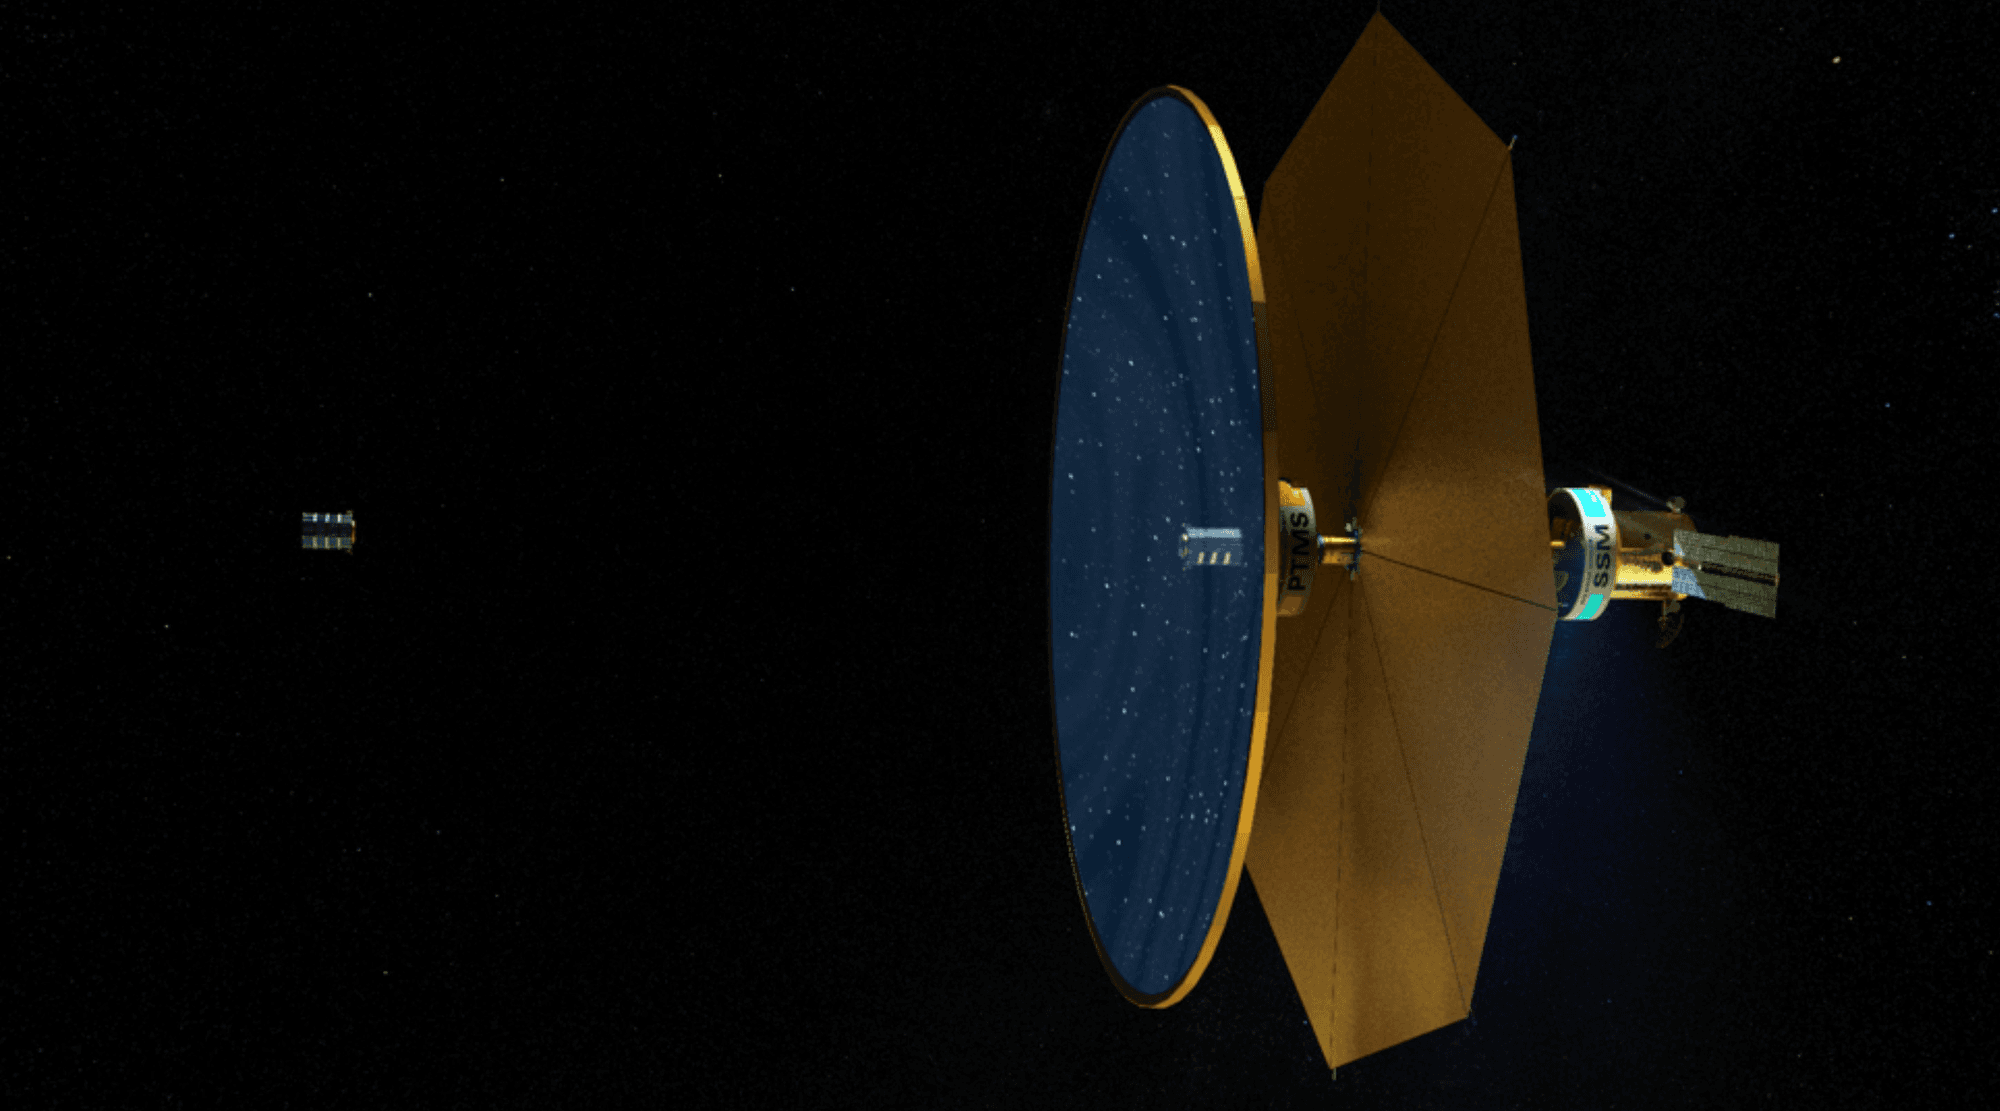
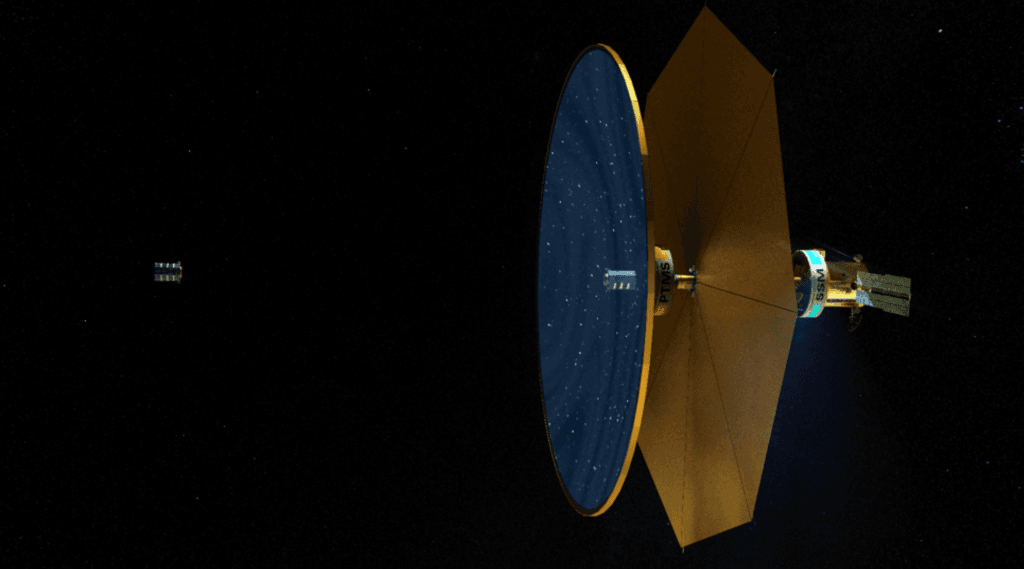
That’s what this study looks at, mathematically. Using a mathematical model of a 50-meter-wide, millimeter-thick fluid, the researchers analyzed how different maneuvers over the telescope’s lifetime would affect the image quality.
Shifting the reflector creates perturbations in the surface, initially at the mirror’s edges. Over time, those perturbations move toward the center of the mirror and, at the same time, decay. The team found that, while typical space telescope operations distorted parts of the mirror beyond the limits of good optical quality, the inner 80% of the mirror could remain undisturbed for twenty or more years. That would be like having a 40-meter telescope in orbit with more than 6x the resolution of JWST. (Image credit: NASA; research credit: I. Gabay et al.)


 and milling (rotating about a central point). Text reads, \"One Hundred Fish. Schooling. Milling. Different combinations of parameter sets produce distinct emergent formations.\"")