
Since 2006, Adidas has unveiled a new football design for each FIFA World Cup. This year’s ball, the Brazuca, is the first 6-panel ball and features glued panels instead of stitched ones. It also has a grippy surface covered in tiny nubs. Wind tunnel tests indicate the Brazuca experiences less drag than other recent low-panel-number footballs as well as less drag than a conventional 32-panel ball. Its stability and trajectory in flight are also more similar to a conventional ball than other recent World Cup balls, particularly the infamous Jabulani of the 2010 World Cup. The Brazuca’s similar flight performance relative to a conventional ball is likely due to its rough surface. Like the many stitched seams of a conventional football, the nubs on the Brazuca help trip flow around the ball to turbulence, much like dimples on a golf ball. Because the roughness is uniformly distributed, this transition is likely to happen simultaneously on all sides of the ball. Contrast this with a smooth, 8-panel football like the Jabulani; with fewer seams to trip flow on the ball, transition is uneven, causing a pressure imbalance across the ball that makes it change its trajectory. For more, be sure to check out the Brazuca articles at National Geographic and Popular Mechanics, as well as the original research article. (Photo credit: D. Karmann; research credit: S. Hong and T. Asai)
Search results for: “transition”

The Reynolds Experiment
One of the most famous and enduring of all fluid dynamics experiments is Osborne Reynolds’ pipe flow experiment, first published in 1883 and recreated in the video above. At the time, it was understood that flows could be laminar or turbulent, though Reynolds’ terminology of direct or sinuous is somewhat more poetic:
Again, the internal motion of water assumes one or other of two broadly distinguishable forms-either the elements of the fluid follow one another along lines of motion which lead in the most direct manner to their destination, or they eddy about in sinuous paths the most indirect possible. #
There had, however, been no direct evidence of these eddies in a pipe. Reynolds built an apparatus that allowed him to control the velocity of flow through a clear pipe and simultaneously introduce a line of dye into the flow. He carefully varied the velocity and temperature (and thus viscosity) in his apparatus and not only documented both laminar and turbulent flow but found that the transition from one to another could be described by a dimensionless number he derived from the Navier-Stokes equation. This number was dependent on the fluid’s velocity and kinematic viscosity as well as the diameter of the pipe. This was the birth of the Reynolds number, one of the most important parameters in all of fluid dynamics. (Video credit: S. dos Santos; research credit: O. Reynolds)
Shooting a Bullet Through a Water Balloon
This high-speed video of a bullet fired into a water balloon shows how dramatically drag forces can affect an object. In general, drag is proportional to fluid density times an object’s velocity squared. This means that changes in velocity cause even larger changes in drag force. In this case, though, it’s not the bullet’s velocity that is its undoing. When the bullet penetrates the balloon, it transitions from moving through air to moving through water, which is 1000 times more dense. In an instant, the bullet’s drag increases by three orders of magnitude. The response is immediate: the bullet slows down so quickly that it lacks the energy to pierce the far side of the balloon. This is not the only neat fluid dynamics in the video, though. When the bullet enters the balloon, it drags air in its wake, creating an air-filled cavity in the balloon. The cavity seals near the entry point and quickly breaks up into smaller bubbles. Meanwhile, a unstable jet of water streams out of the balloon through the bullet hole, driven by hydrodynamic pressure and the constriction of the balloon. (Video credit: Keyence)
How Air Dancers Dance
Air dancers–those long fabric tubes with fans blowing into the bottom–are a popular way for shops to draw attention. They bend and flutter, shake and kink, all due to the interaction of airflow in and around them with the fabric. When the interior flow is smooth and laminar, the tube will stand upright, with very little motion. As the air inside transitions, some fluttering of the tube can be observed. Ultimately, it is when the air flow becomes turbulent that the cloth really dances. Variations in the flow are strong enough at this point that the tube will occasionally buckle. Behind this constriction, the flow pressure increases until its force is enough to overcome the weight of the tube and lift it once more. (Video credit: A. Varsano)
Rebounding Off Dry Ice
Droplet rebound is frequently associated with superhydrophobic surfaces but can also be generated by very large temperature differences. For very hot substrates, a thin layer of the drop vaporizes on contact via the Leidenfrost effect and helps a drop rebound by preventing it from wetting the surface. This video shows almost the opposite: a water droplet hitting solid carbon dioxide (-79 degrees C). Upon contact, the solid carbon dioxide sublimates, creating a thin layer of gas that separates the droplet from the surface. You can also see the vortex ring that accompanies the drop’s impact. Water vapor near the carbon dioxide surface has condensed into tiny airborne droplets that act as tracer particles that reveal the vortex’s formation and the rebounding droplet’s wake. (Video credit: C. Antonini et al.; Research paper)

Dendritic Designs
Imagine a thin layer of viscous liquid sandwiched between two horizontal glass plates. Then pull those plates apart at a constant velocity. What you see in the image above is the shape the viscous fluid takes for different speeds, with velocity increasing from left to right and from top to bottom. For lower velocities, the fluid forms tree-like fingers as air comes in from the edges. At higher velocities, though, there’s a transition from the finger-like pattern to a cell-like one. The cells are actually caused by cavitation within the fluid. When the plates are pulled apart fast enough, the local low pressure in the fluid causes cavitation bubbles to form just before the force required to remove the plate reaches its peak. (Photo credit: S. Poivet et al.)
Stalling
[original media no longer available]
At high angles of attack, the flow around the leading edge of an airfoil can separate from the airfoil, leading to a drastic loss of lift also known as stall. Separation of the flow from the surface occurs because the pressure is increasing past the initial curve of the leading edge and positive pressure gradients reduce fluid velocity; such a pressure gradient is referred to as adverse. One way to prevent this separation from occurring at high angle of attack is to apply suction at the leading edge. The suction creates an artificial negative (or favorable) pressure gradient to counteract the adverse pressure gradient and allows flow to remain attached around the shoulder of the airfoil. Suction is sometimes also used to control the transition of a boundary layer from laminar to turbulent flow.

Lenticular Clouds
Lenticular clouds, such as the one shown above, are stationary lens-shaped clouds that form over a mountain or range of mountains. Moist air is deflected up over the mountain, and, if the temperature at higher altitudes is below that of the dew point, the water vapor in the air can condense, forming a cloud that sits over the peak of the mountain. Once the air traverses the mountain and reaches warmer, lower altitudes on the far side, it will often transition back to a gaseous state. Lenticular clouds are sometimes also called UFO clouds, due to their distinctive shape and the way they seem to hover over a peak. (Photo credit: James Woodcock, Billings Gazette via Associated Press)
Swirling Jets
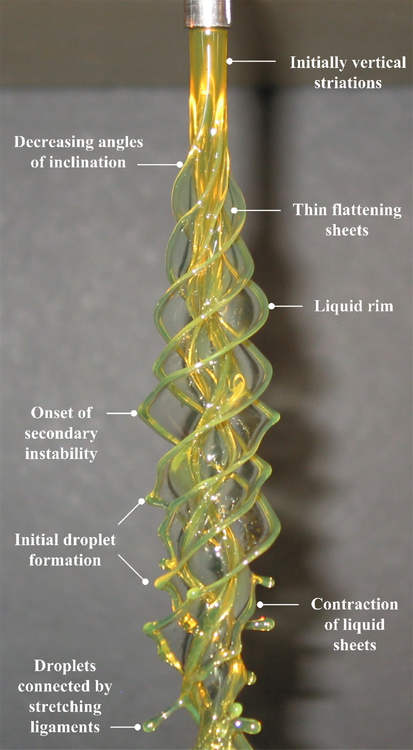
In fluid dynamics, we like to classify flows as laminar–smooth and orderly–or turbulent–chaotic and seemingly random–but rarely is any given flow one or the other. Many flows start out laminar and then transition to turbulence. Often this is due to the introduction of a tiny perturbation which grows due to the flow’s instability and ultimately provokes transition. An instability can typically take more than one form in a given flow, based on the characteristic lengths, velocities, etc. of the flow, and we classify these as instability modes. In the case of the vertical rotating viscous liquid jet shown above, the rotation rate separates one mode (n) from another. As the mode and rotation rate increase, the shape assumed by the rotating liquid becomes more complicated. Within each of these columns, though, we can also observe the transition process. Key features are labeled in the still photograph of the n=4 mode shown below. Initially, the column is smooth and uniform, then small vertical striations appear, developing into sheets that wrap around the jet. But this shape is also unstable and a secondary instability forms on the liquid rim, which causes the formation of droplets that stretch outward on ligaments. Ultimately, these droplets will overcome the surface tension holding them to the jet and the flow will atomize. (Video and photo credits: J. P. Kubitschek and P. D. Weidman)

Reader Question: How Useful is Flow Viz?
")

")
")
")

Reader Andrew asks:
I’ve noticed you’ve posted a bunch of flow visualization/wind tunnel content. I’m just curious where how useful information is obtained from these. Is it just observation? Or are there instruments that are usually used in conjunction with these techniques to provide data?
Great question, Andrew! The answer can vary based on the technique and application. In some cases, flow visualization is used for purely qualitative observation, but in others it can provide more quantifiable data. For example, the water tunnel flow visualization of Google’s heliostat array gave very qualitative data about flow around a given configuration but allowed quick evaluation of many configurations. Flow visualization can also help identify key features for additional study like vortices in a wake. This identification of structure can be so useful that even in computational fluid dynamics, where researchers have all possible information about pressure, temperature, and velocity in a flow field, flow visualization is regularly used to identify underlying structures.
Some flow visualization methods can also give very specific information. Oil-flow visualization gives a snapshot of shear stress at the surface of an object, letting an engineer identify at a glance areas of laminar and turbulent flow as well as regions with vortices and streaks. Naphthalene flow visualization and infrared thermography are both great for identifying the location of laminar-turbulent transition and can do so across the span of an object, which is much easier than trying to traverse a probe across the entire object. And some forms of flow visualization allow for extraction of velocity field information, as in particle image velocimetry. In this technique, tiny particles seed the flow and carefully timed image pairs are taken and correlated to determine the flow field velocity based on the changes in particle positions between images.
Like every measurement, flow visualization methods have their strengths and limitations. But for many applications, flow visualization provides much more than just pretty pictures and thus remains an important tool in any fluid dynamicist’s arsenal!