
Soap films provide a simple and convenient method for flow visualization. Here an allen wrench swept upward through a soap film leaves a distinctive wake. This trail of counter-rotating vortices is known as a von Karman vortex street. Their spacing depends on the wrench’s size and speed. Although the von Karman vortex street is usually associated with the wake of cylinders, it shows up often in nature as well, especially in the clouds trailing rocky islands. (Photo credit: P. Nathan)
Search results for: “flow visualization”
Phytoplankton Flow Viz
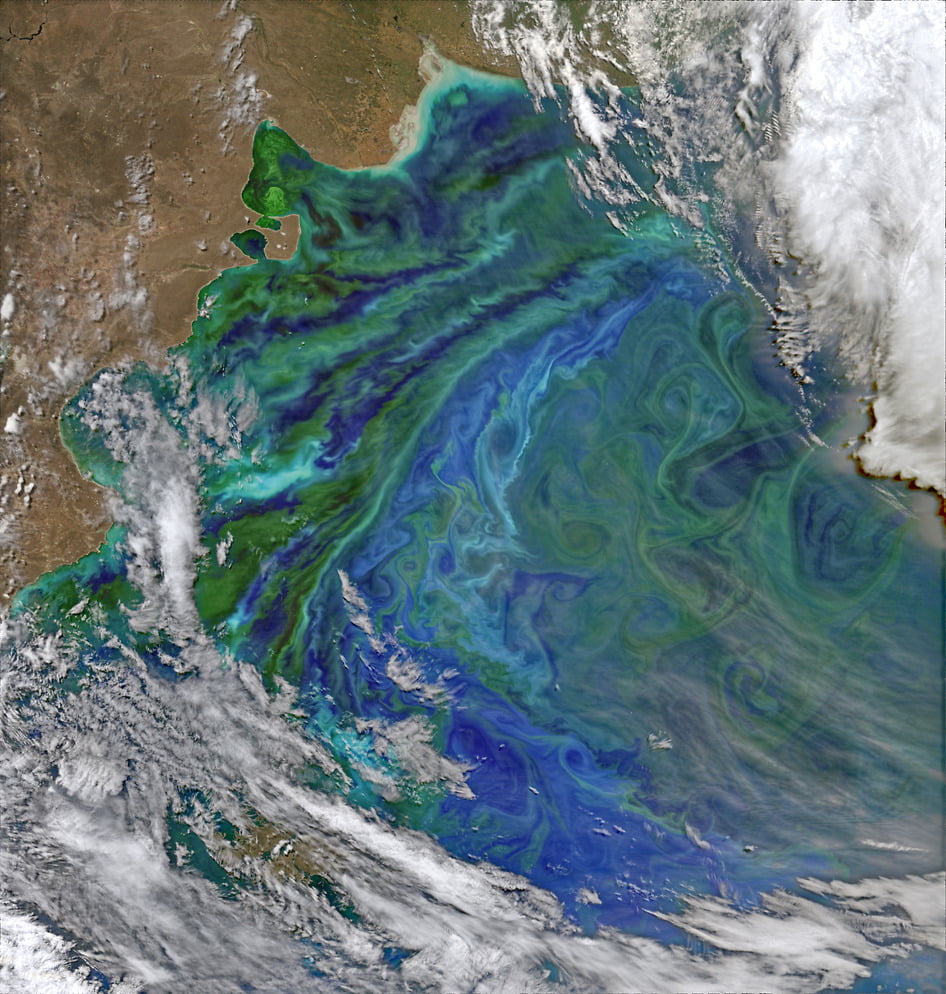
Nutrient-rich waters off Patagonia in South America blossom with phytoplankton in this satellite image. When present in large quantities, these microscopic photosynthesizers lend a green hue to the water. They act as seed particles in the flow, highlighting the currents and flow that carry them. If you check out the full resolution version of the photo, you can admire the rich detail in the whorls of ocean mixing. There even seem to be Kelvin-Helmholtz-like instabilities creating trains of vortices along the interface between separate bands. (Photo credit: NASA/ASU; via SpaceRef; submitted by jshoer)

Separating Flow
Flow separation occurs when a fluid is unable to flow smoothly around an object. In the case of the photo above, fog is being used to visualize flow around an airfoil at a large negative angle of attack. The incoming flow stagnates at a point on top of the airfoil, and streamlines on either side of that point split to move around the airfoil. Those on top are accelerated to high velocity, generating smooth, low-pressure flow over the aft section of the upper surface. On the other side of the stagnation point, however, the fog is trying to flow around the curve of the leading edge but the local pressure gradient is increasing, which slows the flow. Ultimately, it separates from the airfoil, creating a large region of recirculating, turbulent flow. When this effect occurs on the upper surface of a wing at a high (positive) angle of attack, it is called stall and causes a dramatic loss in lift. (Photo credit: Wikimedia/Smart Blade GmbH)

Flow Behind a Cylinder
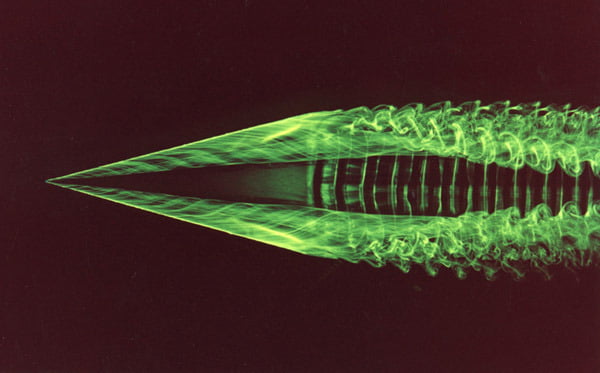
Flow over blunt bodies produces a series of alternating vortices that are shed behind an object. The image above shows the turbulent wake of a cylinder, with flow from right to left. Red and blue dyes are used to visualize the flow. This flow structure is known as a von Karman vortex street, named for aerodynamicist Theodore von Karman. The meander of the wake is caused by the shed vortices, each of which has a rotational sense opposite its predecessor. The rapid mixing of the two dyes is a result of the flow’s turbulence. In low Reynolds number laminar cases of this flow the structure of individual vortices is more visible. Similar flow structures are seen behind islands and in the wakes of flapping objects. (Photo credit: K. Manhart et al.)

Oil Flow Viz
Fluorescent oil sprayed onto a model in the NASA Langley 14 by 22-Foot Subsonic Wind Tunnel glows under ultraviolet light. Airflow over the model pulls the initially even coat of oil into patterns dependent on the air’s path. The air accelerates around the curved leading edge of the model, curling up into a strong lifting vortex similar to that seen on a delta wing. At the joint where the wings separate from the body those lifting vortices appear to form strong recirculation zones, as evidenced by the spiral patterns in the oil. Dark patches, like those downstream of the engines could be caused by an uneven application of oil or by areas of turbulent flow, which has larger shear stress at the wall than laminar flow and thus applies more force to move the oil away. Be sure to check out NASA’s page for high-resolution versions of the photo. (Photo credit: NASA Langley/Preston Martin; via PopSci)
Flow Over a Delta Wing
Fluorescent dye illuminated by laser light shows the formation and structure of vortices on a delta wing. A vortex rolls up along each leading edge, helping to generate lift on the triangular wing. As the vortices leave the wing, their structure becomes even more complicated, full of lacy wisps of vorticity that interact. Note how, by the right side of the photo, the vortices are beginning to draw closer together. This is an early part of the large-wavelength Crow instability. Much further downstream, the two vortices will reconnect and break down into a series of large rings. (Photo credit: G. Miller and C. Williamson)

Reader Question: Does Flow Viz Alter Flow?
")
")
")
")
 and schlieren photograph (right) of a droplet impact (from A. Wilkens et al.)") gorbax asks:
gorbax asks: I’ve been wondering for a while, actually, how do we know when the method of flow visualization doesn’t actually alter the flow of a fluid itself?
This is a great question and one that fluid dynamicists have to deal with all the time. Ideally, we’d love to measure everything we want from a flow at all points at all times without doing anything to affect it. In reality, however, that just doesn’t happen. Some measurement techniques are less intrusive than others, but just about everything risks having some effect. This raises two questions: 1) How small can we make that effect? and 2) Do we even care if we’re affecting the flow?
With regards to the first, the onus is typically on the experimentalist to show that whatever visualization technique he/she uses is not significantly affecting the flow. For something like particle image velocimetry, which requires seeding the flow with particles, this means selecting particles that follow the flow rather than changing it and considering carefully how and where to seed the flow such that any added vorticity from the injection does not alter the flow significantly. Checking for this can be done many ways, for example with comparisons to other measurement techniques (with and without seeding) or by comparing to simulation.
The second question–do we care?–is also a significant consideration. Because the purpose of flow visualization is often to get a qualitative feel for the flow field rather than quantitative information, it is often not a significant concern if there is some slight effect from the visualization technique. This can often be the case with smoke-wire and dye visualizations where we just want to see what’s going on.
Finally, there are some instances of flow visualization which are completely unobtrusive to the flow. Schlieren photography and infrared thermography are two examples. Both are optical techniques that act from a distance and take advantage of extant flow properties to make certain features visible. The real key is knowing what technique(s) will work for the flow you have and will give you the information you want. After that, it’s all about proper and thorough execution. (Photo credits: N. Vandenberge et al., T. Omer, M. Canals, P. Danehy et al., A. Wilkens et al., W. Saric et al.)

Visualization Via Temperature
One downside to many flow visualization techniques, like those using dye, smoke, or particles, is the difficulty of dealing with their aftermath. You can only introduce so much of them into a wind or water tunnel before it’s necessary to shutdown and clean everything. One alternative is to use temperature, as shown in the video above. By simply introducing a warmer fluid and using an IR camera, it’s possible to accomplish many of the same effects without the mess. (Video credit: A. Khandekar and J. Jacob; submitted by J. Jacob)

Visualizing F-18 Flow
Flow visualization techniques are helpful outside of wind and water tunnels, too. The photo above comes from the F-18 High Alpha Research Vehicle (HARV) program in which techniques like smoke and dye visualization were used in-flight to visualize airflow around an F-18 at large angles of attack. During flight a glycol-based liquid dye was released from tiny holes along the plane’s forebody, creating the pattern seen here later on the ground. This particular test corresponded to about 26 degrees angle of attack. (Photo credit: NASA Dryden)
Effects of Hills on Flow
Hills and other topology can have interesting and complex effects on a flowfield. With the FAITH experiment, NASA has been investigating an axisymmetric model hill using a combination of experimental methods. The video above shows flow visualization over the hill in a water channel using dye injection both upstream and downstream of the model. They’ve also done wind tunnel tests with oil-flow visualization, particle-image velocimetry, pressure sensitive paint and other measurement techniques. There are nice photos of some of these by Rob Bulmahn. By combining qualitative and quantitative flow measurement techniques, the researchers are able to capture many different aspects of the flow, which can then be shared and compared with other groups’ works. (Video credit: NASA Ames Research Center)
")