
Fluid flow near a surface–inside the boundary layer–can often be unstable. This image shows one possible instability, formed when a cylinder is rotated back and forth about its longitudinal axis. This oscillation and the curvature of the cylinder destabilize flow in the boundary layer, forming vortices that line the cylinder. This particular behavior is called a Görtler instability. To visualize it, threads soaked in fluorescing dye have been embedded into slits in the cylinder. The cylinder is oscillated in a water tank and ultraviolet light is used to fluoresce the dye for the image. (Photo credit: Miguel Canals/University of Hawaii)
Search results for: “flow visualization”

Supersonic Oil Flow Viz
This image shows oil-flow visualization of a cylindrical roughness element on a flat plate in supersonic flow. The flow direction is from left to right. In this technique, a thin layer of high-viscosity oil is painted over the surface and dusted with green fluorescent powder. Once the supersonic tunnel is started, the model gets injected in the flow for a few seconds, then retracted. After the run, ultraviolet lighting illuminates the fluorescent powder, allowing researchers to see how air flowed over the surface. Image (a) shows the flat plate without roughness; there is relatively little variation in the oil distribution. Image (b) includes a 1-mm high, 4-mm wide cylinder. Note bow-shaped disruption upstream of the roughness and the lines of alternating light and dark areas that wrap around the roughness and stretch downstream. These lines form where oil has been moved from one region and concentrated in another, usually due to vortices in the roughness wake. Image © shows the same behavior amplified yet further by the 4-mm high, 4-mm wide cylinder that sticks up well beyond the edge of the boundary layer. Such images, combined with other methods of flow visualization, help scientists piece together the structures that form due to surface roughness and how these affect downstream flow on vehicles like the Orion capsule during atmospheric re-entry. (Photo credit: P. Danehy et al./NASA Langley #)

Reader Question: How Useful is Flow Viz?
")

")
")
")

Reader Andrew asks:
I’ve noticed you’ve posted a bunch of flow visualization/wind tunnel content. I’m just curious where how useful information is obtained from these. Is it just observation? Or are there instruments that are usually used in conjunction with these techniques to provide data?
Great question, Andrew! The answer can vary based on the technique and application. In some cases, flow visualization is used for purely qualitative observation, but in others it can provide more quantifiable data. For example, the water tunnel flow visualization of Google’s heliostat array gave very qualitative data about flow around a given configuration but allowed quick evaluation of many configurations. Flow visualization can also help identify key features for additional study like vortices in a wake. This identification of structure can be so useful that even in computational fluid dynamics, where researchers have all possible information about pressure, temperature, and velocity in a flow field, flow visualization is regularly used to identify underlying structures.
Some flow visualization methods can also give very specific information. Oil-flow visualization gives a snapshot of shear stress at the surface of an object, letting an engineer identify at a glance areas of laminar and turbulent flow as well as regions with vortices and streaks. Naphthalene flow visualization and infrared thermography are both great for identifying the location of laminar-turbulent transition and can do so across the span of an object, which is much easier than trying to traverse a probe across the entire object. And some forms of flow visualization allow for extraction of velocity field information, as in particle image velocimetry. In this technique, tiny particles seed the flow and carefully timed image pairs are taken and correlated to determine the flow field velocity based on the changes in particle positions between images.
Like every measurement, flow visualization methods have their strengths and limitations. But for many applications, flow visualization provides much more than just pretty pictures and thus remains an important tool in any fluid dynamicist’s arsenal!

Using Flow Viz for Optimization


Flow visualization is a powerful design tool for engineers. When Google was interested in determining optimal configurations for their heliostat array, they turned to NASA Ames’ water tunnel facility to test upstream barriers to deflect flow off the heliostats. In each photo, flow is from left to right and fluorescent dye is used to mark streamlines and reveal qualitative flow detail. Upstream of the obstacles, the streamlines are coherent and laminar, but after deflection, the flow breaks down into turbulence. In this case, such turbulence is desirable because it lowers the local fluid velocity and thus the aerodynamic loads experienced by each heliostat, potentially allowing for a savings in fabrication. For more, see Google’s report on the project. (Photo credits: google.org)

F-18 Flow Viz
")
")
")


Water tunnels are useful tools for determining aerodynamic characteristics of aircraft, such as this F-18 model placed in the NASA Dryden Flow Visualization Facility. By matching the Reynolds number of the model in the water tunnel to that of the full-scale aircraft in air, engineers can observe flow around the aircraft inside the laboratory. This similarity of flows is a powerful design tool. Here dye introduced along the nose, wings, and fuselage traces streamlines around the F-18, revealing areas of turbulence at different flight conditions.

Micro Air Vehicle Flow Viz
A smoke wire shows the deformation of streamlines around a swept-winged micro air vehicle (MAV). These crafts typically feature wingspans smaller than one foot and, thus, never develop the type of flow fields associated with larger fixed-wing airplanes. This complicates theoretical predictions of lift and drag for MAVs as well as making them difficult to control. MAVs have numerous commercial and military applications, including search and rescue operations. (Photo credit: Tom Omer)

Flow in Urban Areas
While we typically think about boundary layers as a small region near the surface of an object–be it airplane, golf ball, or engine wall–boundary layers can be enormous, like the planetary boundary layer, the part of the atmosphere directly affected by the earth’s surface. Shown above is a flow visualization of the boundary layer in an urban area; note the models of buildings. In these atmospheric boundary layers, buildings, trees, and even mountains act like a random rough surface over which the air moves. This roughness drives the fluid to turbulent motion, clear here from the unsteadiness and intermittency of the boundary layer as well as the large variation in scale between the largest and smallest eddies and whorls. In the atmosphere, the difference in scale between the largest and smallest eddies can vary more than five orders of magnitude.
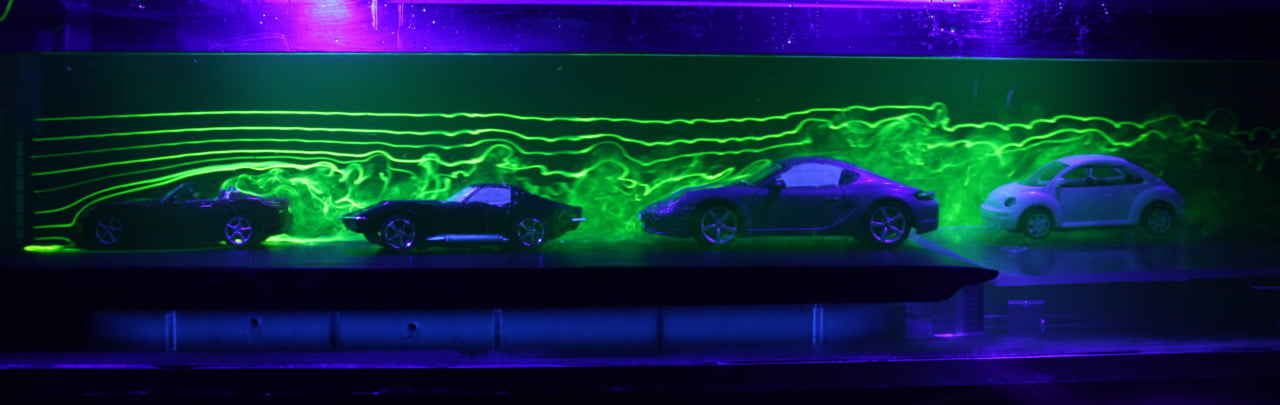
Flow Around Traffic
Flow visualization in a water tunnel shows what the flow around a line of traffic looks like. Note the progressively more turbulent flow around each car as it sits in the wake of the car before it. Turbulent flow is usually associated with increased drag forces, but because turbulence can actually help prevent flow separation it is sometimes desirable as a method for decreasing drag. In the case of these cars drafting on one another, it is clear that the cars further back in the line cause less effect on the fluid–and thus have less drag to overcome–than the front car. (Photo credit: Rob Bulmahn)
Smoke Flow Viz
Smoke visualization, illuminated by a laser sheet, shows a 2D slice from an axisymmetric jet as it breaks down to turbulence. The flow is laminar upon exiting the nozzle, but the high velocity at the edge of the jet and low velocity of the surrounding air causes shear that leads to the Kelvin-Helmholtz instability. This instability leads to the formation of small vortices that grow as they are advected downstream until they are large enough to interrupt the jet and it breaks down into fully turbulent flow. (Video credit: B. O. Anderson and J. H. Jensen)
Flow Over Swept Wings
Flow over a swept wing behaves very differently than a straight fixed wing or an airfoil. Instead of flowing straight along the chord of the wing in a two-dimensional fashion, air is also directed along the wing, parallel to the leading edge. The above oil flow visualization on a swept wing airplane model shows this curvature of streamlines. As a result of this three-dimensional flow behavior, boundary layers on swept wings are subject to the crossflow instability, which manifests as co-rotating vortices aligned to within a few degrees of the streamlines. Triggering this boundary layer instability can lead to turbulence and higher drag for the aircraft.