
This photograph uses fluorescent dye to visualize the wake behind a rigid flat plate pitching about its leading edge. A vortex is shed from the plate twice in each cycle of oscillation. These vortices entangle, producing the structured wake above. The top photo shows a side view of the wake, the bottom photo is a top view. (Photo credit: J. Buchholz and A. Smits)
Search results for: “flow visualization”

Smoke-Wire Visualization


One common simple form of flow visualization is the smoke-wire technique. A thin wire is coated in oil, then heated. The resulting smoke flows over and around the object of study, providing a useful tracer for the flow. While not necessarily helpful as a quantitative measure, smoke-flow visualization helps researchers get a sense of what is going on in the flow. (Photo credits: TAMU Hypersonics Lab)

Jellyfish Flow
Florescent dye reveals the flow pattern of ocean water around a swimming jellyfish. Some researchers posit that fluid drift associated with the swimming of marine animals may be as substantial a factor in ocean mixing as turbulence caused by the wind and tides. If true, modeling of climate change–past, present, and future–would need to take into account the biology of the ocean as well! #
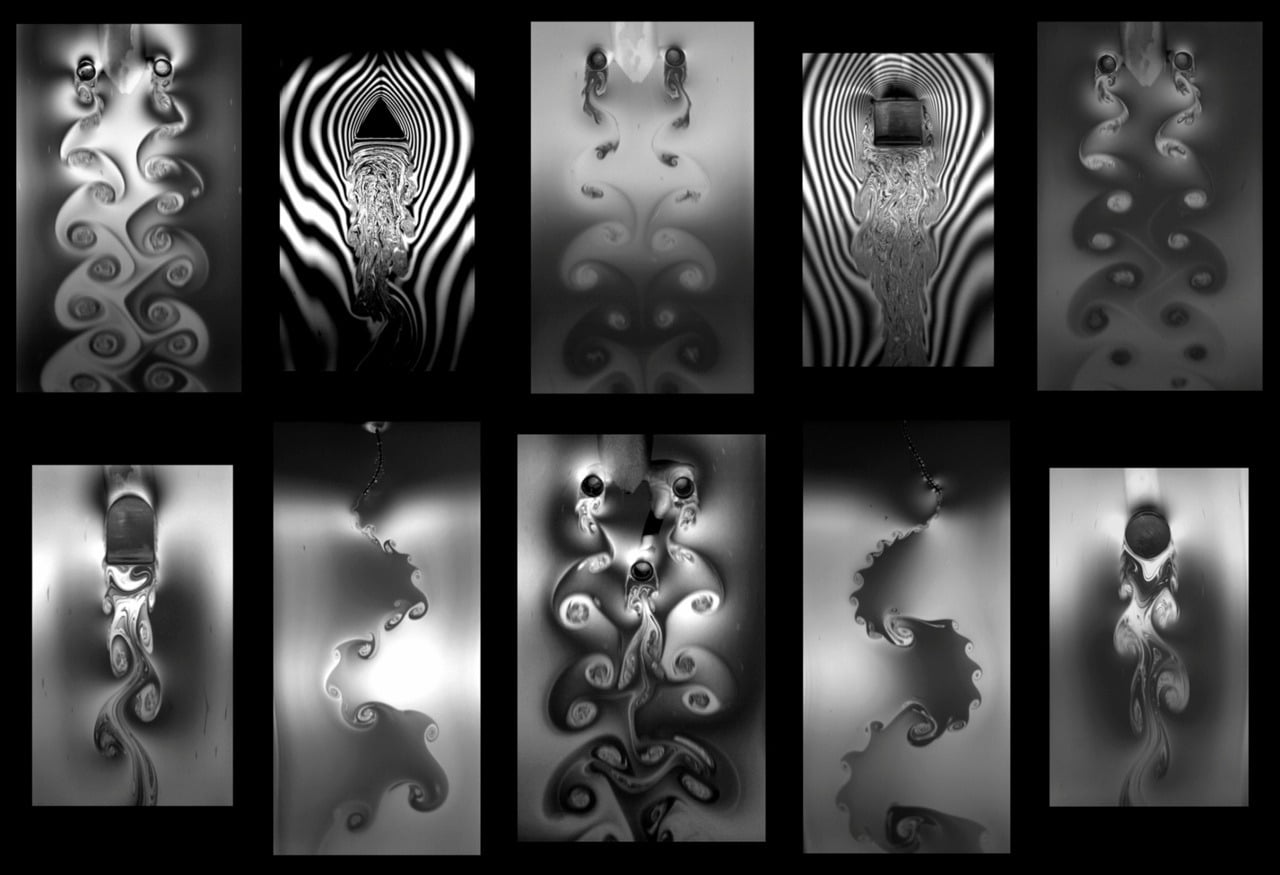
Soap Film Flow Viz
Flowing soap films provide an educational and beautiful method for visualizing the wakes of objects in two-dimensional flows. High-speed photography highlights the interference patterns on the soap film, providing detail without the necessity for the particulate tracking of other flow visualization methods. Highlights here include wakes behind bluff bodies, interacting cylinders, and flapping flags. (pdf) #

Flow Around a Delta Wing
Smoke visualization in a wind tunnel shows the vortices wrapping around and trailing behind a delta wing. As with more commonly seen rectangular or swept wings, the vortices that form around delta wings affect lift, drag, and control of an aircraft. They can also be hazardous to aircraft nearby. Note that, although delta wings are often seen on supersonic aircraft, this visualization only applies at subsonic speeds. The flow field changes drastically above the speed of sound.

Shuttlecock Flow Viz
The flow around a shuttlecock is visualized in a water channel using fluorescent dye illuminated by laser light ultraviolet LEDs. Note the recirculation zone on the upper shoulder. Experimenters can match flow characteristics in water to that in air by matching the Reynolds numbers. (Photo credit: Rob Bulmahn)
Updated, thanks to information from the photographer. Thanks!

Flow Viz of a Locust
Smoke visualization in a wind tunnel reveals the airflow over a flying locust. Researchers are unraveling the aerodynamics of insect flight in order to produce better Micro Air Vehicles (MAVs) and miniature flying robots. #
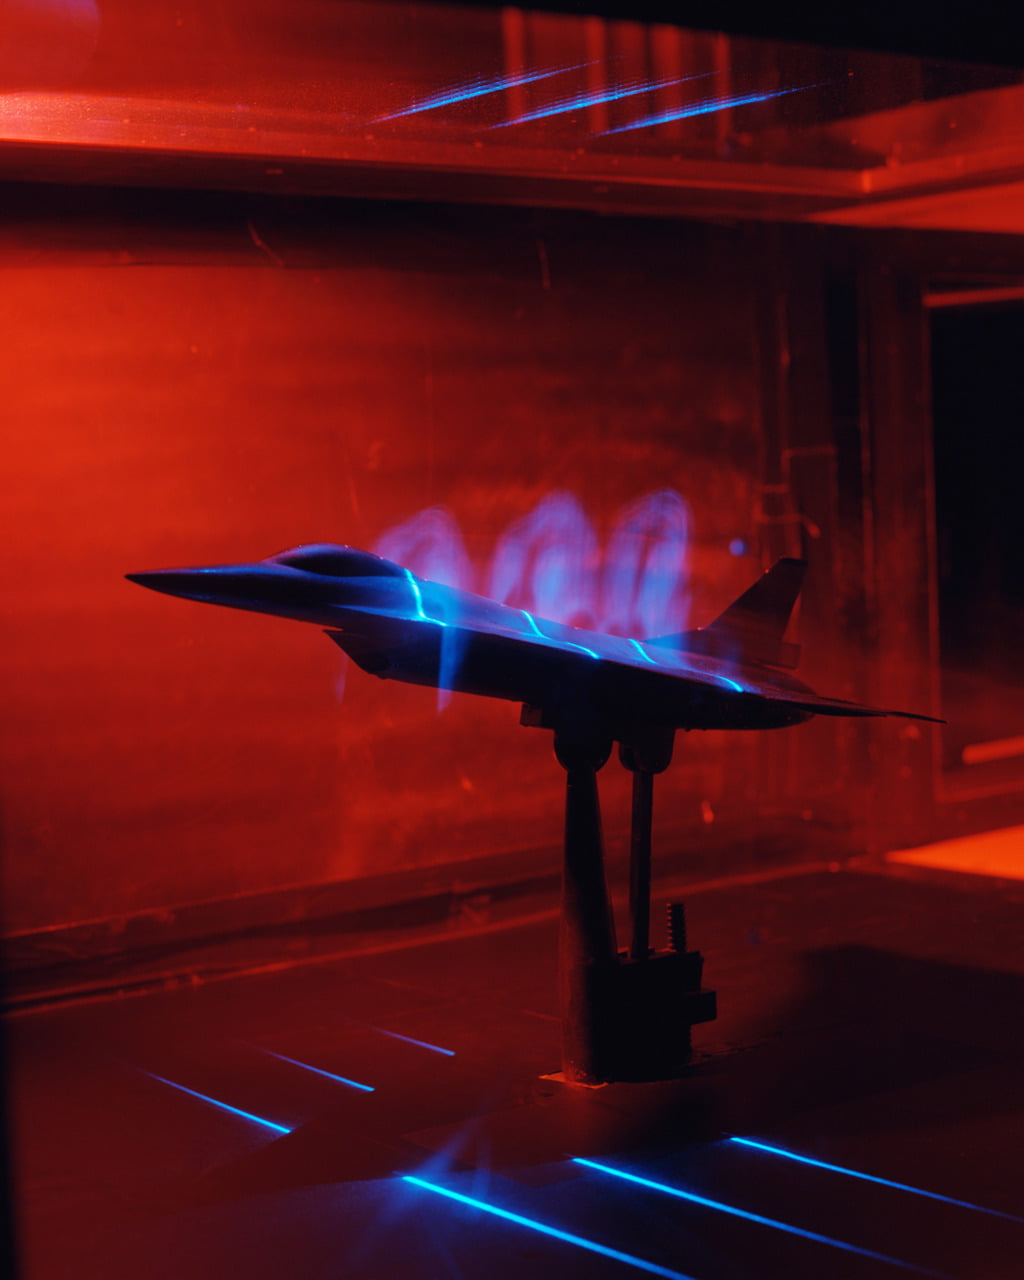
Smoke Visualization on an F-16
Flow around an F-16XL Scamp model is visualized using smoke illuminated by laser sheets. Lasers are common equipment in fluids laboratories; they’re useful for flow visualization and for many velocimetry techniques.
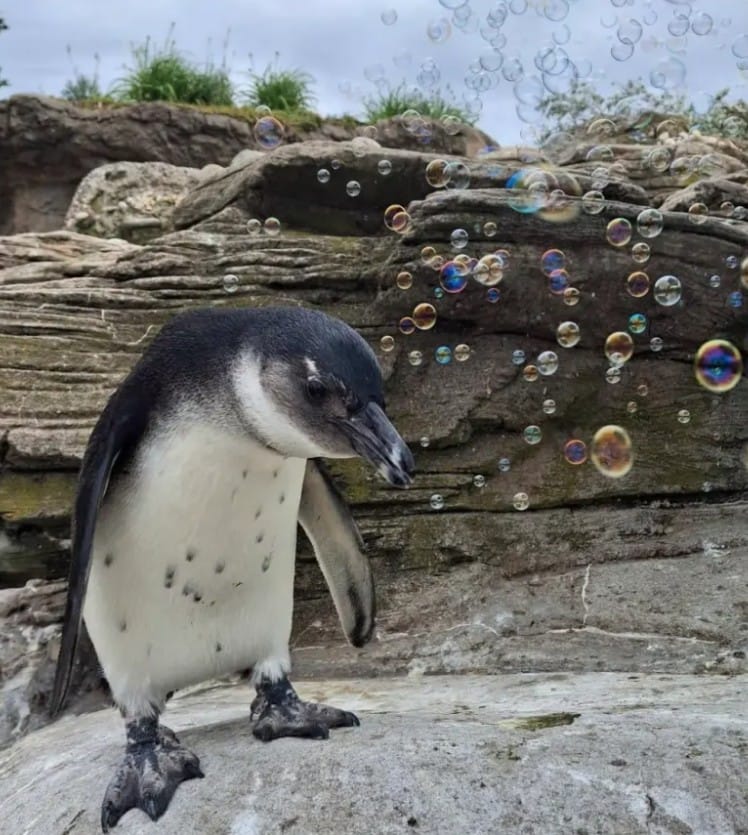
Even Penguins Love Bubbles
Walter, a young African penguin at the New York Aquarium, loves soap bubbles. In fairness to Walter, so do most people I’ve met. There’s just something that feels a bit magical about these ephemeral rainbow spheres that pop at a (dry) touch.
Bubbles owe their colors to thin film interference–the colors actually indicate how thick the bubble film is–and their stability (and fast disintegration) to surface tension. With schlieren photography or flow visualization, watching bubbles gets even cooler. Do you suppose a penguin would appreciate bubbles popping at 50,000 fps? (Image credit: New York Aquarium; via PopSci)
Fediverse Reactions
-
Liquid Pulleys and Gears
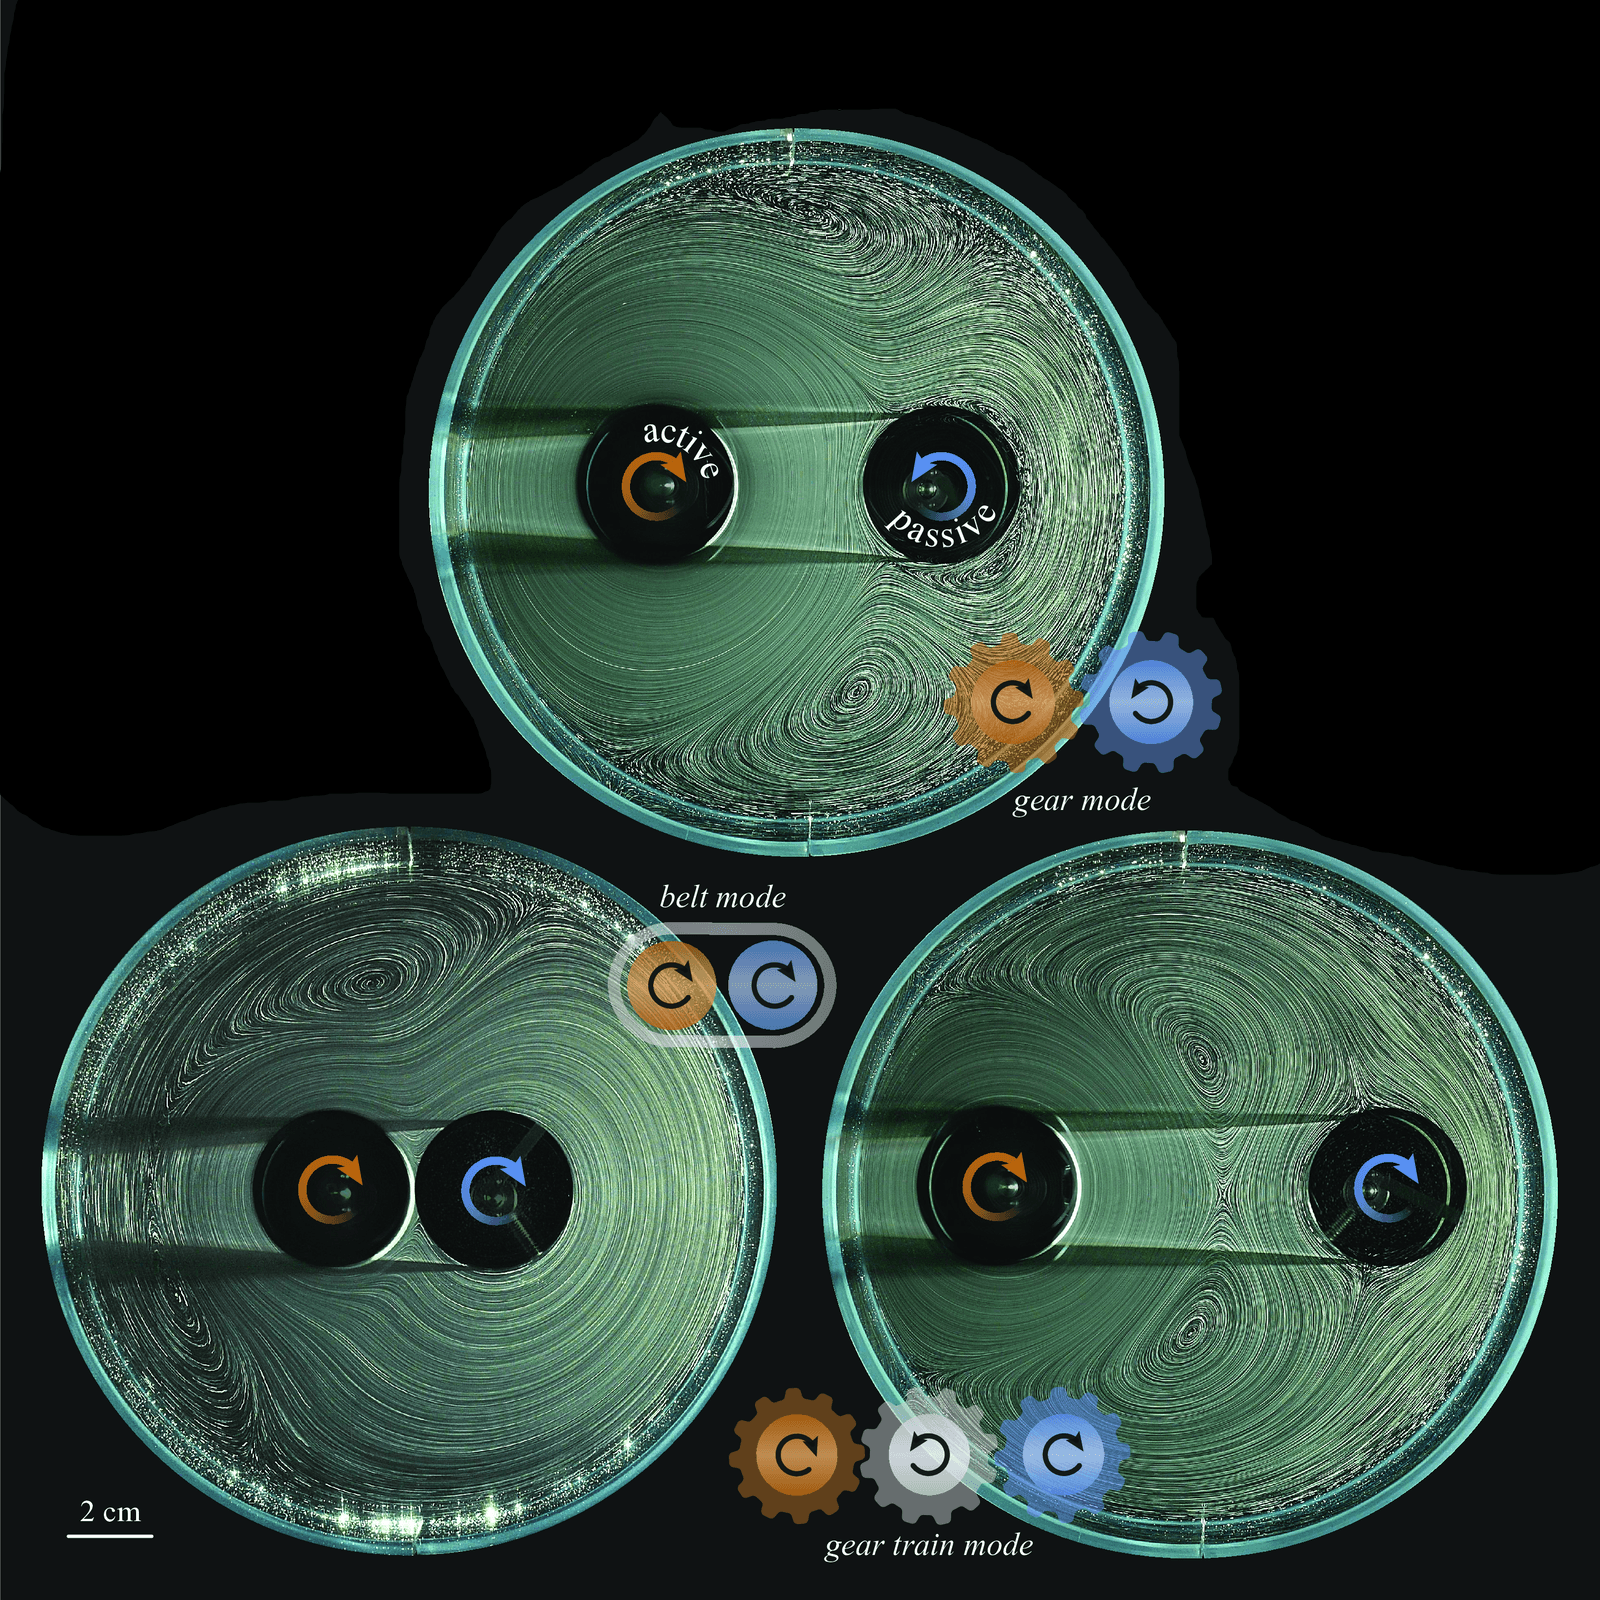
In mechanical systems, gears and pulleys transmit rotation from one location to another. Here, researchers explore a fluid dynamical version of such systems. The set-up consists of two rotors contained in a cylindrical corral filled with a water-glycerin mixture. One of the rotors is active, marked here with orange; the other (blue) one is passive, meaning that it can rotate due to the forces on it but it is not actively driven by a motor.
The three flow visualizations illustrate different configurations the rotors can take on, depending on their separation distance. In the top image, the rotors have a moderate separation distance and the passive one rotates opposite of the active one. That rotation direction is set by the high-shear flow on its inner side. If the rotors are close together (left image), they rotate in the same direction, aided by strong shear on the outside edge of the passive rotor; this mimics being linked with a belt. And, finally, if the rotors are widely separated, they also corotate, with the fluid in between acting like a virtual gear linking them. (Image credit: J. Smith et al.)
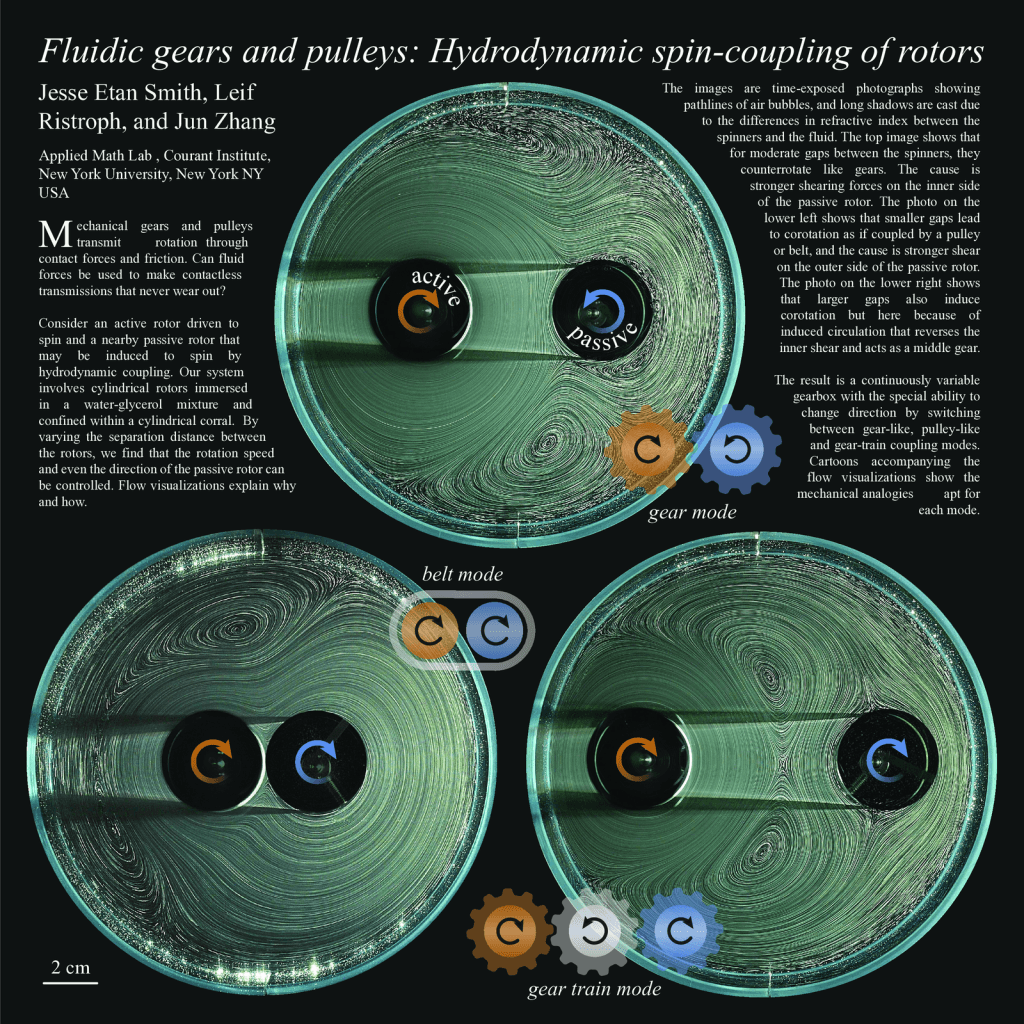
Research poster showing how an active and a passive rotor can be paired through hydrodynamic interactions. Fediverse Reactions
-