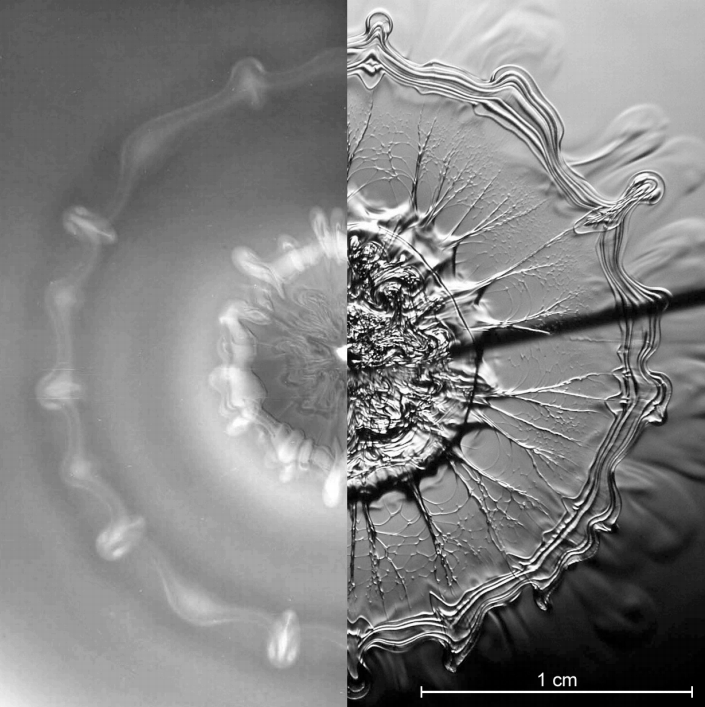
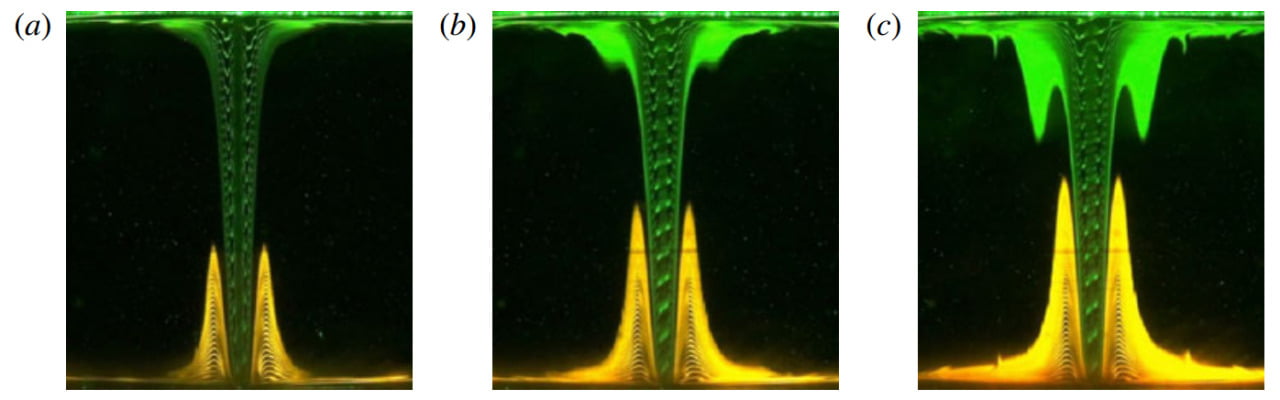
Search results for: “flow visualization”

  • Featured Video Play Icon

    Ski Jumping Aerodynamics

    Last summer we featured fluid dynamics in the Summer Olympics and there’s more to come for Sochi. Winter athletes like ski jumper Sarah Hendrickson are hard at work preparing, which can include time in wind tunnels, as shown here. There are two main diagnostics in tests like these: drag measurements and smoke visualization. The board Hendrickson stands on is connected to the tunnel’s force balance, which allows engineers to measure the differences in drag on her as she adjusts equipment and positions. This gives a macroscopic measure of drag reduction, and reduced drag makes the skier faster on the snow and lets her fly longer in the jump. The smoke wand provides a way to visualize local flow conditions to ensure flow remains attached around the athlete, which also reduces drag.  (Video credit: Red Bull/Outside Magazine; submitted by @YvesDubief)

  • Vortex Street in the Clouds

    Vortex Street in the Clouds

    Most objects are not particularly aerodynamic or streamlined. When air flows over such bluff bodies, they can shed regular vortices from one side and then the other. This periodic shedding creates a von Karman vortex street, like this one stretching out from Isla Socorro off western Mexico. From the wind’s perspective, the volcanic island forms a blunt disruption to the otherwise smooth ocean. This vortex shedding is seen at smaller scales, as well, in the wind tunnel, in soap films, and in water tunnels. If you’ve ever been outside on a windy day and heard the electrical lines “singing” in the wind, that’s the same phenomena, too. With the right crosswind, radial bicycle spokes will buzz for the same reason as well!  (Photo credit: MODIS/NASA Earth Observatory)

  • Meeting the Wall

    Meeting the Wall

    Even something as simple as a falling sphere meeting a wall is composed of beautiful fluid motion. In Figure 1 above, we see side-view images of a sphere at low Reynolds number falling toward a wall over several time. Initially an axisymmetric vortex ring is visible in the sphere’s wake; when the sphere touches the wall, secondary vortices form and the wake vortex moves down and out along the wall in an axisymmetric fashion (Figure 2, top view). At higher Reynolds numbers, like those in Figure 3, this axisymmetric spreading of the vortex ring develops an instability and ultimately breaks down. (Photo credit: T. Leweke et al.)

  • Featured Video Play Icon

    Flapping Foil Wake

    This gorgeous visualization shows the flow behind a flapping foil. Flow in the water tunnel is from right to left, with dye introduced to show streamlines. A flapping foil is a good base model for most flapping flight as well as finned swimming – anything that oscillates to create thrust. As the foil flaps, vorticity is generated and shed along the trailing edge, creating a regularly patterned wake of trailing vortices. (Video credit: R. Godoy-Diana)

  • Droplet Impact Visualized

    Droplet Impact Visualized

    When a drop falls from a moderate height into a shallow pool, its impact creates a complicated pattern. The photo above is a composite image showing a top-down view 100 ms after such an impact. On the left side, the flow is visualized using dye whereas the right shows a schlieren photograph, in which contrast indicates variations in density. Both methods show the same general structure – an inner vortex ring generated at the edge of the impact crater and formed mostly of drop fluid and an outer vortex ring, consisting primarily of pool fluid, formed by the spreading wave. Both regions show signs of instability and breakdown. (Photo credit: A. Wilkens et al.)

  • Featured Video Play Icon

    Watching the Boundary Layer Go By

    In experiments, it can be difficult to track individual fluid structures as they flow downstream. Here researchers capture this spatial development by towing a 5-meter flat plate past a stationary camera while visualizing the boundary layer – the area close to the plate. The result is that we see turbulent eddies evolving as they advect downstream. Despite the complicated and seemingly chaotic flow field, the eye is able to pick out patterns and structure, like the merging of vortices that lifts eddies up into turbulent bulges and the entrainment of freestream fluid into the boundary layer as the eddies turn over or collapse. It is also a great demonstration of how the Reynolds number relates to the separation of scales in a turbulent flow. Notice how much richer the variety of length-scale is for the higher Reynolds number case and how thoroughly this mixes the boundary layer. (Video credit: J. H. Lee et al.)

  • Lift on a Paper Plane

    Lift on a Paper Plane

    In this still image from a student experiment, smoke visualization shows the formation of a vortex over the wing of a paper airplane during a wind tunnel test. This wing vortex is mirrored on the opposite wing, though there is no smoke to show it. At high angle of attack, the delta-wing shape of the traditional paper air plane creates these vortices on the upper surface, which helps generate the lift necessary to keep the plane aloft. (Photo credit: A. Lindholdt, R. Frausing, C. Rechter, and S. Rytman)

  • Shock Waves in Flight

    Shock Waves in Flight

    Schlieren photography allows visualization of density gradients, such as the sharp ones created by shock waves off this T-38 aircraft flying at Mach 1.1 around 13,000 ft. Although shock waves are relatively weak at this low supersonic Mach number, they persist, as seen in the image, at significant distances from the craft. The sonic boom associated with the passage of such a vehicle overhead is due to the pressure change across a shock wave. The higher the altitude of the supersonic craft, the less intense its shock wave, and thus sonic boom, will be by the time it reaches ground level. (Photo credit: NASA)

  • Humpback-Inspired Turbine Blades

    Humpback-Inspired Turbine Blades

    The bumps–or tubercles–on the edge of a humpback whale’s fins have important hydrodynamic effects on its swimming. Here dye is used to visualize flow over a hydrofoil with tubercle-like protuberances–a sort of artificial whale fin. Dye released from the peaks and troughs of the protuberances flows straight back in a narrow line before breakdown to turbulence. But the dye released from ports on the shoulders of the protuberances twists and spirals into vortices. At angle of attack, these vortices are stronger. They may help keep flow from separating on the upper side of a whale’s fin. (Photo credits: SIDwilliams, H. Johari)

  • Featured Video Play Icon

    Spin-Up

    With the Oscars just over, it seems like a good time for some movie-trailer-style fluid dynamics. This video shows a rotating water tank from the perspective of a camera rotating with the tank at 10 rpm. Initially, the tank and its contents are at rest. When the tank begins spinning, the fluid inside responds. Pink potassium permanganate crystals at the bottom of the tank show fluid motion as they dissolve, and food coloring is spread on the water’s surface to show motion there. Fluid near the edge of the tank reaches the tank’s rotational velocity fastest, due to friction with the wall, while fluid near the center of the tank takes longer to spin up to speed. This creates the spiral-galaxy-like shape in the dye. Eventually viscosity will transmit the effects of the wall’s motion even into the center of the tank. (Video credit: UCLA Spinlab)