As demonstrated in the video above, lasers can be used to excite molecules into a higher energy state, which will decay via the emission of photons, causing the medium to glow. This laser-induced fluorescence is utilized in several techniques for measurements in fluid dynamics, including planar laser-induced fluorescence (PLIF) and molecular tagging velocimetry (MTV). In these techniques a flow is usually seeded with a fluorescing material–nitric oxide is popular for super- and hypersonic flows–and then lasers are used to excite a slice of the flow field. The resulting fluorescence can be used for both qualitative and quantitative flow measurements. Here are a couple of examples, one in low-Reynolds number flow and one in combustion. (Video credit: L. Martin et al./UC Berkeley)
Search results for: “flow visualization”

Airborne Aerosols
This numerical simulation from NASA Goddard shows the motion of particulates in Earth’s atmosphere between August 2006 and April 2007. These aerosols come from various sources including smoke, soot, dust, and sea salt. As these fine particles move through atmosphere, they can have significant effects on weather as well as climate. For example, the particles serve as nucleation sites for the condensation and formation of rain drops. (Video credit: NASA Goddard SFC)

Stirring Faces
This video features simulation of the laminar flow around a plate plunging sinusoidally in a quiescent flow. As the plate moves up and down, it mixes the fluid around it. This is visualized in several ways, beginning with the vorticity. Clockwise and anti-clockwise vortices are shed by the edges of the plate as it moves. The flow is also visualized using particle trajectories, which are classified by their tendency to accumulate (attract) or lose (repel) particles. These trajectories are particularly intriguing to watch develop as they appear to show ornate faces and designs. (Video credit: S. L. Brunton and C. W. Rowley)

Supersonic Bubble Shock Waves
Supercomputing has been an enormous boon to fluid dynamics over the past few decades. Many problems, like the interaction between a supersonic shock wave and a bubble, are too complicated for analytical solutions and difficult to measure experimentally. Numerical simulation of the problem, combined with visualization of key variables, adds invaluable understanding. Here a shock wave strikes a helium bubble at Mach 3, and the subsequent interactions in terms of density and vorticity are shown. This situation is relevant to a number of applications, such as supersonic combustion and shockwave lithotripsy–a medical technique in which kidney stones are broken up inside the body using shock waves. After impact, an air jet forms and penetrates the center of the structure while the outer regions mix and form a persistent vortex ring. (Video credit: B. Hejazialhosseini et al.; via Physics Buzz)

Reader Question: Dry Rear Windshields in the Rain
Reader sheepnamedpig asks:
I was driving through the rain down the highway when I noticed something strange: though the rain was heavy enough to reduce visibility to a quarter mile, the rear windshield of my Corolla was bone dry except for the streams of water flowing off the roof. There was no wind so far as I could tell, but I had to slow down all the way to ~20-25 mph for rain to start falling on the rear windshield. Why is that?
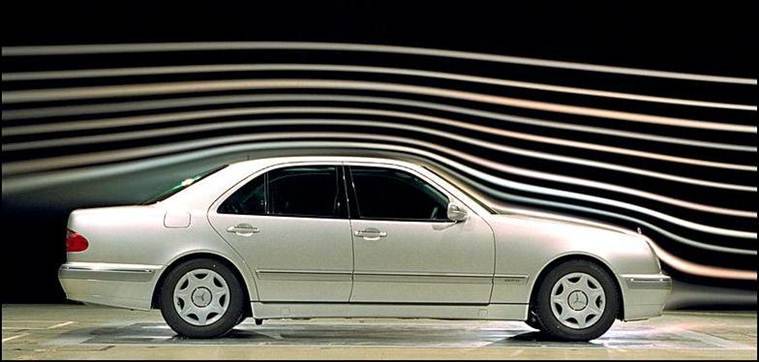
That’s a wonderful observation! Like many sedans, your Corolla has a long, sloped rear window that acts much like a backward-facing step with respect to the airflow while the car is moving. Note the smoke lines in the photo above. At the front of the car, we see closely spaced intact lines near the hood and windshield, indicating relatively fast, smooth airflow over the front of the vehicle. At the back, though, there is a big gap over the rear windshield. This is because flow over the car has separated at the rear windshield and a pocket of recirculating air. This recirculation zone is, for the most part, isolated from the rest of the air moving over the car; that’s why the smoke lines continue relatively unaffected a little ways above the surface. This same pocket of recirculating air is protecting your rear windshield from rainfall. It’s an area of low-speed, high-pressure fluid, and the raindrops are preferentially carried by the high-speed, low-pressure air over the recirculation zone. This is one reason why many sedans don’t have rear windshield wipers. (Photo credit: F-BDA)
ETA: Reposted by request to make it rebloggable.

Superfluid Vortices
Cooling helium to a few degrees Kelvin above absolute zero produces superfluid helium, a substance with some very bizarre behaviors caused by a lack of viscosity. Superfluids exhibit quantum mechanical properties on a macroscopic scale; for example, when rotated, a superfluid’s vorticity is quantized into distinct vortex lines, known as quantum vortices. These vortices can be visualized in a superfluid by introducing solid tracer particles, which congregate inside the vortex line, making it appear as a dotted line, as shown in the video above. When these vortex lines approach one another, they can break and reconnect into new vortices. These reconnections provoke helical Kelvin waves, a phenomenon that had not been directly observed until the present work by E. Fonda and colleagues. They are even able to show that the waves they observe match several proposed models for the behavior. (Video credit: E. Fonda et al.)

Supercomputed Fluids
Computational fluid dynamics and supercomputers can produce some stunning flow visualizations. Above are examples of turbulence, the Rayleigh-Taylor instability, and the Kelvin-Helmholtz instability. Be sure to check out LCSE’s website for more; they’ve included wallpapers of some of the most spectacular ones. (Photo credits: Laboratory for Computational Science and Engineering, University of Minnesota, #)

The Backward-Facing Step
This photo collage shows vortices shed off a backward-facing step. The flow is left to right. Here the flow is visualized using dye released in water. Initially, the vortex forms near the bottom of the step in the recirculation zone. Because flow over the top of the vortex is much faster than the flow beneath the vortex, a low pressure zone forms over the vortex and gradually draws it up toward the top of the step. Eventually the vortex will rise to the point where the upstream flow pushes it downstream and the process begins anew. (Photo credit: Andrew Carter, University of Colorado)

Mussels
In this video, schlieren imaging is used to make visible the flow field around a mussel. Mussels are filter-feeders, drawing nearby water in to obtain their food and expelling the unneeded fluid once they’ve gathered the plankton they eat. Normally this process is invisible to the naked eye, but schlieren imaging reveals changes in density (and thus refractive index) that make it possible to visualize the outflow from the mussel. The technique is also commonly used in supersonic flows to reveal shock waves. (Video credit: Stephen Allen)

Sunset Vortices
Wingtip vortices roll up in the wake of this U.S. Coast Guard C-130J. At the edge of a wing high-pressure, low velocity air is able to creep around the edge of the wingtip toward the low-pressure, high-velocity air atop the wing. This creates a swirling vortex that trails behind each wing, made visible here by the clouds entrained in the plane’s wake. Over time, these counter-rotating vortices will sink downward and break up due to viscosity and instabilities induced by their proximity. (via Aviationist)


