When a fluid is stratified into layers, it’s possible to have waves generated and transmitted along the interface between layers. Because these waves remain inside the bulk fluid, they are called internal waves. They often occur in the atmosphere or the ocean as fluids with different properties move past changing terrain. The Strait of Gibraltar is an excellent source of internal waves. The tidal exchange of waters between the Mediterranean Sea and Atlantic Ocean takes place through a narrow corridor interrupted by the peak of Camarinal Sill. The internal waves generated by the constriction are large enough that their effect on the surface flow is visible to satellites. The video above visualizations data from a numerical simulation of flow through the Strait, showing the obstacles, flow, and wave structures generated. (Video credit: J.C. Sanchez Garrido et al.)
Search results for: “flow visualization”

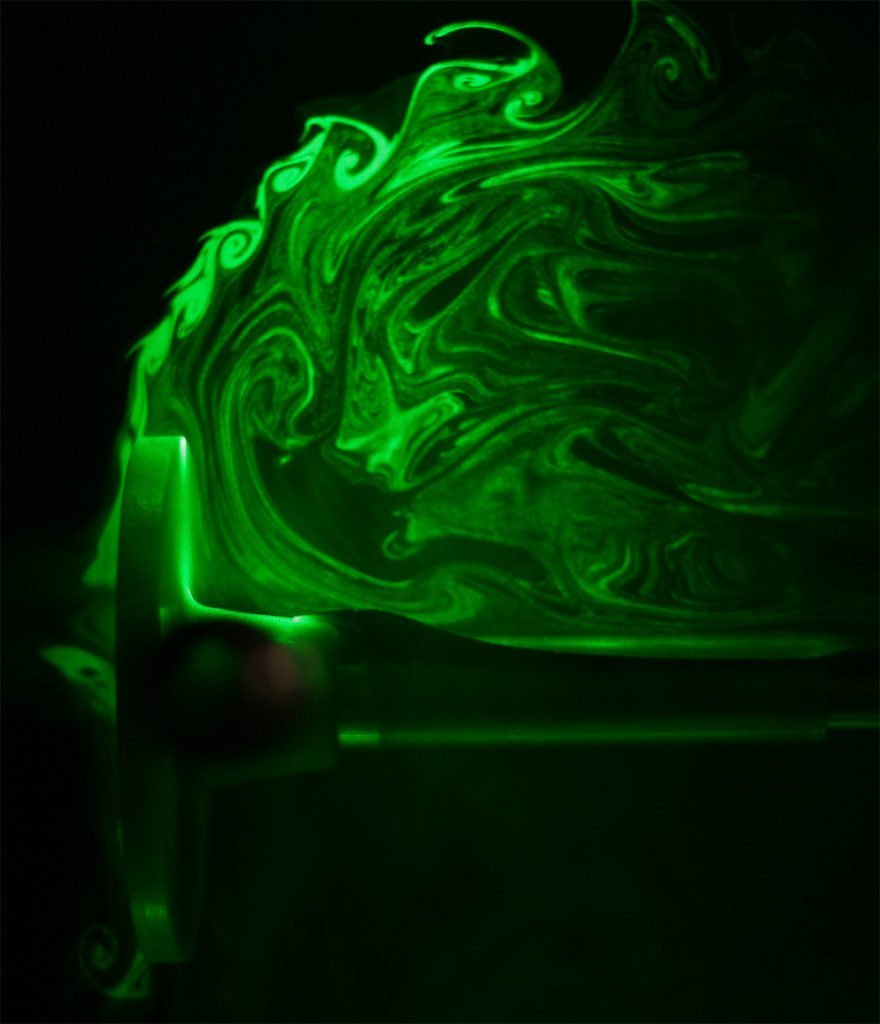
Tip Vortex
Smoke released from the end of a test blade shows the helical pattern of a tip vortex from a horizontal-axis wind turbine. Like airplane wings, wind turbine blades generate a vortex in their wake, and the vortices from each blade can interact downstream as seen in this video. These intricate wakes complicate wind turbine placement for wind farms. A turbine located downstream of one of its fellows not only has a decreased power output but also has higher fatigue loads than the upstream neighbor. In other words, the downstream turbine produces less power and will wear out sooner. Researchers visualize, measure, and simulate turbine wakes and their interactions to find ways of maximizing the wind power generated. (Photo credit: National Renewable Energy Laboratory)

Stirring Up
When a viscoelastic non-Newtonian fluid is stirred, it climbs up the stirring rod. This behavior is known as the Weissenberg effect and results from the polymers in the fluid getting tangled and bunched due to the stirring. You may have noticed this effect in the kitchen when beating egg whites. In this video, researchers explore the effect using rodless stirring. The first example in the video shows a viscous Newtonian fluid being stirred. The stirring action creates a concave shape in the glycerin-air interface, and dye injection shows a toroidal vortex formed over the stirrer. Fluid near the center of the vortex is pulled downward and circulates out to the sides. In contrast, the viscoelastic fluid bulges outward when stirred. Dye visualization reveals fluid being pulled up the center into the bulge. It then travels outward, forming a mushroom-cap-like shape before sinking down the outside. This is also a toroidal vortex, but it rotates opposite the direction of the Newtonian one. Exactly how the polymers create this change in flow behavior is a matter of active research. (Video credit: E. Soto et al.)

Growing Turbulence
Flow patterns can change dramatically as fluid speed and Reynolds number increase. These visualizations show flow moving from left to right around a circular plunger. The lower Reynolds number flow is on the left, with a large, well-formed, singular vortex spinning off the plunger’s shoulder. The image on the right is from a higher Reynolds number and higher freestream speed. Now the instantaneous flow field is more complicated, with a string of small vortices extending from the plunger and a larger and messier area of recirculation behind the plunger. In general, increasing the Reynolds number of a flow makes it more turbulent, generating a larger range of length scales in the flow and increasing its complexity. (Image credit: S. O’Halloran)
What Sound Looks Like
NPR’s Skunk Bear Tumblr has a great new video on the schlieren visualization technique. The schlieren optical set-up is relatively simple but very powerful, as shown in the video. The technique is sensitive to variations in the refractive index of air; this bends light passing through the test area so that changes in fluid density appear as light and dark regions in the final image. Since air’s density changes with temperature and with compressibility, the technique gets used extensively to visualize buoyancy-driven flows and supersonic flows. Since sound waves are compression waves which change the air’s density as they travel, schlieren can capture them, too. (Video credit: A. Cole/NPR’s Skunk Bear)

Convective Impressionism


Buoyant convection, driven by temperature-dependent changes in density, is a major force here on Earth. It’s responsible for mixing in the oceans, governs the shape of flames, and drives weather patterns. The images above show flow patterns caused by buoyant convection. The colors come from liquid crystal beads immersed in the fluid; red indicates cooler fluid and blue indicates warmer fluid. You can see plumes of warmer fluid rising in some of the photos. At the same time, though, the images are beautiful simply as art and are strongly reminiscent of works by Vincent van Gogh. (Image credit: J. Zhang et al.)
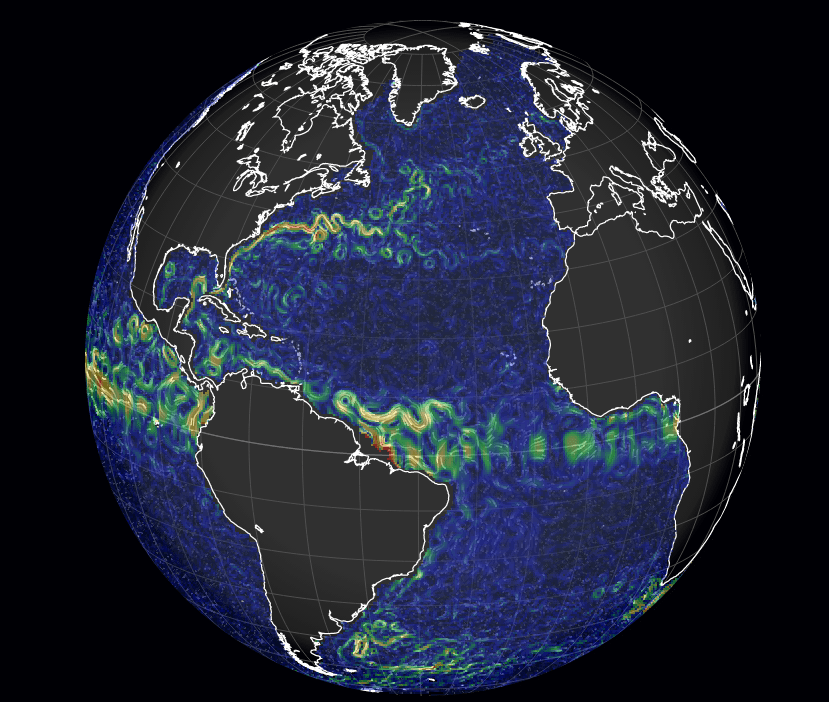
Wind and Waves Visualized

Much like the wind map we featured previously, designer Cameron Beccario’s visualizations of wind and ocean surface current data draw from near-real-time sources to create a stunning picture of fluid dynamics on a planetary scale. The number of options in terms of projections and data are really quite incredible, and you’ll want to play around to get a real sense for it. Want to see the wind and total precipitable water at 1000 hPa? Here you go. Maybe you prefer studying Pacific ocean currents. All the data are there to play with. People often wonder why weather forecasts aren’t always right, but, when you look at the scale and complexity of these flows, it’s almost a wonder that we can predict them at all. (Image credits:C. Beccario/earth; via skunkbear and io9)
Holiday Fluids: Santa’s Aerodynamics
Today we have some holiday-themed fluid dynamics: visualization of flow around Santa’s sleigh! This is a flowing soap film visualization at a low speed (author Nick Moore has some other speeds as well). Santa’s sleigh is what aerodynamicists call a bluff body–a shape that is not streamlined or aerodynamic–and sheds a complicated wake of vortices. Like any object moving through a fluid, Santa’s sleigh generates drag forces made up of several components. There is viscous drag, which comes from friction between the sleigh’s surface and the fluid, and form drag (or pressure drag), which comes from the shape of the sleigh. That wake full of complicated vortices significantly increases the sleigh’s pressure drag, requiring Rudolph and the other reindeer to provide more thrust to counter the sleigh’s drag. Speaking thereof, the visualization does not take into account the aerodynamics of the reindeer, who, in addition to providing the sleigh’s thrust, would also affect the flowfield upstream of the sleigh. This post is part of this week’s holiday-themed post series. (Video credit: N. Moore)
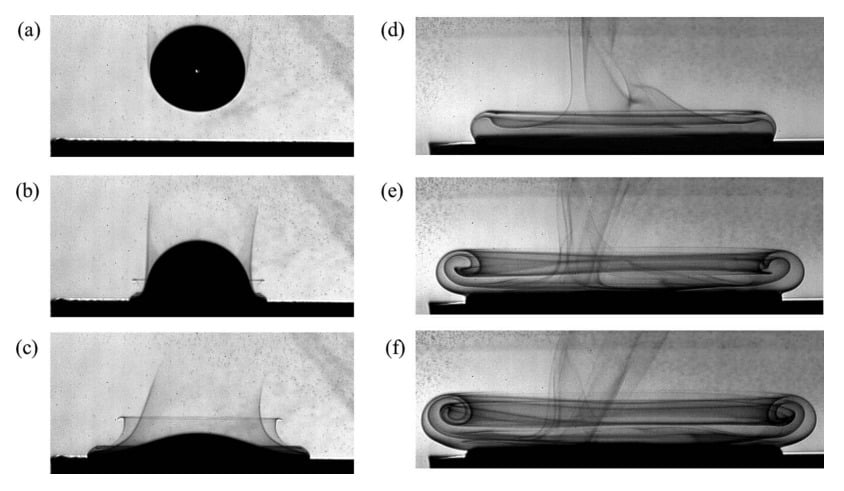
The Vortex Under a Falling Drop
We take for granted that drops which impact a solid surface will splash, but, in fact, drops only splash when the surrounding air pressure is high enough. When the air pressure is low enough, drops simply impact and spread, regardless of the fluid, drop height, or surface roughness. Why this is and what role the surrounding air plays remains unclear. Here researchers visualize the air flow around a droplet impact. In (a) we see the approaching drop and the air it pulls with it. Upon impact in (b) and © the drop spreads and flattens while a crown of air rises in its wake. The drop’s spread initiates a vortex ring that is pinned to the drop’s edge. In later times (d)-(f) the vortex ring detaches from the drop and rolls up. (Photo credit: I. Bischofberger et al.)
Schlieren in Flight
Schlieren photography is a common method of visualizing shock waves in wind tunnel experiments, but it’s much harder to pull off for aircraft in the sky. This video from NASA shows off some stunning work out of NASA Dryden capturing schlieren video of shock waves from a F-15B aircraft at Mach 1.38. You’ll notice that shock waves extend off the nose, wings, tail, and other parts of the airplane and extend well beyond the camera’s field of view. It’s these shock waves hitting the ground level that causes distinctive sonic booms. These tests are part of NASA’s on-going research into minimizing the effects of sonic boom so that civilian supersonic flight over land is feasible in the future. When the U.S. government shutdown ends, you’ll be able to learn more about this work at NASA Dryden’s GASPS page. (Video credit: NASA Dryden)