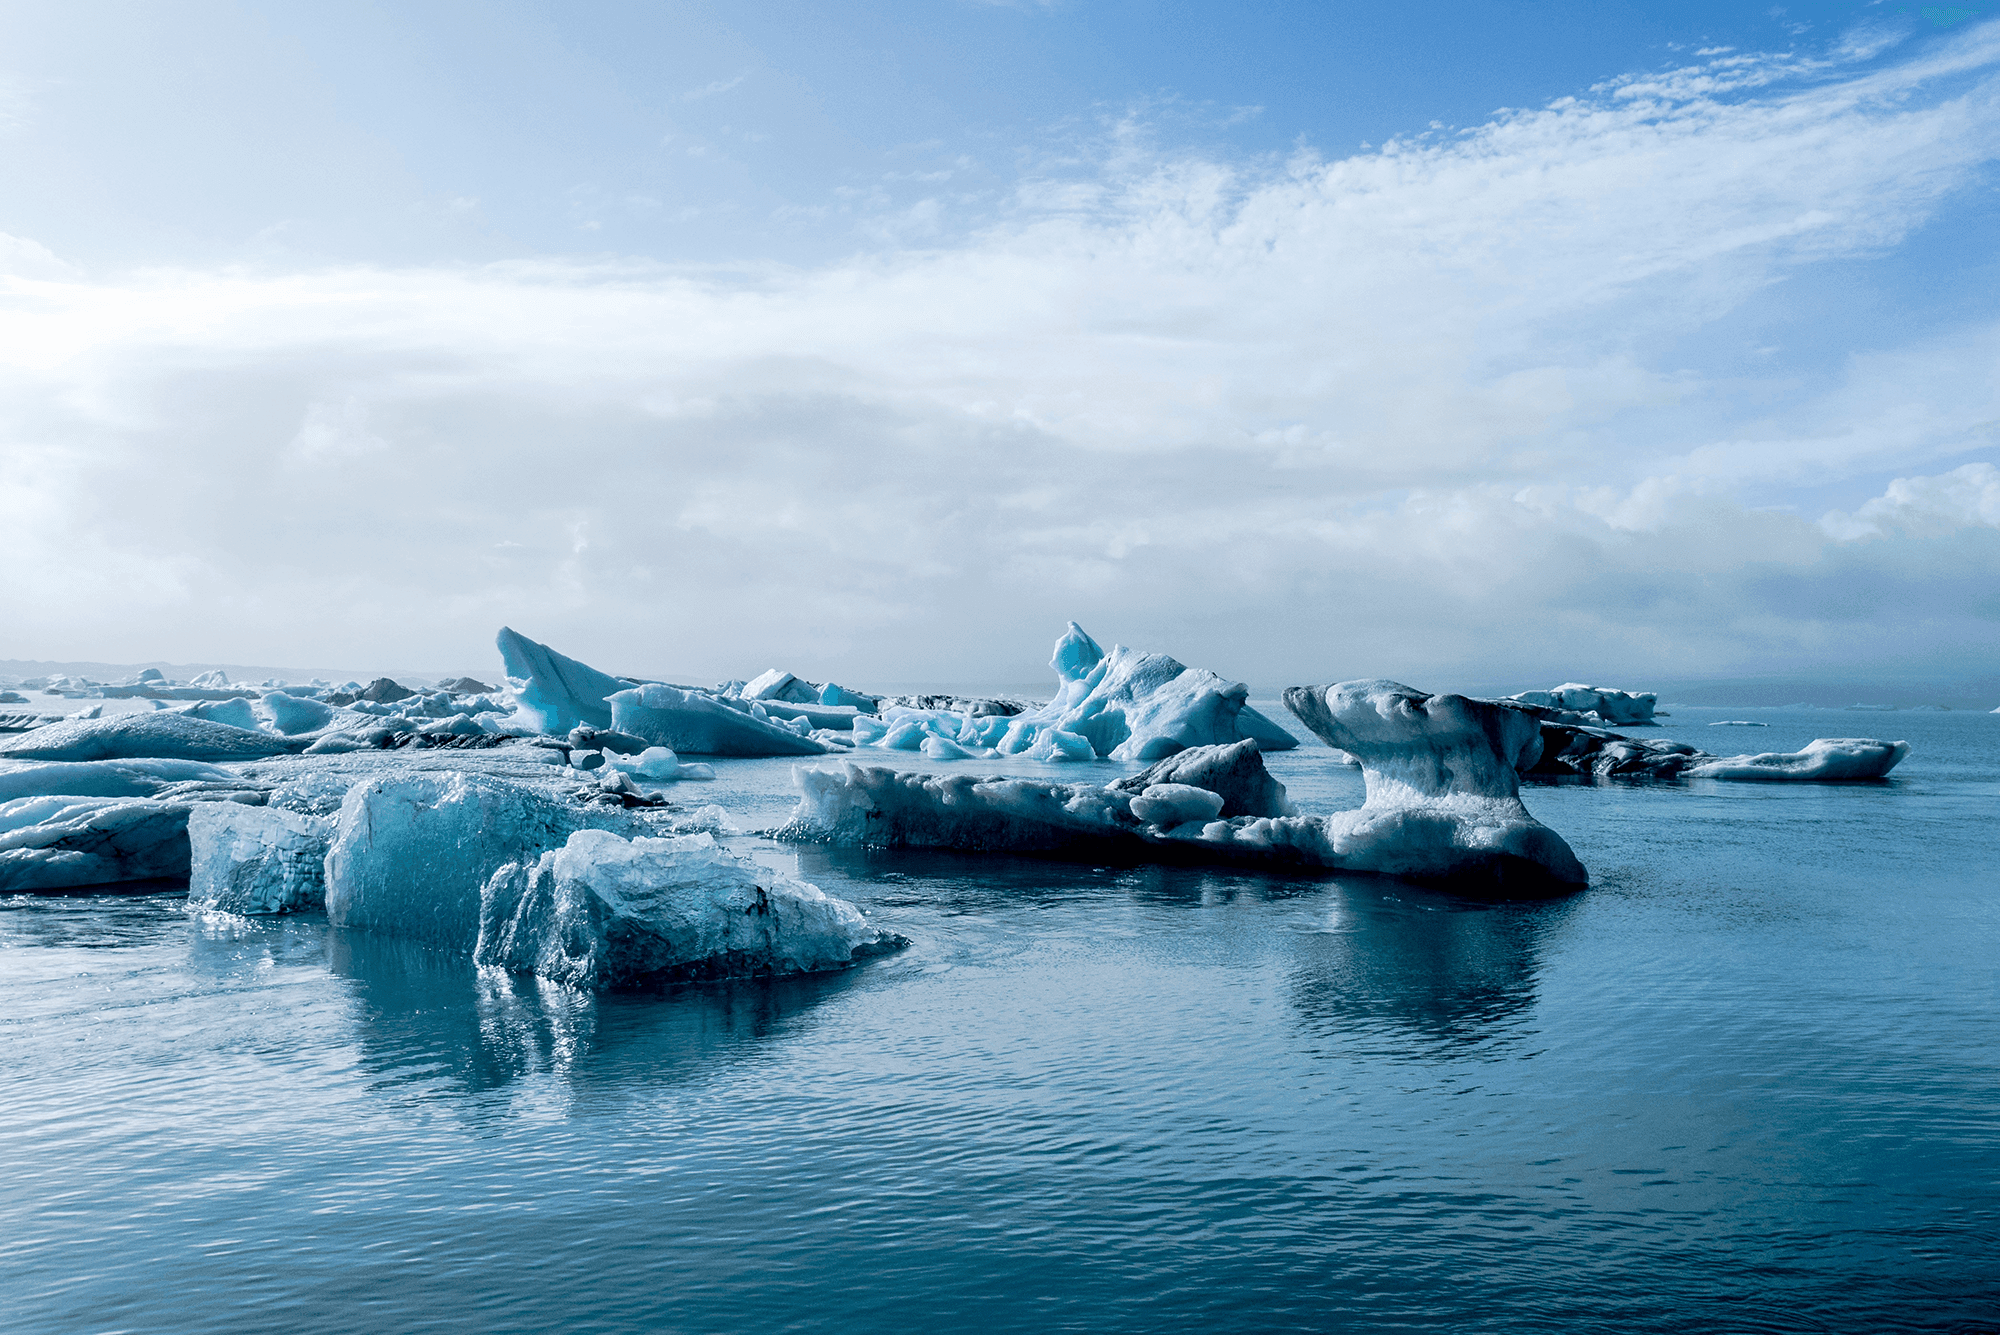
To understand why some sea ice melts and other sea ice survives, researchers tracked millions of floes over decades. This herculean undertaking combined satellite data, weather reports, and buoy data into a database covering nearly 20 years of data. With all of that information, the team could track the changes to specific pieces of ice rather than lumping data into overall averages.
They found that an ice floe’s fate depended strongly on the route it took: ice that slipped from its starting region into warmer, more southern regions was likely to melt. They also saw region-specific effects, like that thick sea ice was more likely to melt in the East Siberian Sea’s summer, possibly due to warmer currents. The comprehensive, fine-grained analyses possible with this ice-tracking technique offer a chance to understand why some Arctic regions are more vulnerable to warming than others. (Image credit: D. Cantelli; research credit: P. Taylor et al.; via Eos)
Under most circumstances, we think about flows changing from ordered and laminar to random and turbulent. But it’s actually possible for disordered flows to become laminar again. This is what we see happening in the clip above. Upstream, the flow in this pipe is turbulent (left). Then four rotors are used to perturb the flow (center). This disrupts the turbulence and causes the flow to become laminar again downstream (right). To understand how this works, we have to talk about one of the fundamental concepts in turbulence: the energy cascade.
Turbulent flows are known for their large range of length scales. Think about a volcanic plume, for example. Some of the turbulent motions in the plume may be a hundred meters across, but there are a continuous range of smaller scales as well, all the way down to a centimeter or less in size. In a turbulent flow, energy starts at the largest scales and flows further and further down until it reaches scales small enough that viscosity can extinguish them.
That should offer a hint as to what’s happening here. The rotors are perturbing the flow, yes, but they’re also breaking the larger turbulent scales down into smaller ones. The smaller the largest lengthscales of the flow are, the more quickly their energy will decay to the smallest lengthscales where viscosity can damp them out. This is what we see here. Once the turbulent energy is concentrated at the smallest scales, viscosity damps them out and the flow returns to laminar. Check out the full video below for a cool sequence where the camera moves alongside the pipe so you can watch the turbulence fading as it moves downstream. (Image and video credit: J. Kühnen et al.)
ETA: As it turns out, there’s more going on here than I’d originally thought. Simulations show that breaking up length scales is not the primary cause of relaminarization in this case. Instead, the rotors are modifying the velocity profile across the pipe in such a way that it tends to cause the turbulence to die out. The full paper is now out in Nature Physics and on arXiv.
When I first studied fluid dynamics, one of the concepts I struggled with was that of Eulerian and Lagrangian reference frames. Essentially, these are just two different perspectives you can view the fluid from. Physics is the same in both, but mathematically, you approach them differently. In the Eulerian perspective one sits at a location and watches the flow pass, like an observer watching a river go by. It’s demonstrated in the top animation, where turbulent flow sweeps past in a pipe. This is the usual perspective experimentally – you put an instrument at a certain point in the flow and you gather information as the fluid streams past in time.
In the Lagrangian perspective, on the other hand, one follows a particular bit of fluid around and observes its changes over time. This means that one has to follow along at the mean speed of the flow in order to keep up with the fluid parcel one is observing. It would be like running alongside a river so that you can always be watching the same water as it flows downstream. The Lagrangian view of the same turbulent pipe flow is shown in the bottom animation. Notice how moving alongside the pipe makes it easier to see how the turbulence morphs as it goes along. Experimentally, this can be harder to achieve (at least in a flow with non-zero mean speed), but it’s a useful method of studying unsteadiness. (Image credit: J. Kühnen et al., source)
Hi, I’m taking a fluids class and I’m not sure I understand the whole lagrangian-eulerian measurements of velocity and acceleration. Could you explain this?
This is a really great question because the Eulerian versus Lagrangian distinction is not obvious when you first learn about it. If you think about a fluid flowing, there are two sensible reference frames from which we might observe. The first is the reference frame in which we are still and the fluid rushes by. This is the Eulerian frame. It’s what you get if you stand next to a wind tunnel and watch flow pass. It’s also how many practical measurements are made. The photo above shows a Pitot tube on a stationary mount in a wind tunnel. With the air flow on, the probe measures conditions at a single stationary point while lots of different fluid particles go past.
The other way to observe fluid motion is to follow a particular bit of fluid around and see how it evolves. This is the Lagrangian method. While this is reasonably easy to achieve in calculations and simulations, it can be harder to accomplish experimentally. To make these kinds of measurements, researchers will do things like mount a camera system to a track that runs alongside a wind tunnel at the mean speed of the flow. The resulting video will show the evolution of a specific region of flow as it moves through time and space. The video below has a nice example of this type of measurement in a wave tank. The camera runs alongside the the wave as it travels, making it possible to observe how the wave breaks.
In the end, both reference frames contain the same physics (Einstein would not have it any other way), but sometimes one is more useful than the other in a given situation. For me, it’s easiest to think of the Eulerian frame as a laboratory-fixed frame, whereas the Lagrangian frame is one that rides alongside the fluid. I hope that helps! (Photo credit: N. Sharp; video credit: R. Liu et al.)
In experiments, it can be difficult to track individual fluid structures as they flow downstream. Here researchers capture this spatial development by towing a 5-meter flat plate past a stationary camera while visualizing the boundary layer – the area close to the plate. The result is that we see turbulent eddies evolving as they advect downstream. Despite the complicated and seemingly chaotic flow field, the eye is able to pick out patterns and structure, like the merging of vortices that lifts eddies up into turbulent bulges and the entrainment of freestream fluid into the boundary layer as the eddies turn over or collapse. It is also a great demonstration of how the Reynolds number relates to the separation of scales in a turbulent flow. Notice how much richer the variety of length-scale is for the higher Reynolds number case and how thoroughly this mixes the boundary layer. (Video credit: J. H. Lee et al.)
In a stream of falling liquid, surface tensioninstabilities cause the fluid to break up into droplets. This video shows a similar experiment with a stream of glass beads, a granular material. The whole system is housed under a vacuum to eliminate the effects of air drag on the stream, and a camera rides alongside the stream to track the evolution of the falling material in a Lagrangian fashion. As with a liquid stream, we see the granular flow develop undulations as it falls, ultimately breaking up into clusters of beads. The authors suggest that nanoscale surface roughness and van der Waals forces may be responsible for the clustering behavior in the absence of surface tension. (Video credit: J. Royer et al.)
It’s fascinating to sit on the beach and watch the waves roll in and break, but rarely do we get a view like the one in this video. Here researchers have created a breaking wave in a wave tank and recorded the wave as it travels the length of the tank with a high-speed camera moving at the same speed as the wave crest. This perspective, moving alongside the fluid, is a Lagrangian coordinate system; if one instead stood still and watched the wave roll past, it would be an Eulerian measurement. Traveling with the wave, we can see how a lip forms on the wave crest, then rolls down, capturing a tube of air. As water begins to flow over the lip, perturbations grow, causing ripples in the laminar curtain. Then the water strikes the main wave and rebounds turbulently, creating a familiar white cap. In the second half of the video, the process is shown from above, highlighting the entrainment of air and the creation of the bubbles that form the white cap of a breaking wave. (Video credit: R. Liu et al)