Schlieren photography is a common experimental flow visualization technique, especially in supersonic flows (where it enables one to see shock waves). Here the Science Channel’s “Cool Stuff: How It Works” show explains the technique and shows some examples from everyday life.
Search results for: “flow visualization”

Turbulence Near the Wall
This photo shows a flow visualization of a turbulent boundary layer at Mach 2.8. The direction of flow is from right to left. In nature, the boundary layer between a surface and a fluid is usually turbulent but impossible to see. The visualization represents an instantaneous snapshot of the flow. Turbulence is known for its intermittency–its strong variation in time–a characteristic that is clear just from comparing the two snapsnots. #

Wingtip Vortices in Ground Effect
In this flow visualization, wingtip vortices from an aircraft have been simulated using an apparatus with a couple of flaps that snap together like a book closing. Dye is pooled on the “ground” below the flaps and gets entrained by the vortices and lit up using laser light. The red vortices are the primary vortex generated by the aircraft wingtips and the green ones are secondary vortices generated by interaction with the ground. The lower half of the picture is a reflection off the ground. This photo was part of the 2009 Gallery of Fluid Motion. #

Wingtip Vortices in Flight
This NASA Langley Research Center test shows real-time flow visualization of the wingtip vortices off a C-5A Galaxy aircraft.
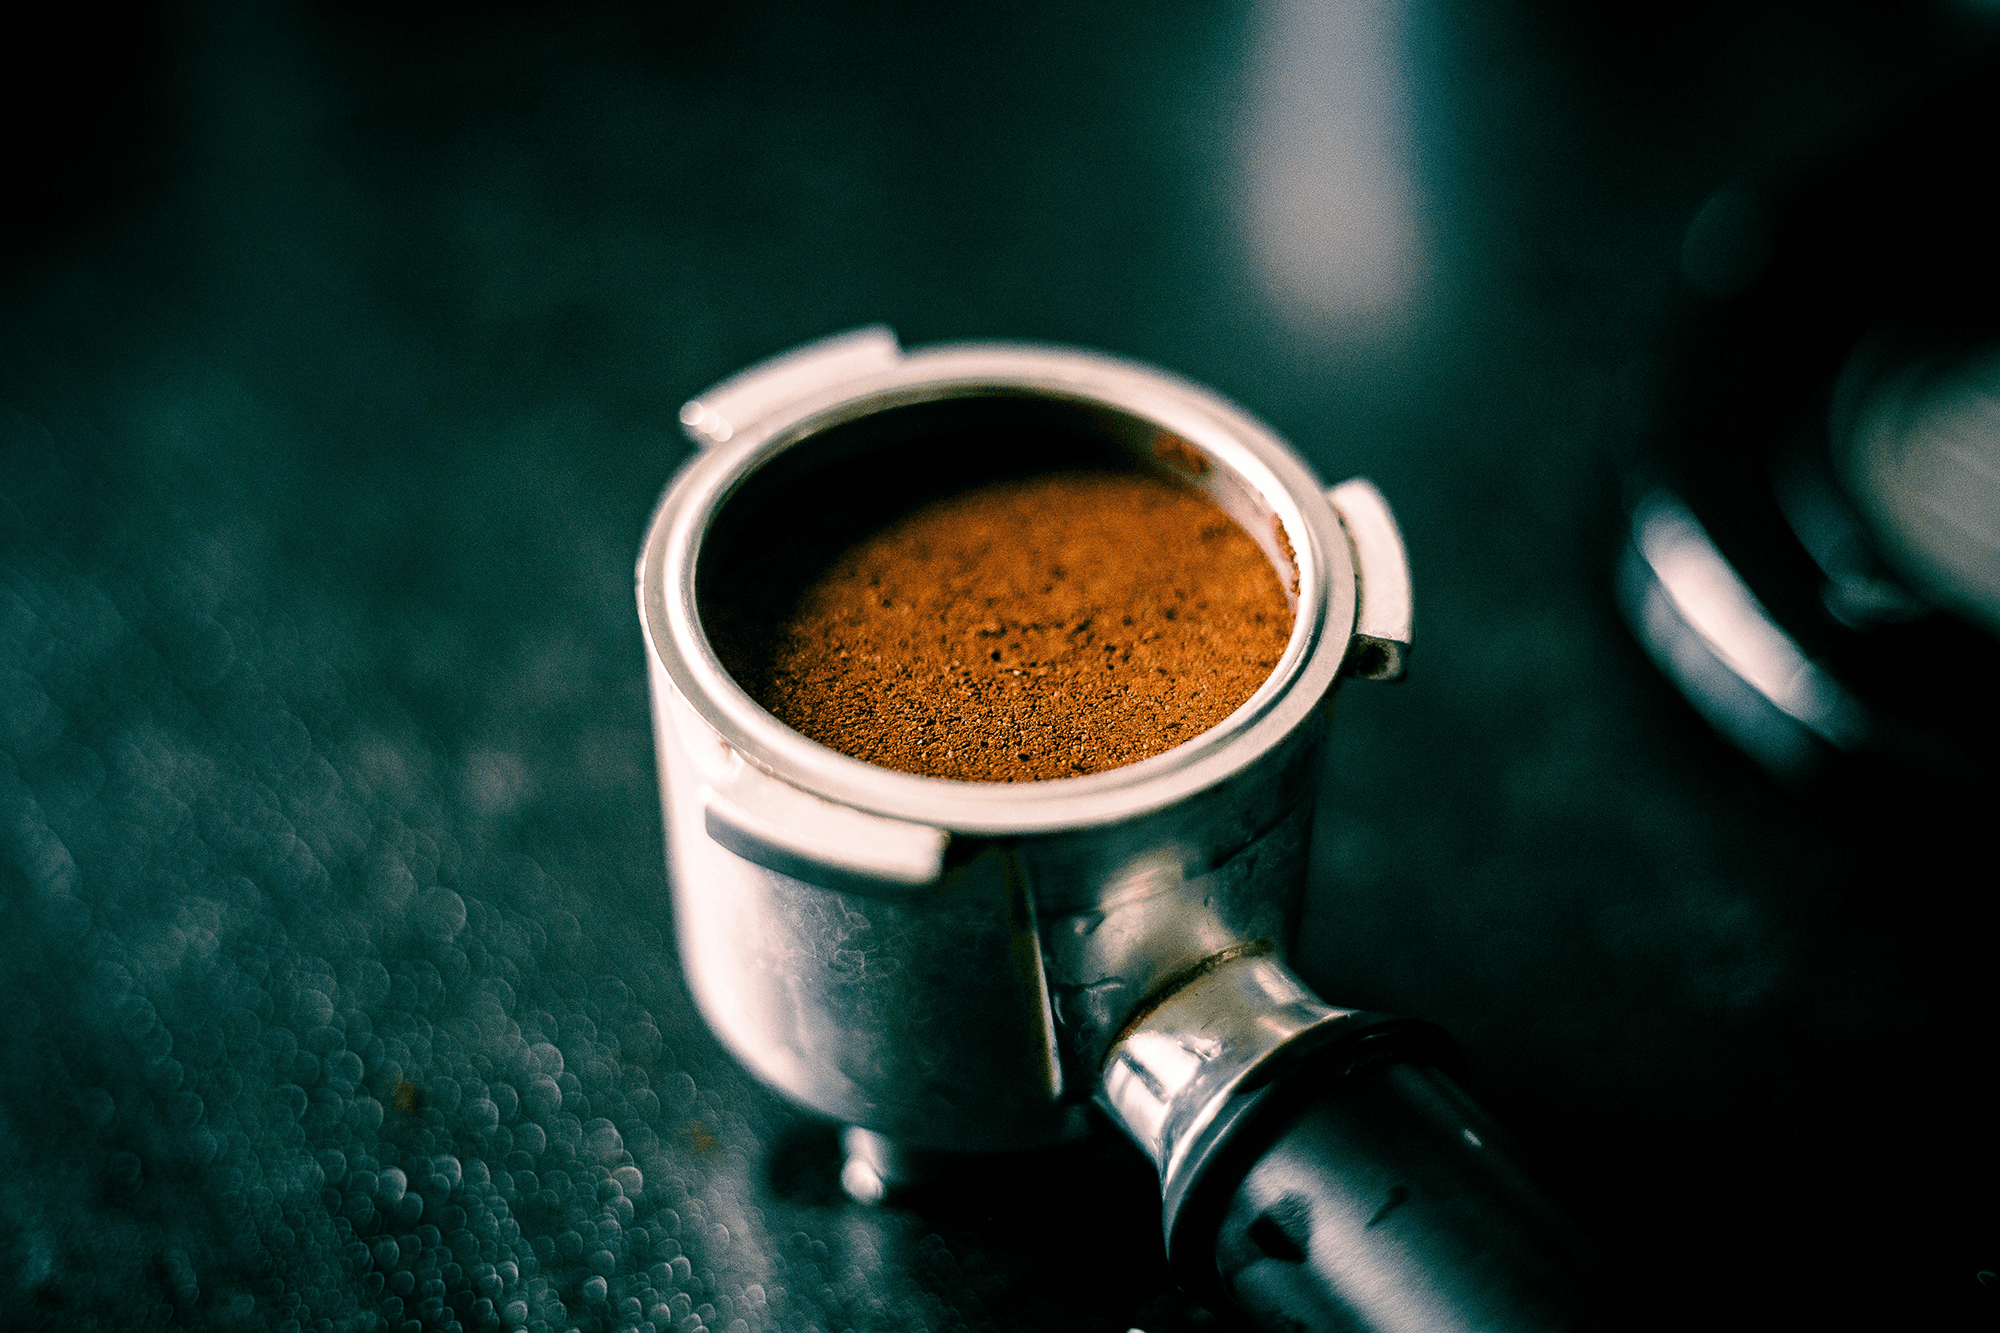
Inside an Espresso Bed
When pulling a shot of espresso, there are complicated physics at play. The ground coffee is tamped into a puck-like bed of grains, through which high-temperature, high-pressure water is forced. Here, researchers used X-ray tomography to visualize how and when water moves through the bed, which affects how flavors extract.
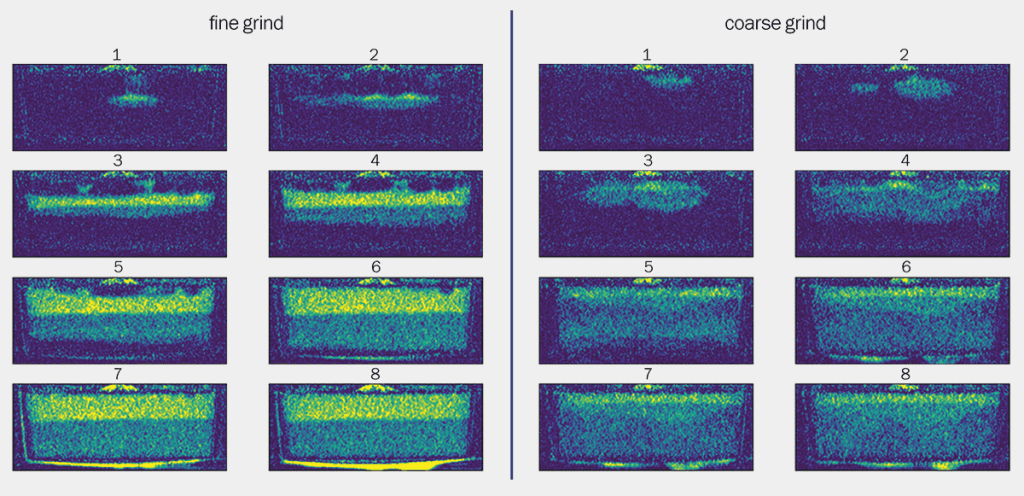
Composite images of water penetrating a bed of finely ground coffee (left) and a bed of coarsely ground coffee (right). In a finely ground bed, water is relatively slow to penetrate the bed, but moves in fairly uniformly. Water can get into the coarse grind a little faster but does so less uniformly. With the new experimental technique in place, the team is interested in seeing how water temperature affects infiltration and what solids get extracted. (Image credit: top – R. Wicks, experiment – J. Foster et al.; research credit: J. Foster et al.; via Physics World)
A Colorful Glimpse
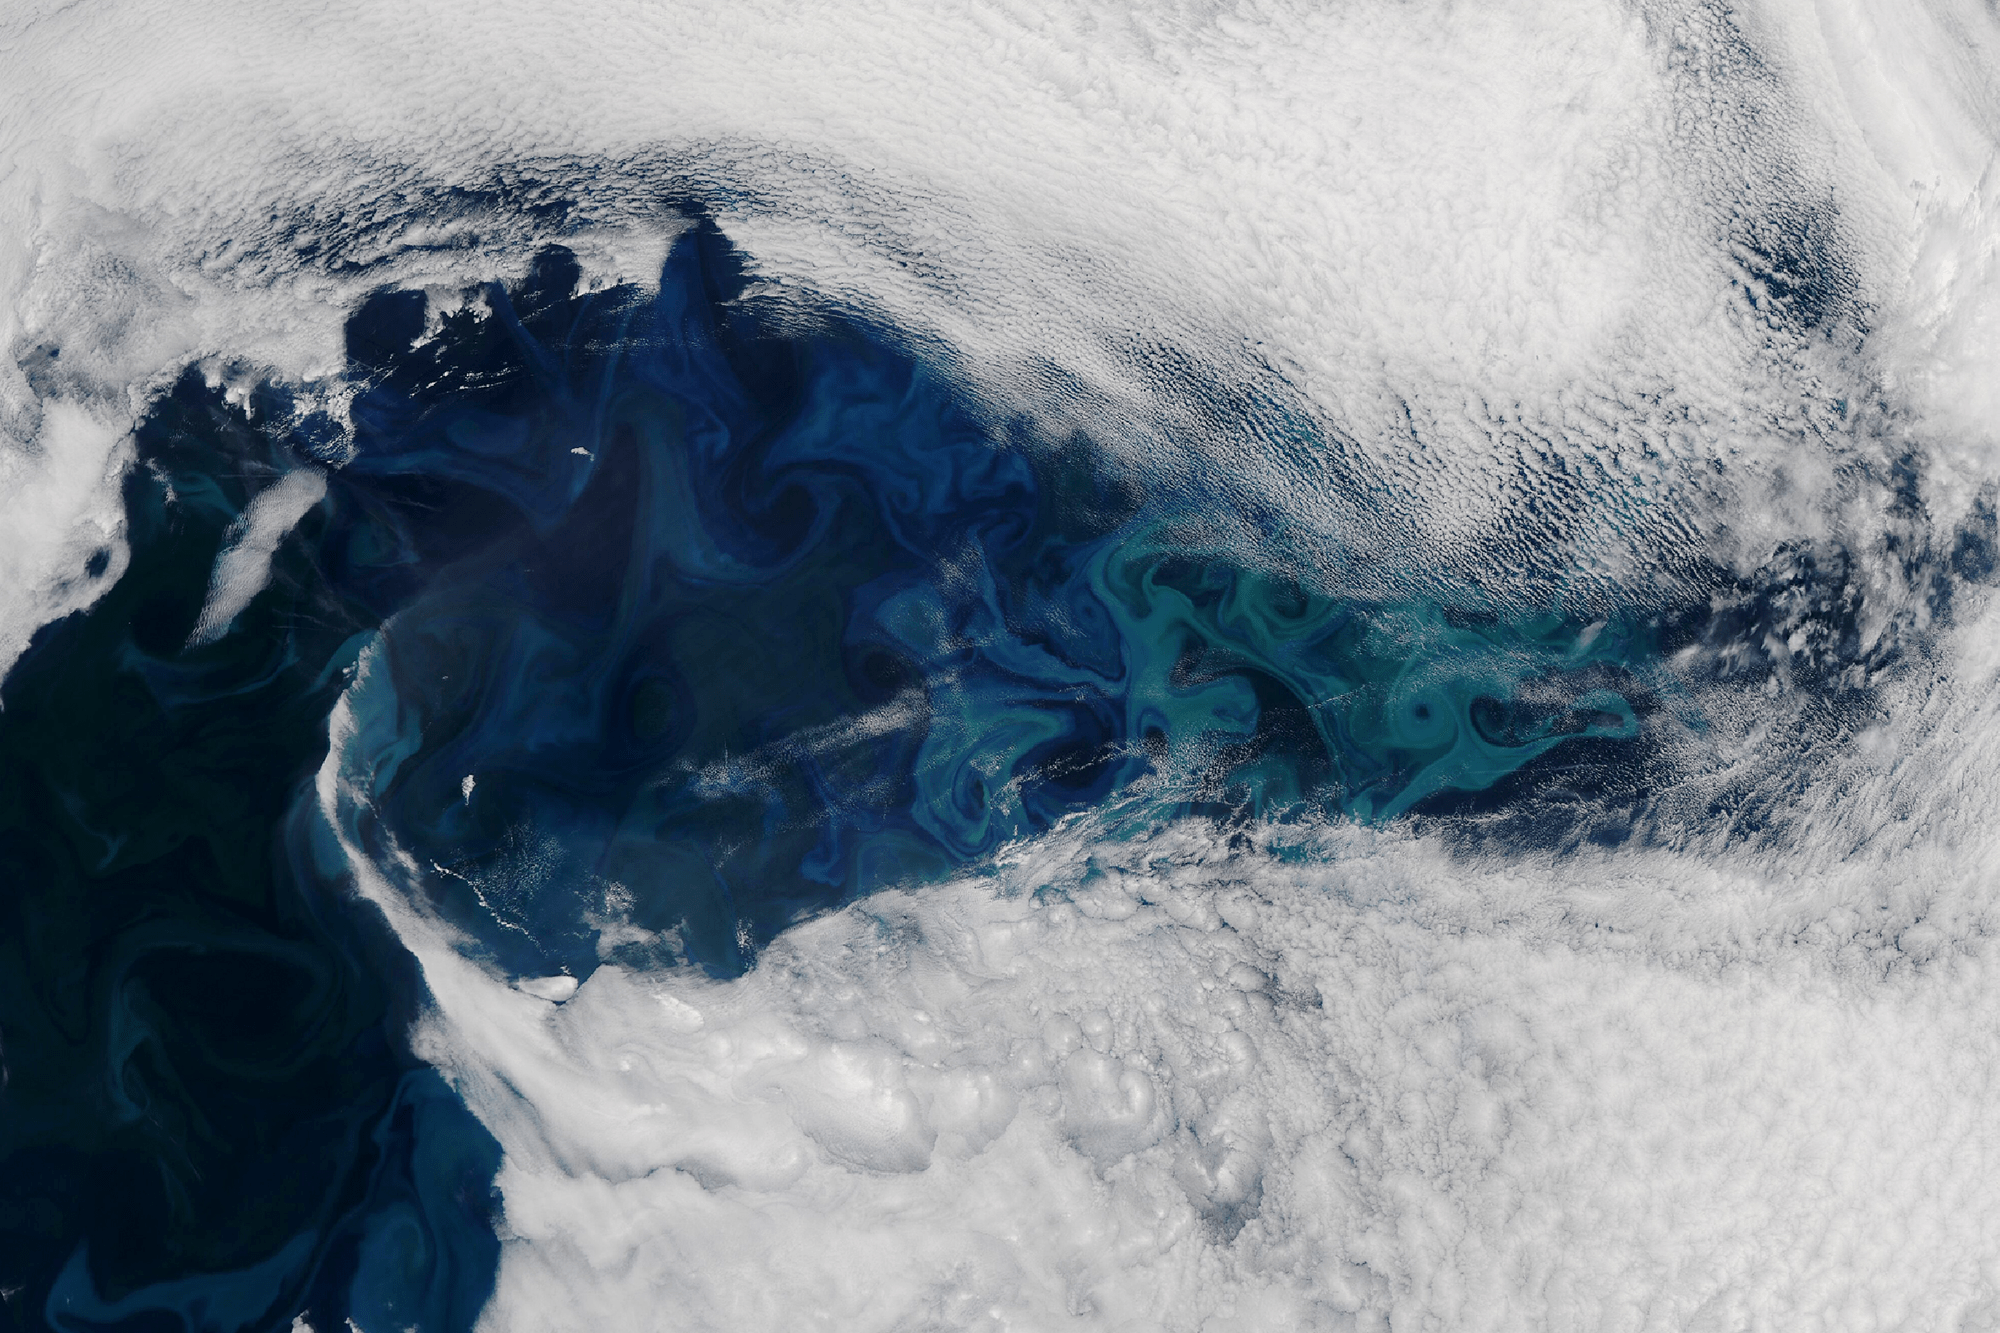
Peeking between the clouds, satellites caught a glimpse of a massive phytoplankton bloom off the coast of Greenland in May 2024. The tiny organisms may be visible only under a microscope, but gatherings like these stretch hundreds of kilometers and are visible from space. Like tracer particles in a flow, the phytoplankton outline the swirls and eddies of the underlying ocean. (Image credit: L. Dauphin; via NASA Earth Observatory)
A satellite image reveals the blue and green swirls of a phytoplankton bloom. Drag Reduction Via Bubbles

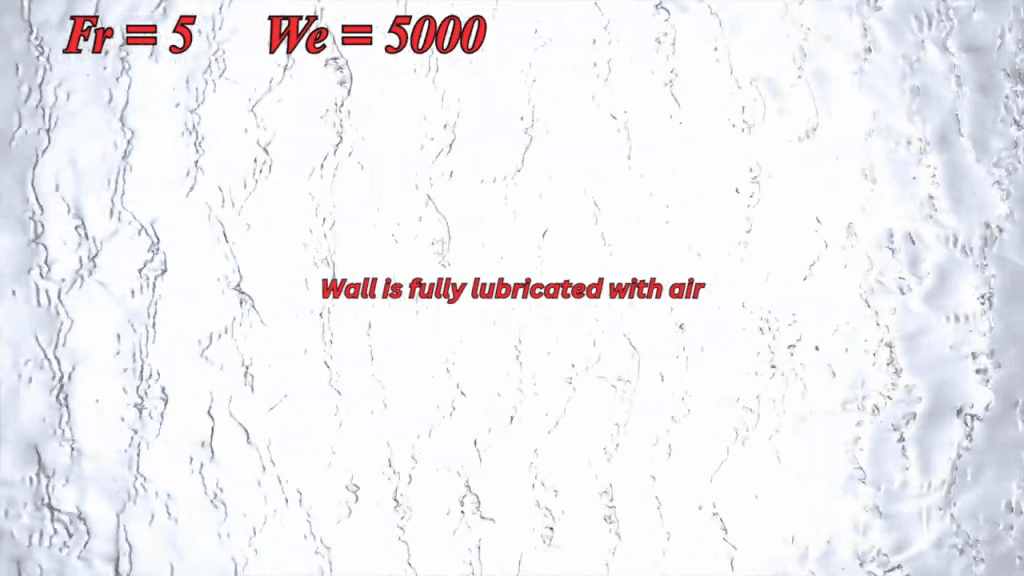
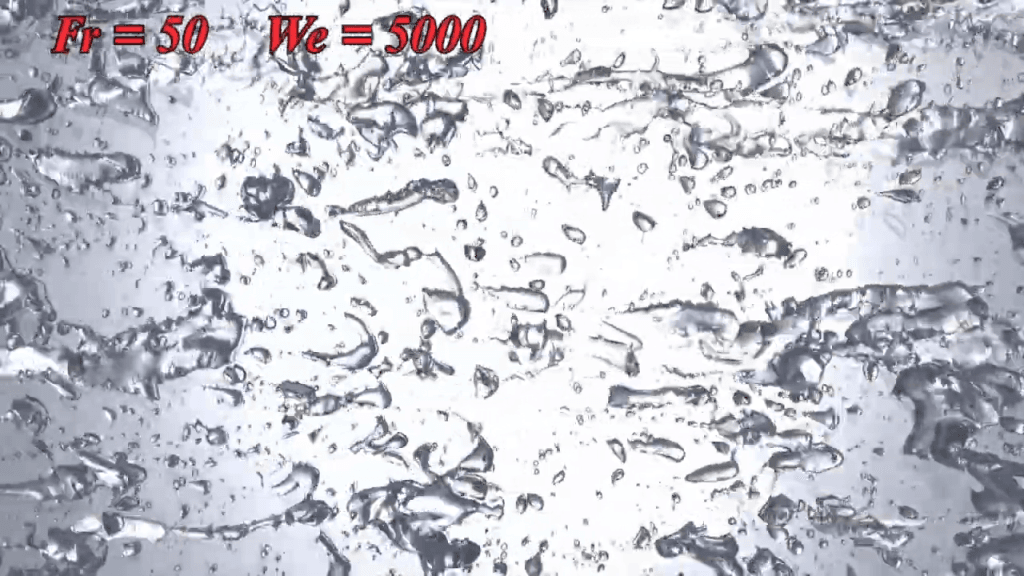
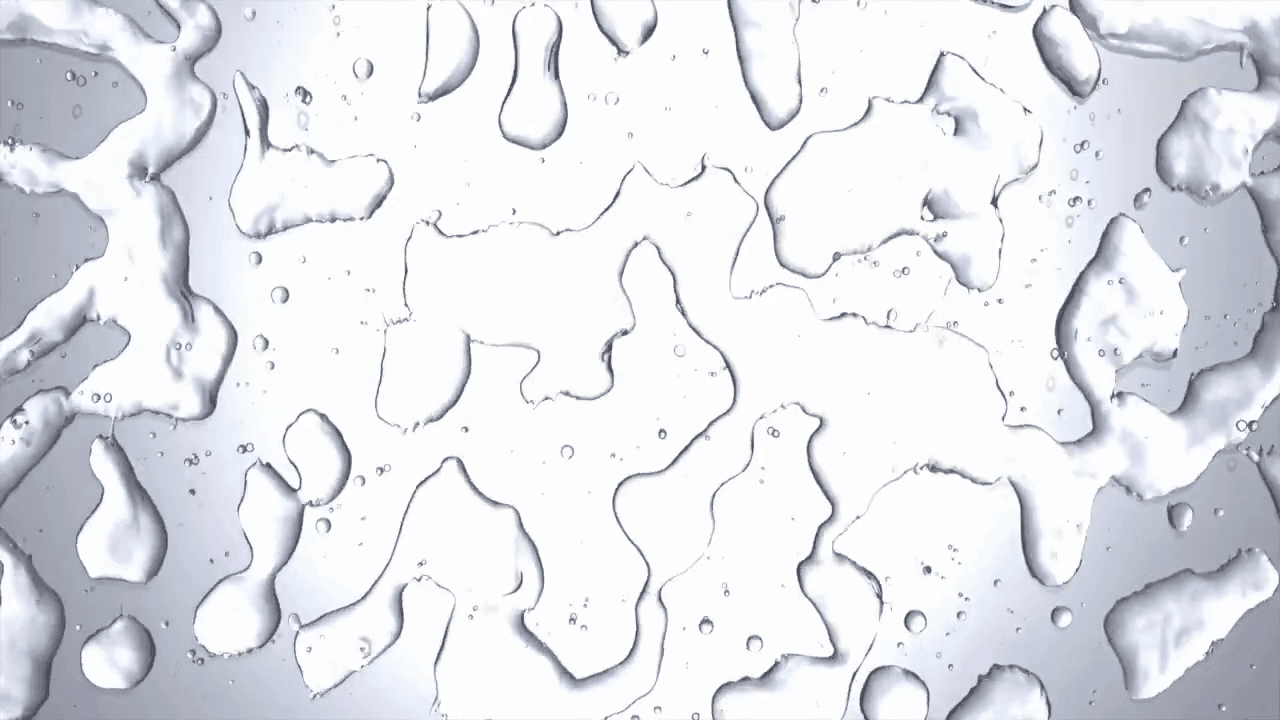
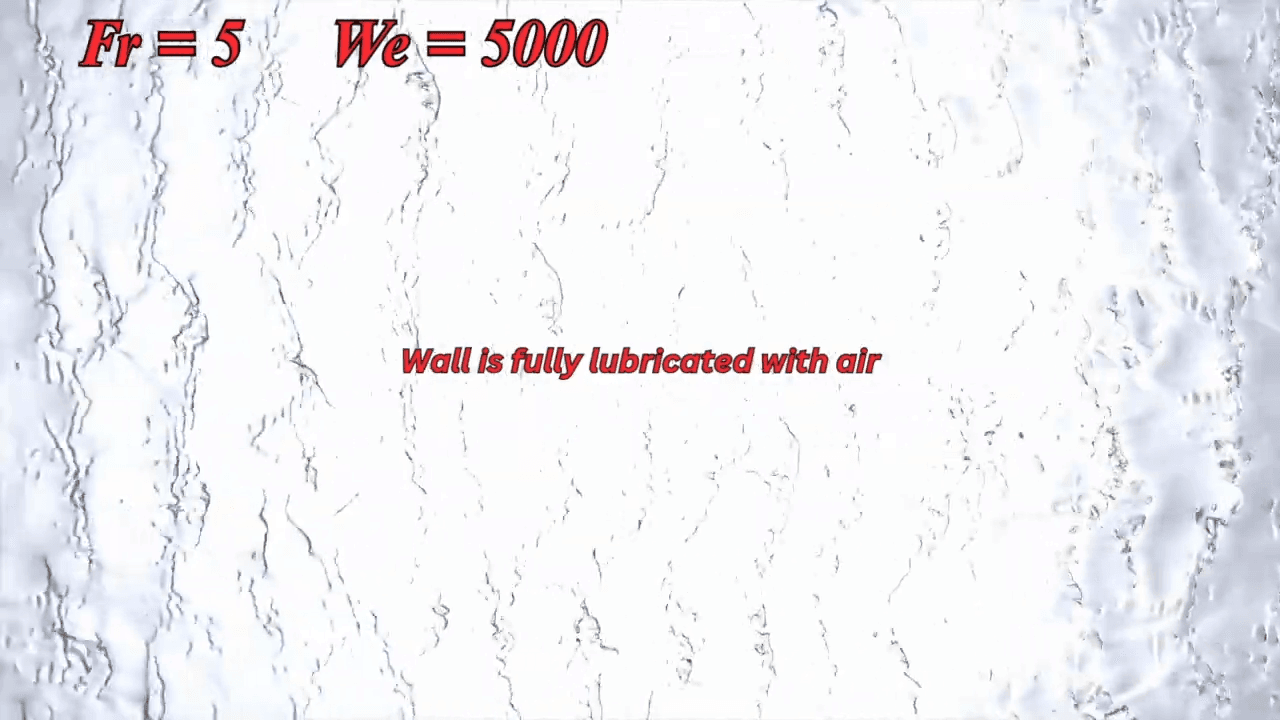
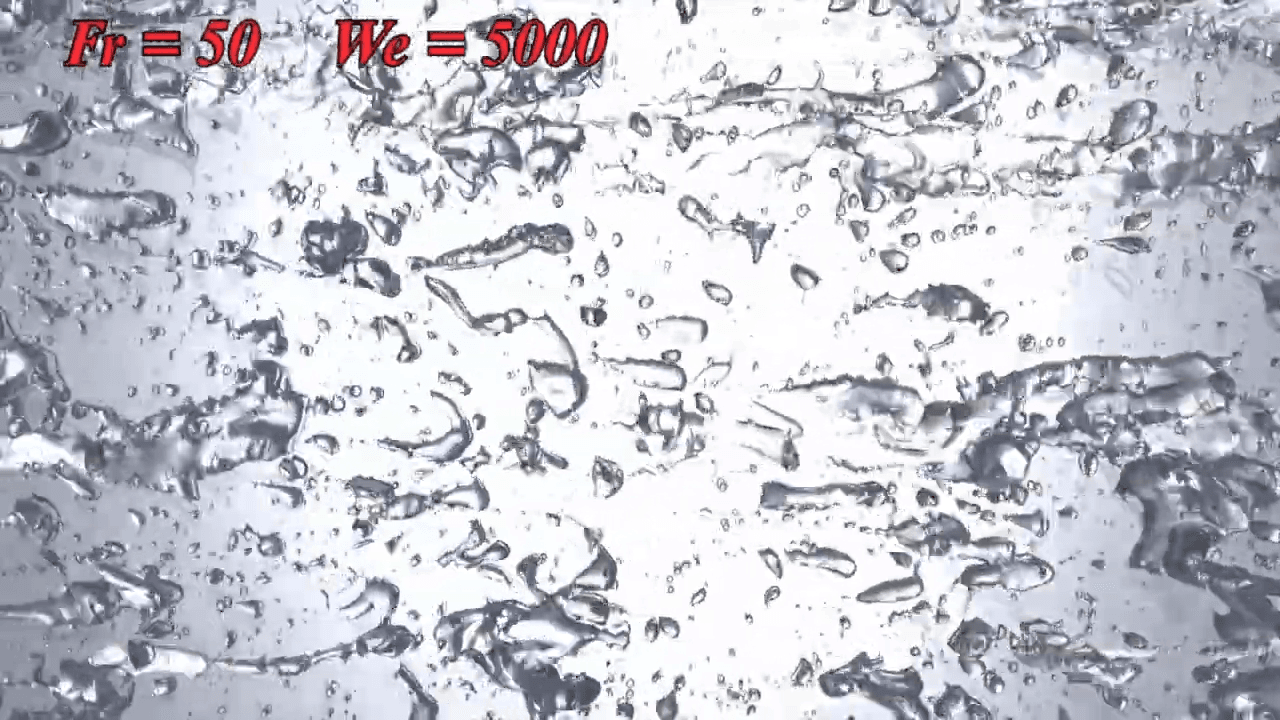
To help reduce greenhouse emissions, businesses are exploring systems that reduce a container ship’s drag by releasing bubbles beneath them. But how do bubbles reduce drag? To find out, researchers simulated a bubbly flow that mimics the underside of a moving ship. By playing with the balance between inertial forces, buoyancy, and surface tension, they were able to sweep through conditions that the bubbles could experience.
The best performance comes when bubbles stick together and coat the entire underside of the surface. In that case, they measured a nearly 40% reduction in the drag. But other conditions were not so fortuitous; in fact, with poorly chosen conditions, adding bubbles could actually increase the drag. (Video and image credit: S. Di Georgio et al.)
ExaWind Simulation


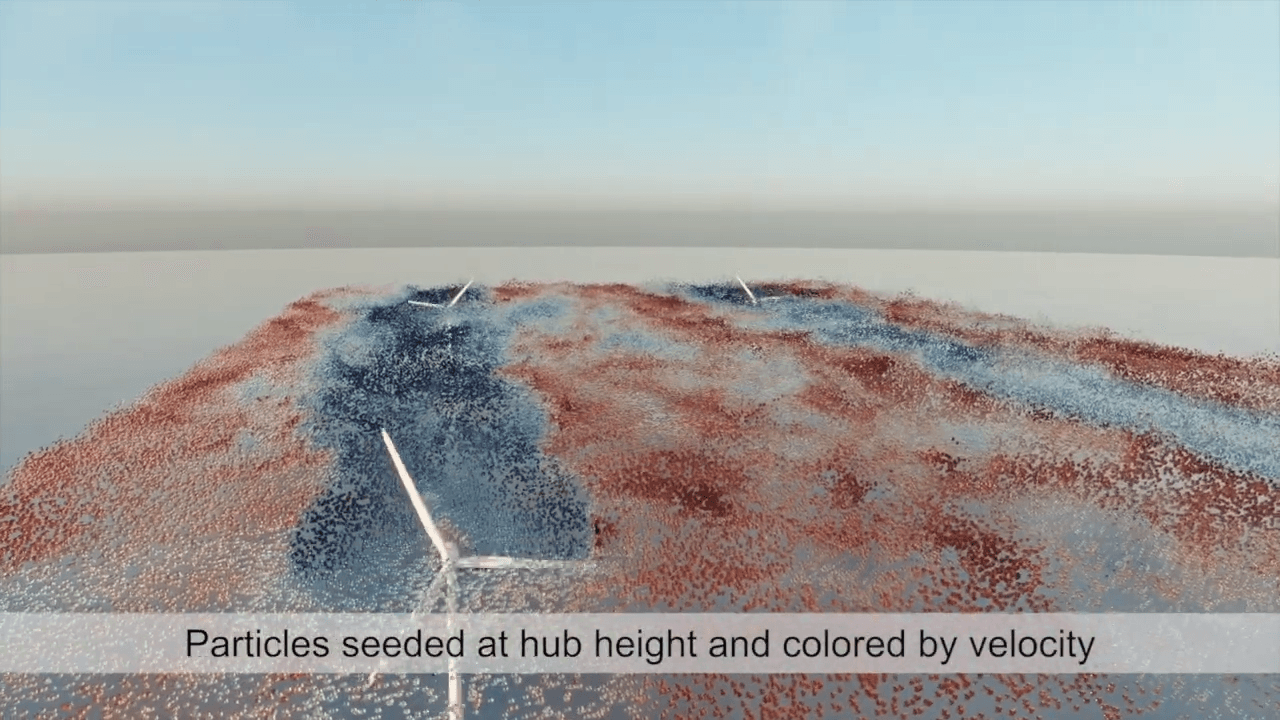
Large-scale computational fluid dynamics simulations face many challenges. Among them is the need to capture both large physical scales–like those of Earth’s atmospheric boundary layer–and small scales–like those of tiny eddies moving around a wind-turbine blade. Capturing all of these scales for a problem like four wind turbines in a wind farm requires using the full computing power of every processor in a large supercomputer. That’s the level of power behind the simulation visualized in this video. The results, however, are stunning. (Video and image credit: M. da Frahan et al.)
Fediverse Reactions
-
Playing With Water in 2D Containers


Once again Steve Mould is putting his prototyping skills to use to work out what goes on inside tricky containers. Here he looks at a “magic” wizard’s cup where — like the assassin’s teapot — cleverly placed holes in the side of the cup can block or allow air’s escape. In the wizard’s cup this lets the wizard refill the cup at will.
He also takes a look at how draining works, using tracer particles and a video editing effect that “echoes” previous frames in a video. For the tracer particles, this algorithm effectively visualizes pathlines in the flow. Areas with faster-moving fluid have longer pathlines that are closer together, whereas slow-moving regions have short pathlines. (Video credit: S. Mould)
Star-Birthing Shock Waves
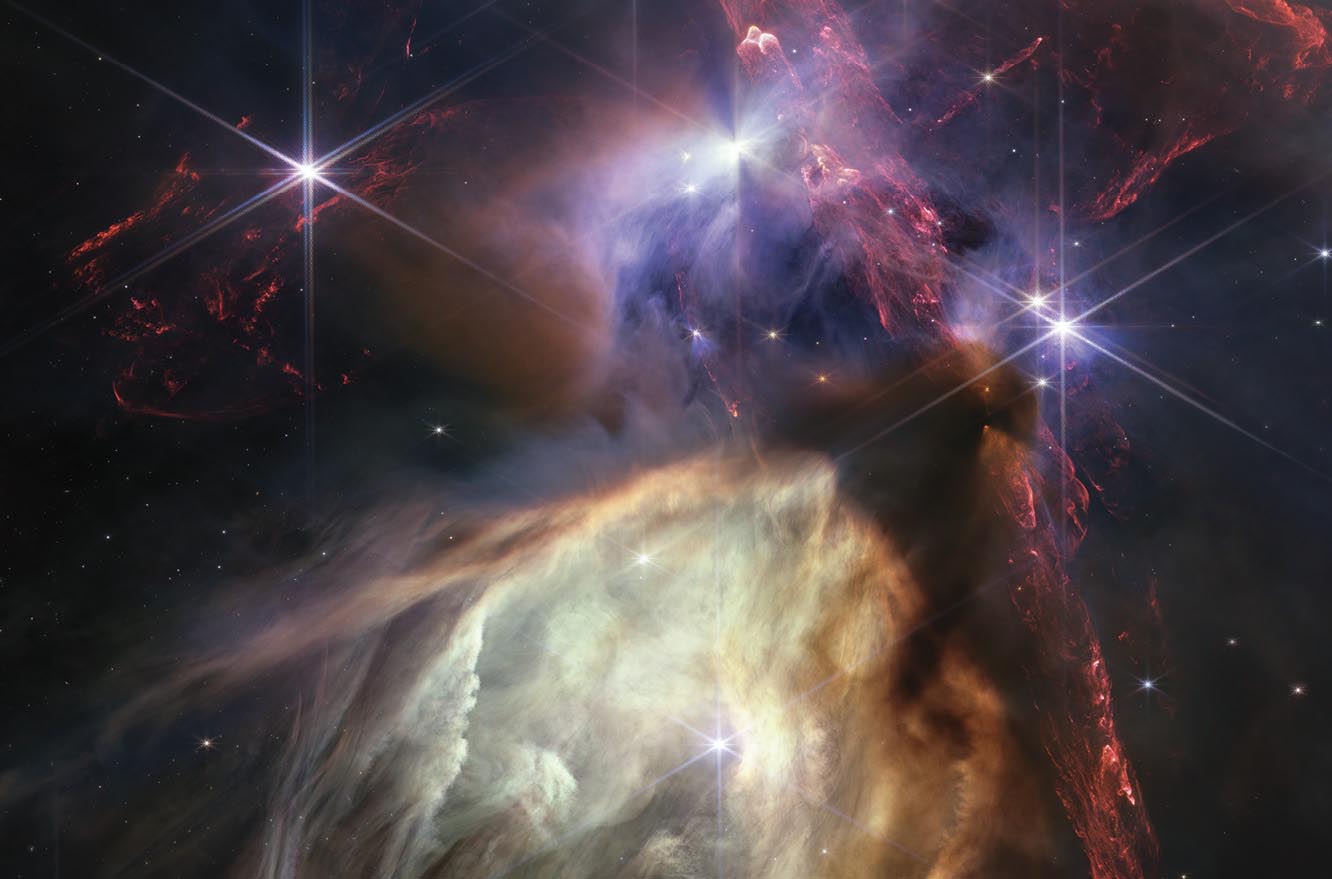
Although the space between stars is empty by terrestrial standards, it’s not devoid of matter. There’s a scattering of cold gas and dust, pocked by areas known as prestellar cores with densities of a few thousand particles per cubic centimeter. This is just enough matter to help gravity eventually win its tug of war with the forces that would drive molecules apart.
When shock waves pass through these regions — whether thrown off a dying star or a newly birthed one — they compress the material, kickstarting the process of stellar formation. Passing shock waves can also shake loose molecules stuck to the dust, providing key tracer elements that astronomers can use to visualize shock waves and the areas they affect. To learn more, see this article over at Physics Today. (Image credit: NASA/ESA/CSA/STSCI/K. Pontoppidan/A. Pagan; see also Physics Today)