Dolphins are such fast and agile swimmers that, naturally, scientists have long wanted to understand how they swim so well. A recent study draws on numerical simulation to analyze the flow a dolphin creates when flapping its tail.
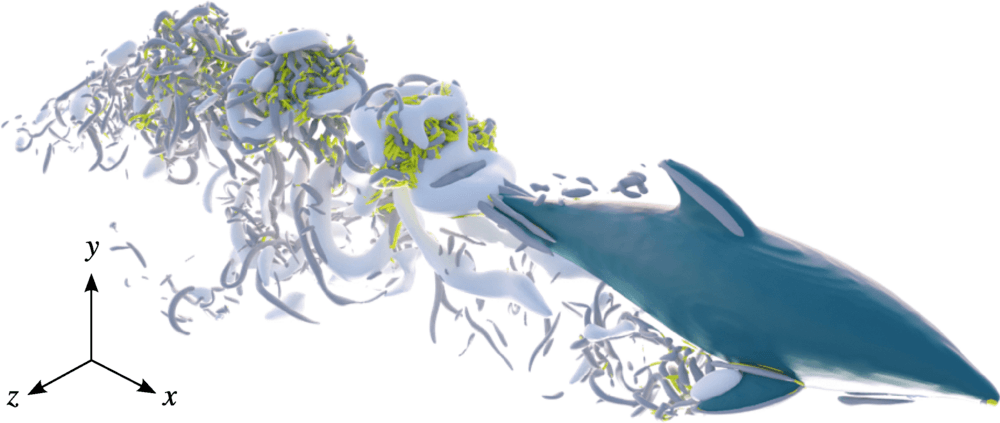
The resulting flow is highly turbulent–researchers were only able to simulate up to a fraction of a dolphin’s actual Reynolds number–with both large-scale vortices and a cascade of smaller ones. The largest vortices, shown here in white, form on the upper and lower surface of the dolphin’s tail, then slide off the tail in a vortex ring. It’s these vortex rings, the researchers found, that provide the bulk of a dolphin’s thrust.
The smaller-scale vortices, in contrast, get formed by the large vortices, and they make little to no contribution to the dolphin’s propulsion. Interestingly, these results suggest that we might be able to describe the propulsion of dolphins and other highly turbulent swimmers by focusing only on the largest scales in the flow. (Video, image, and research credit: Y. Motoori et al.; via Ars Technica)