This flow visualization of a pitching wind turbine blade demonstrates why lift and drag can change so drastically with angle of attack. When the angle the blade makes with the freestream is small, flow stays attached around the top and bottom surfaces of the blade. At large (positive or negative) angles of attack, the flow separates from the turbine blade, beginning at the trailing edge and moving forward as the angle of attack increases. The separated flow appears as a region of recirculation and turbulence. This is the same mechanism responsible for stall in aircraft. (Submitted by Bobby E)
Search results for: “flow visualization”

Visualizing Fish Wakes
This novel flow visualization technique uses dilute solutions of the tobacco mosaic virus (TMV). These rod-shaped particles align with shear and produce a birefringent interference pattern visible when viewed between crossed polarizing filters. The intensity of the light is related to the magnitude of shear. The technique is benign to the fish but enables researchers to see fluid motion around fish that other techniques cannot capture. #
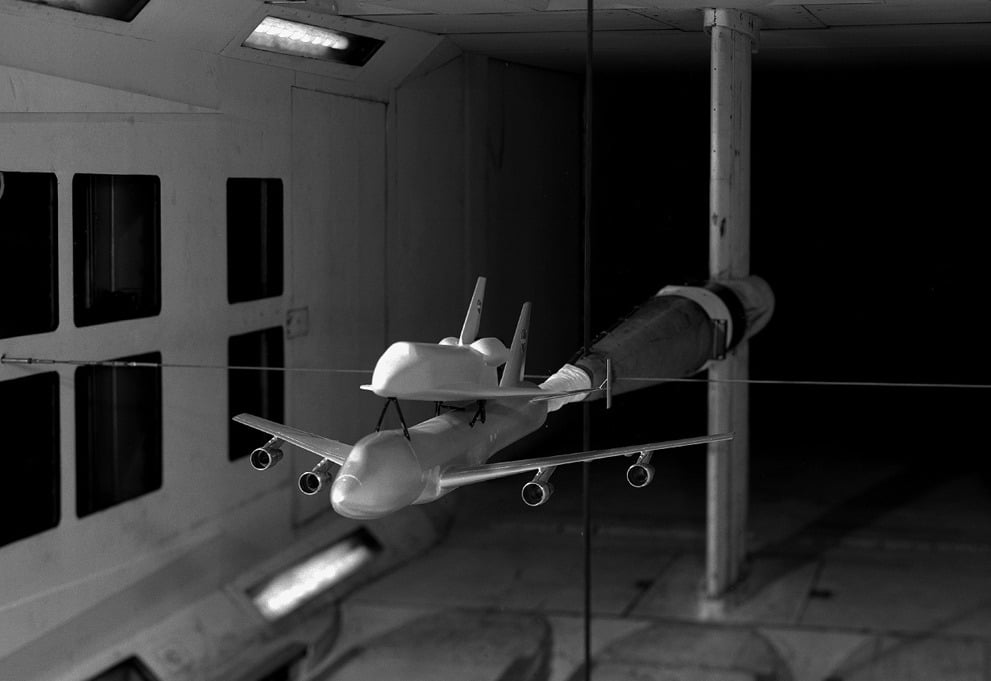
Wind Tunnel Testing
A scale model of the Space Shuttle attached to its modified 747 carrier hangs in a NASA wind tunnel. Wind tunnel tests can be used for flow visualization, lift and drag measurements, control system checks and so forth, but mounting models correctly and safely in the tunnel is crucial. Many models use sting mounts that project forward, as this one does, in order to expose the model to freestream flow unimpeded by the mounting mechanism. Any mounts and models must also be sturdy enough that all or part of them does not break off mid-test and fly into the wind tunnel’s fans. #
Aerodynamics with Bill Nye and Samuel L. Jackson
Bill Nye, Samuel Jackson, golf balls, Reynolds number, dimples, and boundary layers. It doesn’t get much better than this. – Khristopher O (submitter)
It definitely beats Jackson’s other foray into aerodynamics! The dimples on a golf ball cause turbulent boundary layers, which actually decrease drag on the ball and make it fly farther. Why bluff bodies experience a reduction in drag as speed (and thus Reynolds number) increases was a matter of great confusion for fluid mechanicians early in the twentieth century, but it’s not too hard to see why it happens with some flow visualization.


On the top sphere, the laminar boundary layer separates from the sphere just past its shoulder. This results in a pressure loss on the backside of the sphere and, thus, an increase in drag. On the bottom sphere, a trip-wire placed just before the shoulder causes a turbulent boundary layer, which separates from the sphere farther along the backside. This late separation results in a thinner wake and a smaller pressure loss behind the sphere, thereby reducing the overall drag when compared to the laminar case. (Photo credit: An Album of Fluid Motion)
Shock Waves
Flow visualization really can be considered a form of art. Though we fluid mechanicians are looking for physics, we’re quite aware of the beauty of what we study. The clips in this video mostly show transient shockwave behavior, including lots of shock reflection and even a few instabilities. It’s unclear what the speeds are, aside from faster than sound; the medium is air.

Wake of a Rising Sphere
This flow visualization shows the wake left by a freely rising sphere. Observations of rising and falling spheres date at least back to Newton, who observed that the inflated hog bladders he used “did not always fall straight down, but sometimes flew about and oscillated to and fro while falling”. That vibration is caused by the vortices seen here in the wake. There are actually four vortices shed per oscillation cycle–two primary vortices (marked P) and two secondary vortices (marked S). #
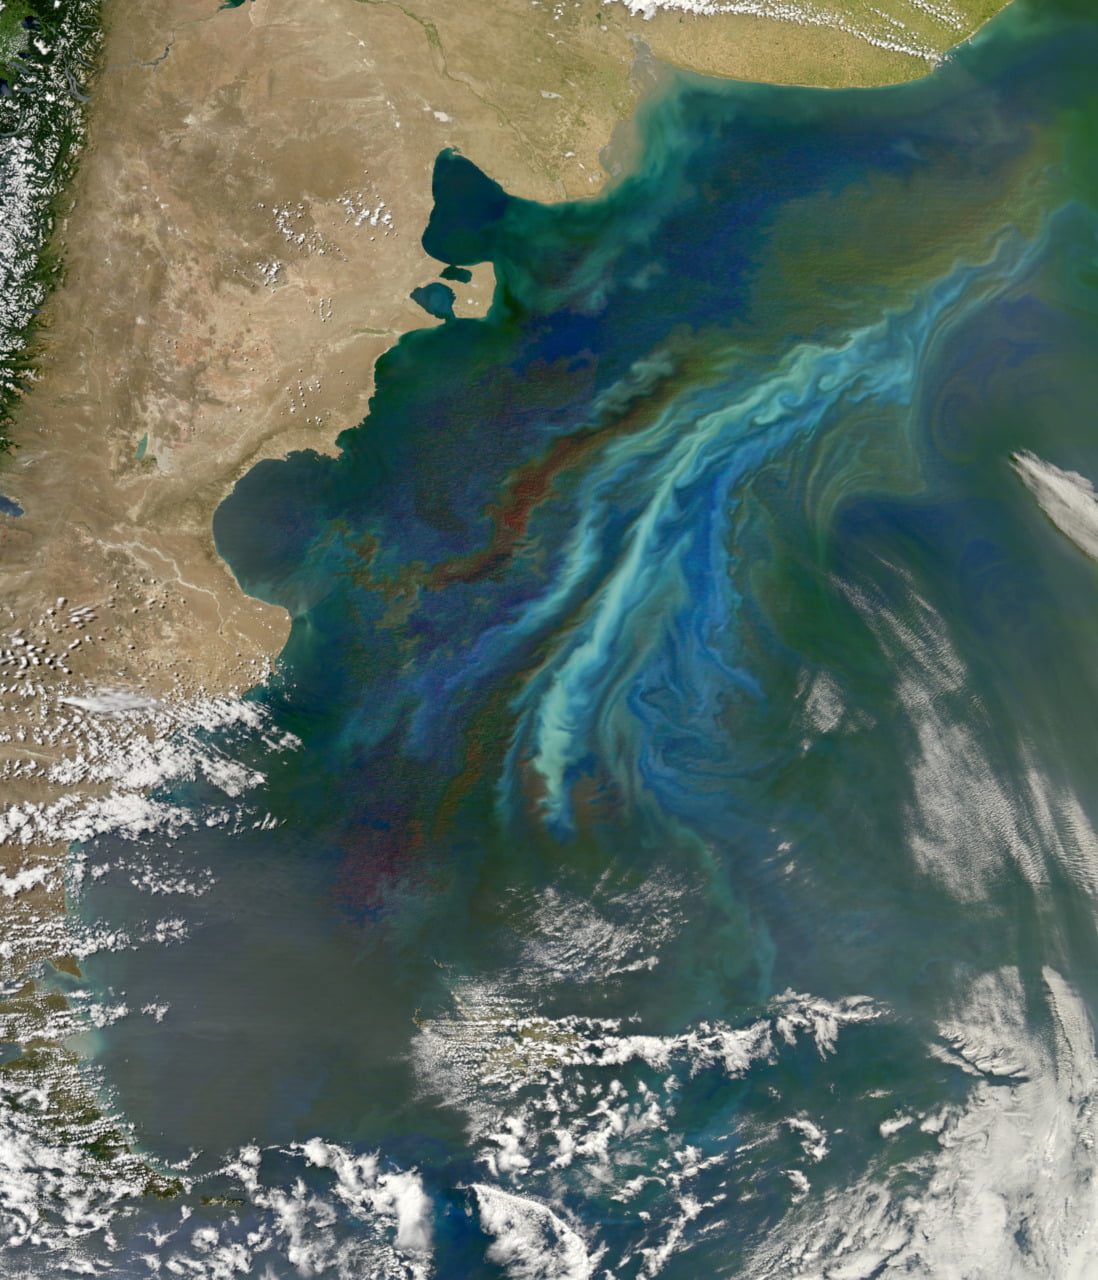
Turbulent Phytoplankton Eddies
Where warm and cold ocean currents collide, turbulent eddies form and pull up valuable nutrients from the ocean floor. Massive phytoplankton blooms ensue, effectively providing natural flow visualization for the process. #

Vortex Street
A flow visualization behind a cylinder shows the formation of a von Karman vortex street. The frequency of vortex shedding in the wake is directly related to the speed of the airflow–the higher the velocity, the faster vortices will shed from the cylinder. This relationship is expressed in the Strouhal number, which remains constant for any cylinder. (via freshphotons)
Seeing the Invisible
Schlieren photography is a common experimental flow visualization technique, especially in supersonic flows (where it enables one to see shock waves). Here the Science Channel’s “Cool Stuff: How It Works” show explains the technique and shows some examples from everyday life.

Turbulence Near the Wall
This photo shows a flow visualization of a turbulent boundary layer at Mach 2.8. The direction of flow is from right to left. In nature, the boundary layer between a surface and a fluid is usually turbulent but impossible to see. The visualization represents an instantaneous snapshot of the flow. Turbulence is known for its intermittency–its strong variation in time–a characteristic that is clear just from comparing the two snapsnots. #