[original media no longer available]
This video gives a neat introduction to some common and uncommon techniques used to visualize fluid flows.
[original media no longer available]
This video gives a neat introduction to some common and uncommon techniques used to visualize fluid flows.

This video, created by undergraduates as part of a fluid dynamics laboratory course, shows flow visualization of a von Karman vortex street in the wake of a cylinder in comparison to a computational fluid dynamics (CFD) simulation of the same phenomenon. If you’re wondering about the black-and-white segments and the peculiar speech patterns, look no further. The students are parodying a series of videos made by MIT in the 1960s that are still used in classrooms today.


Kirigami is a paper art that combines folding and cutting to create elaborate shapes. Here, researchers use cuts in thin sheets of plastic and explore how the sheets transform in a flow. Depending on the configuration of cuts, the sheets can stretch dramatically in the flow, creating complex, dynamic, and beautiful wakes. I feel like there must be some applications out there that would benefit from kirigami-induced mixing. (Video and image credit: A. Carleton and Y. Modarres-Sadeghi)
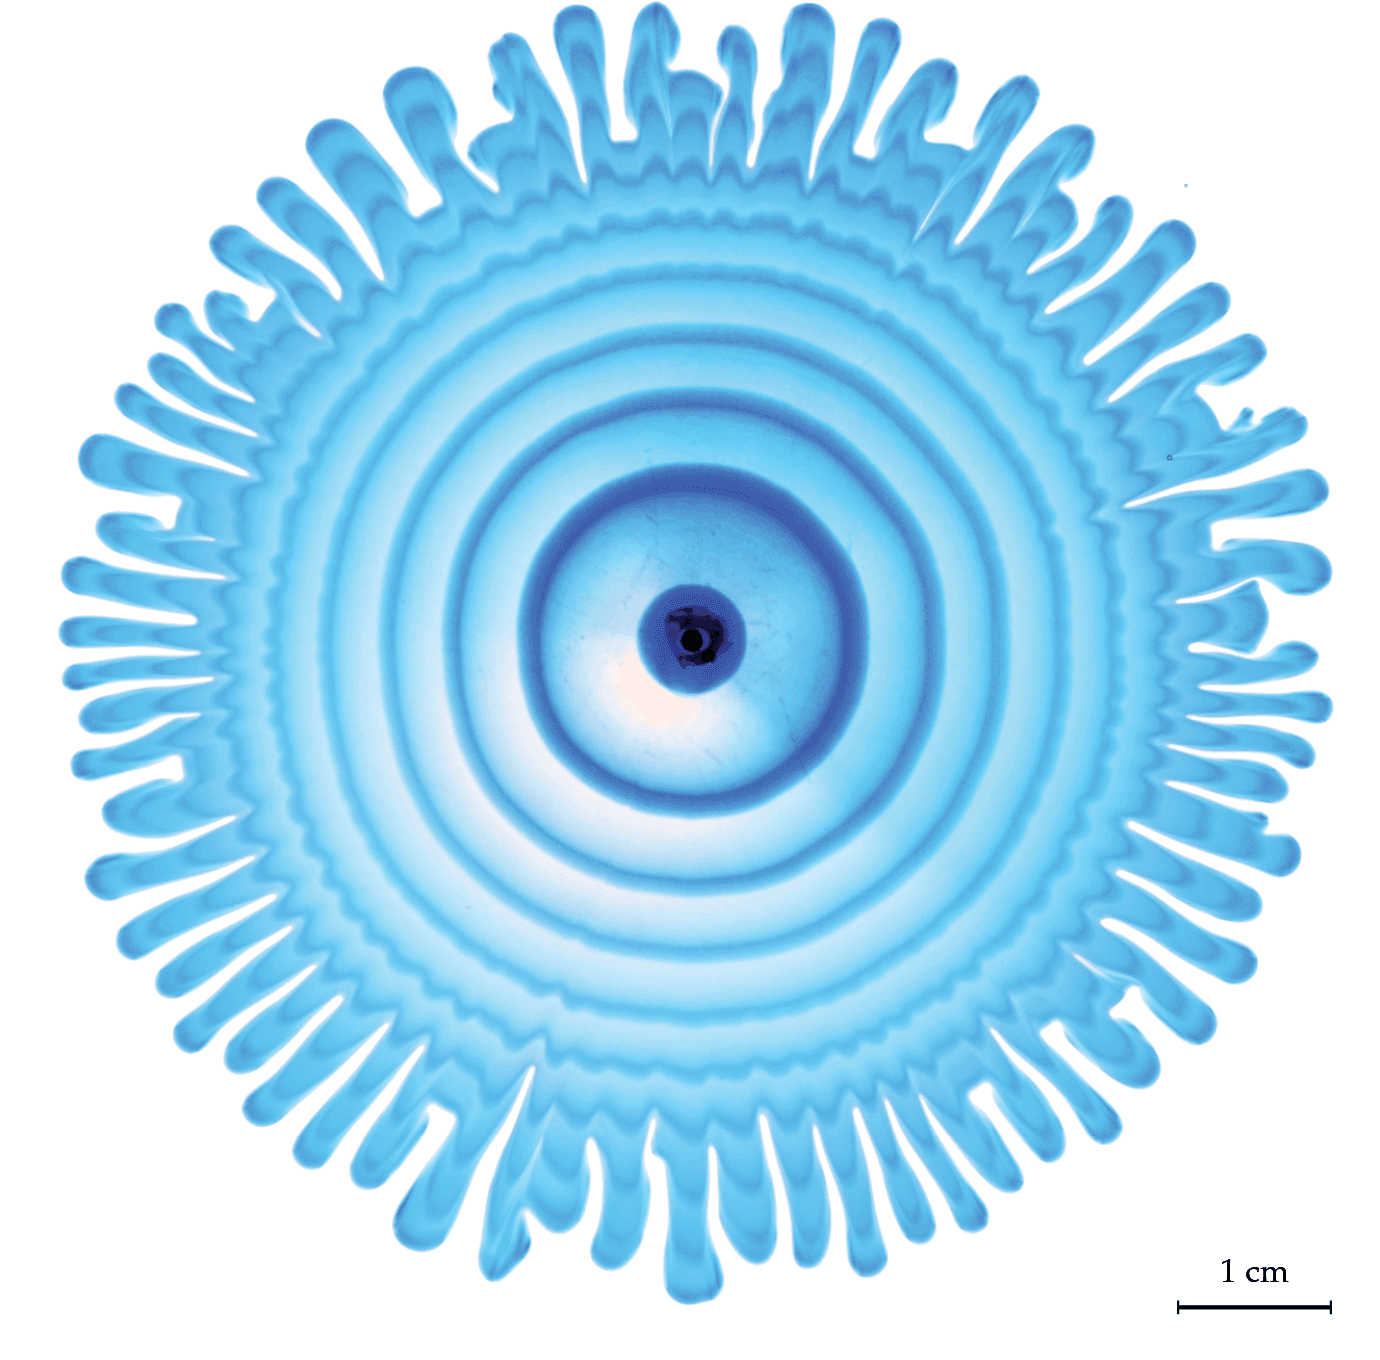
Nature is full of branching patterns: trees, lighting, rivers, and more. In fluid dynamics, our prototypical branching pattern is the Saffman-Taylor instability, created when a less viscous fluid is injected into a more viscous one in an confined space. Most attention in this problem has gone to the branching interface where the two fluids meet, but recently, a team has examined the flow away from the fingers by alternately injecting dyed and undyed fluid to visualize what goes on. That’s what we see here. Notice how the central dye rings, far from the branching fingers, still appear circular. Yet, even a few centimeters away from the fingers, the dye is starting to show ripples that correspond to the fingers. That’s an indication that the pressure gradient generated at the tips of the fingers is pretty far-reaching! (Image and research credit: S. Gowen et al.)


Gravity currents carry denser fluids into lighter ones, like cold air drifting under your door in winter or dense fogs flowing downhill in San Francisco. Here, researchers visualize the situation using denser salt water flowing into fresh water. Once the gate separating the two fluids rises, the salt water slides down an artificial slope into the fresh water.
Very quickly the flow forms a Kelvin-Helmholtz instability due to the different flow speeds between the two fluids. Kelvin-Helmholtz waves form distinctive swirls and billows that are reminiscent of a cat’s eye. As the swirls rotate, they can flow over one another, and break up into turbulence. (Image and video credit: C. Troy and J. Koseff)


 and with (right) a mask over the bell.")

Like so many other performers, the singers and musicians of New York’s Metropolitan Opera House were left without a way to safely perform when the SARS-CoV-2 pandemic began in early 2020. In search of safe ways to perform and rehearse, the Met turned to researchers at nearby Princeton University, who worked directly with the performers to explore aerosol production and airflow in the context of professional opera.
Through visualization and other experiments, the team found that the highly-controlled breathing of opera singers actually posed a lower risk for spreading pathogens than typical speaking and breathing. Most of a singer’s voiced sounds are sustained vowels, which produce a slow, buoyant jet that remains close to a singer. The exception are consonants, which created rapid, forward-projected jets.
In the orchestra, the researchers found that placing a mask over the bell of wind instruments like the trombone reduced the speed and spread of air. One of the highest risk instruments they found was the oboe. Playing the oboe requires a long, slow release of air, but between musical phrases, oboists rapidly exhale any remaining air from their lungs and take a fresh breath. That rapid exhale creates a fast, forceful jet of air that necessitates placing the oboist further from others. (Image credit: top – P. Chiabrando, others – P. Bourrianne et al.; research credit: P. Bourrianne et al.; via APS Physics; submitted by Kam-Yung Soh)


Experimentalists often need a sense for the overall flow before they can decide where to measure in greater detail. For such situations, flow visualization techniques are a powerful tool since they provide quick ways to see and compare flows.
Here, researchers paint a viscous oil atop their flying wing model and observe how the oil moves once the air flow starts up. This oil flow visualization shows the large-scale shifts in how air flows over the craft as the angle of attack increases. The disadvantage is that these techniques often give only a qualitative sense of the flow. But they can allow experimentalists to test many different conditions to decide which specific cases they should examine quantitatively. (Image and video credit: V. Kumar et al.)
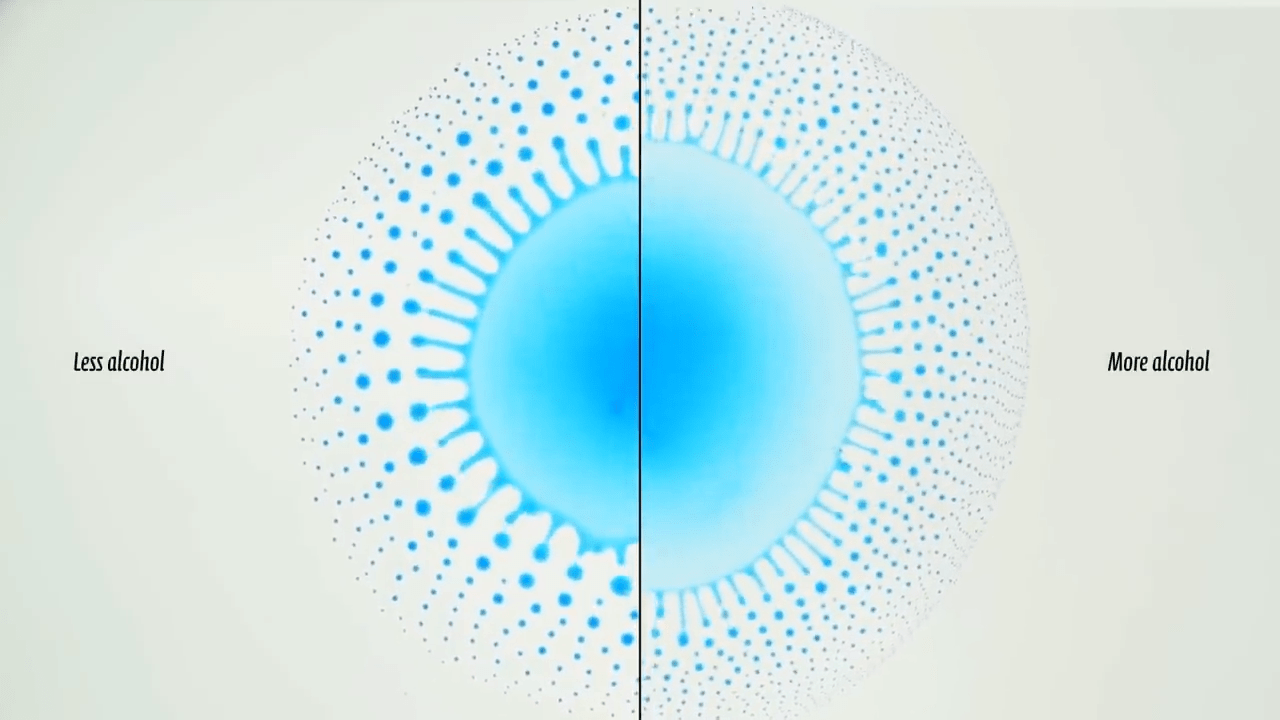
Adding dye to a flow is a common technique for visualization. After all, many flows in fluids like air and water are invisible to our bare eyes. But for some classes of flows — especially those driven by variations in surface tension — adding dye can have unforeseen effects. A recent study shows how true this is for bursting Marangoni droplets, where evaporation and alcohol concentration can pull a water-alcohol droplet apart.

Without dye, it’s nearly impossible to see the phenomenon since the refractive indices of the two component liquids are so close. But the researchers found that, as they added more methyl blue dye, it did more than increase the contrast in the flow. It changed the flow, making the droplets larger and creating ligaments between them. They believe that the dye’s own surface tension creates local gradients that alter the flow. It’s a reminder that experimentalists have to be careful to consider how our efforts to measure and observe a flow can change it. (Image credit: top – The Lutetium Project, bottom – C. Seyfert and A. Marin with modification; research credit: C. Seyfert and A. Marin)

 flow and those reconstructed by the algorithm (learned).")
Fluid dynamicists have long used flow visualization methods to get a qualitative sense for flows, but it’s rare to derive much quantitative data from this imagery. But that may soon change thanks to a new computational technique, called Hidden Fluid Mechanics, that uses data from flow visualizations combined with physics-informed neural networks to derive the underlying velocities and pressures in a flow.
The technique relies on two important ideas. One is that the dye, smoke, or other method of visualizing the flow does not alter the underlying flow; it’s just something carried along by the fluid. In other words, the flow behaves exactly the same whether or not you inserted dye or smoke.
The second key idea is that the Navier-Stokes equations — which are derived from conservation of mass, momentum, and energy — accurately describe the physics of a flow. That assumption is critical to the technique since it uses those equations to constrain the flow fields the algorithm reconstructs.
So here, roughly speaking, is what the algorithm actually does: researchers feed it concentration data from a flow visualization — essentially how much smoke or dye is present at every point in space and time — and the neural network reconstructs, based on the Navier-Stokes equations, what velocity and pressure field would produce that concentration data.
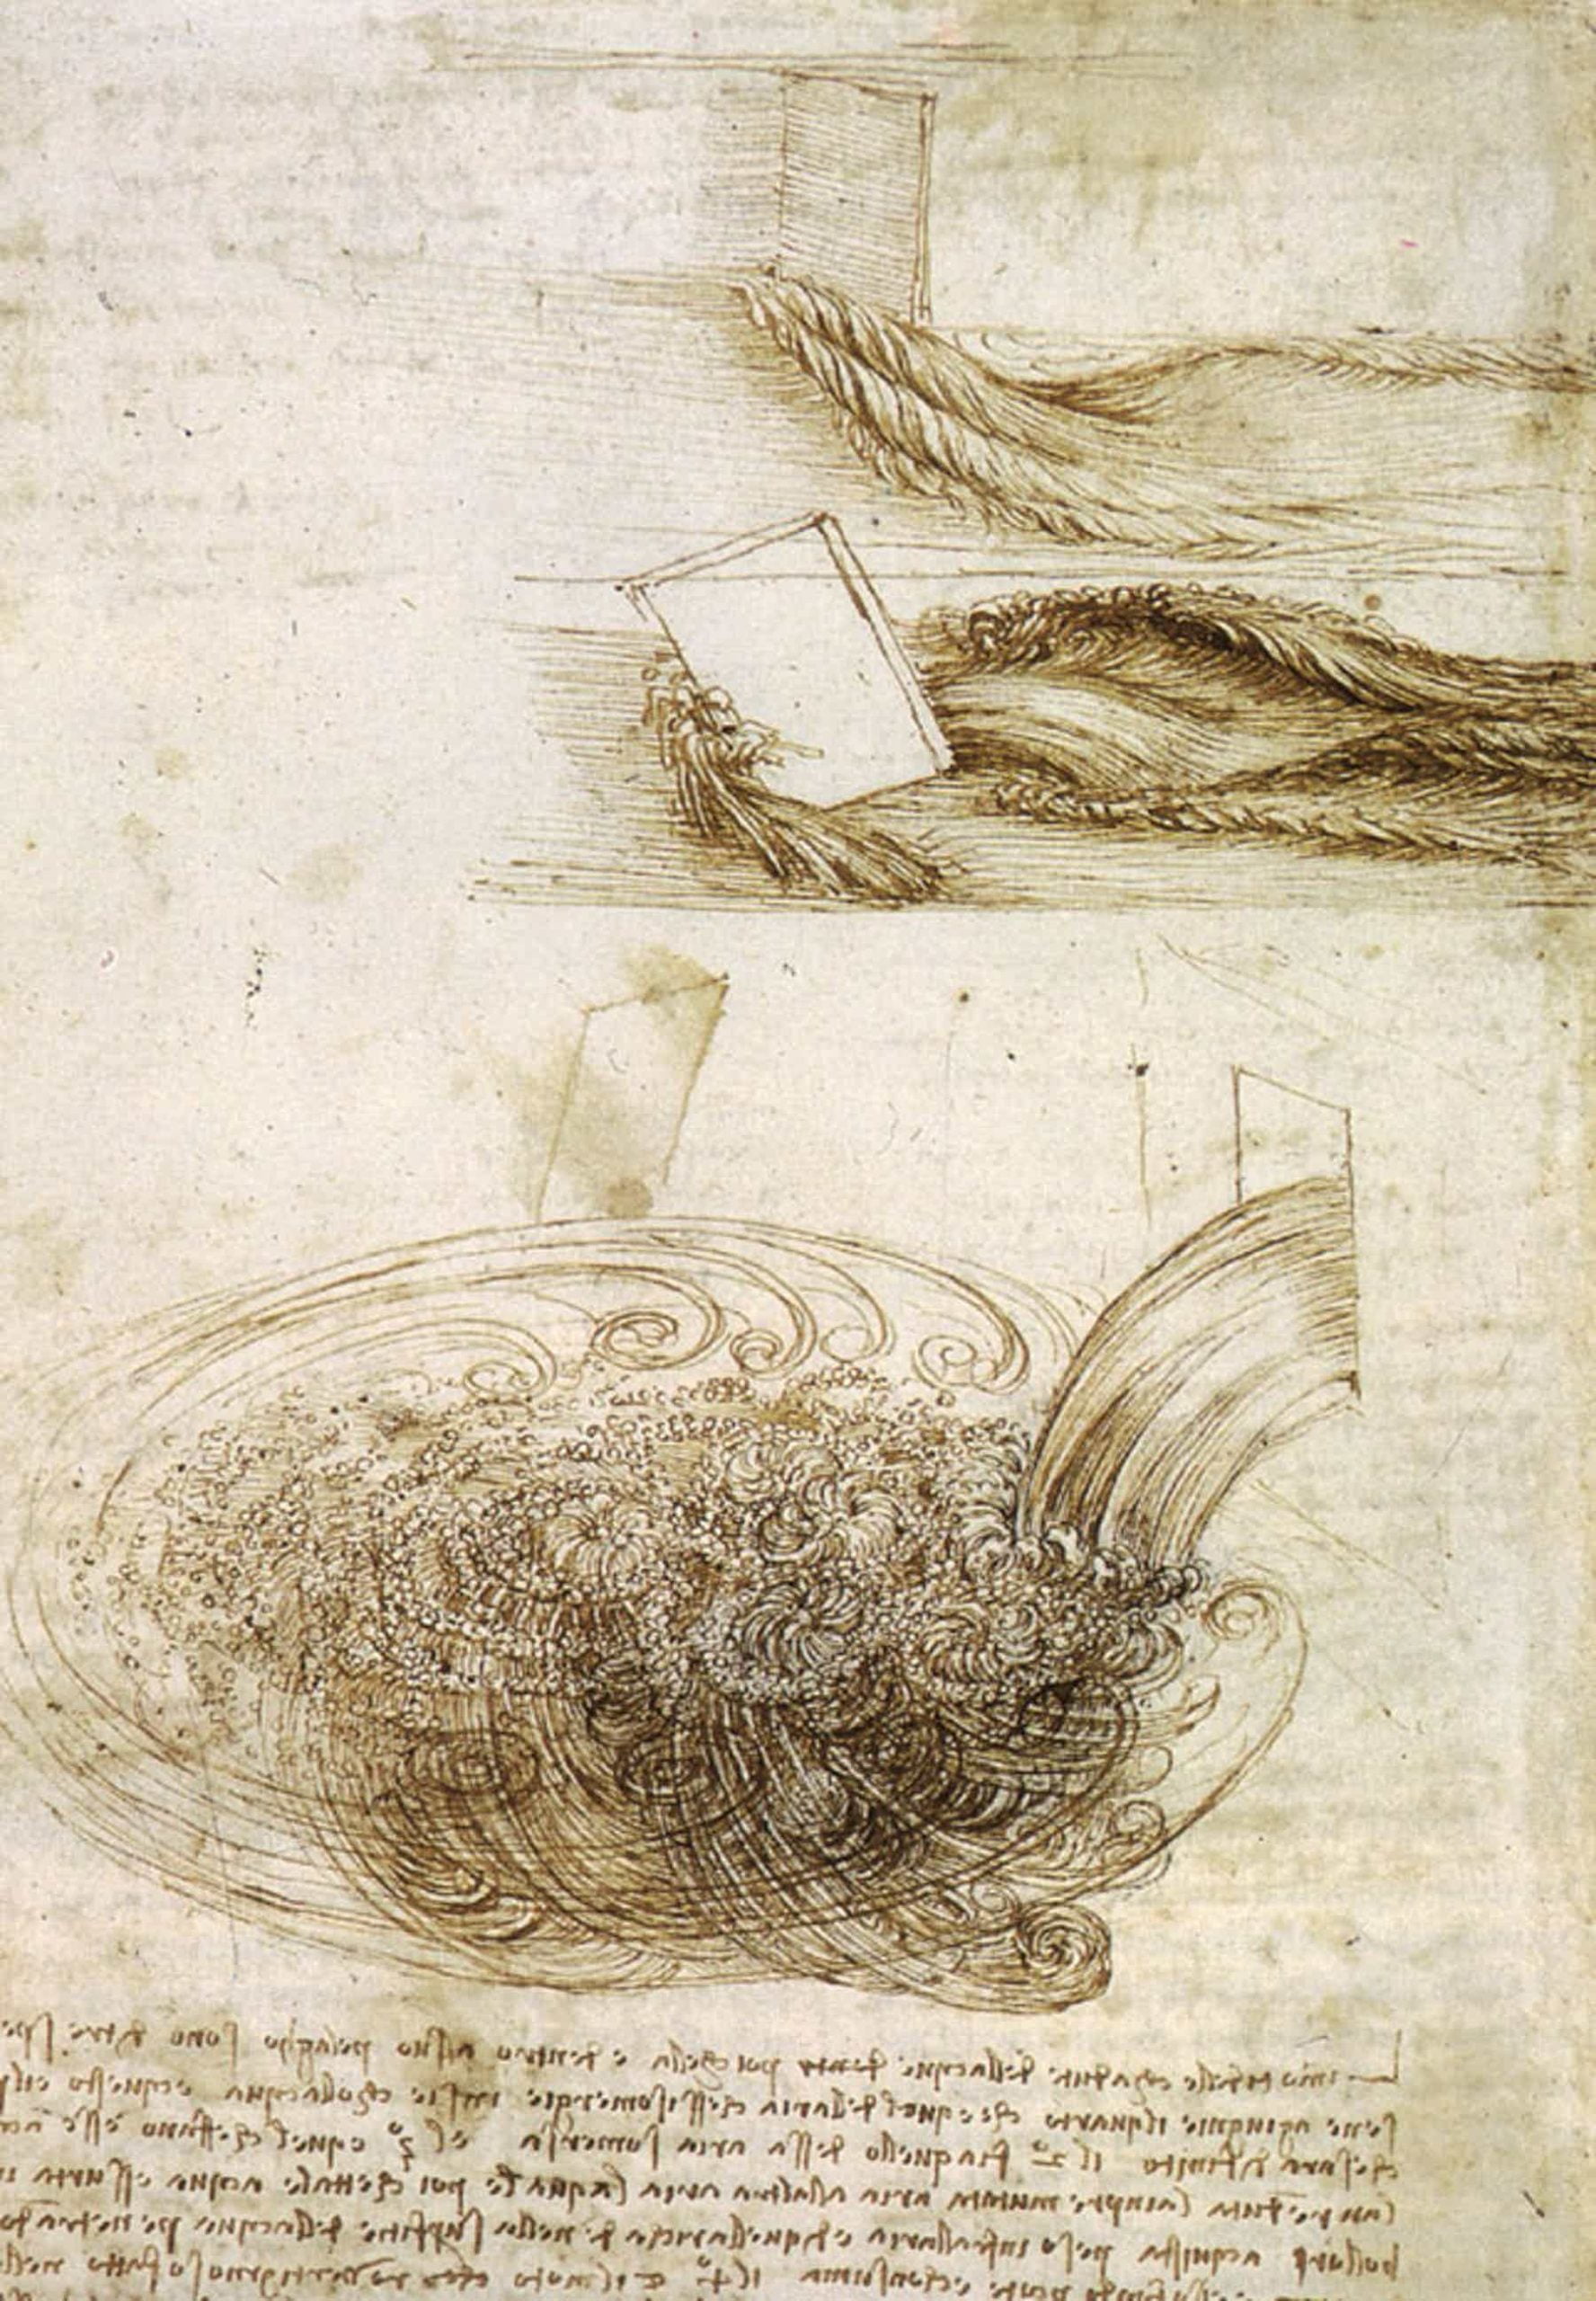
The researchers demonstrate the capabilities of their algorithm by comparing its results to flows where all the information is known. The first image in the gallery above shows concentration data for the flow in an aneurysm. The full flow field is known already from a numerical simulation, but the researchers gave their new algorithm only the concentration data. From that, it reconstructed the streamlines for the aneurysm’s flow, shown in the second image as “Learned”. The “Exact” streamlines on the left are taken from the original numerical simulation data. As you can see, the results are remarkably similar. (Image credit: drawings – L. da Vinci, others – M. Raissi et al.; research credit: M. Raissi et al.; submitted by Stuart H.)

Even in an era of supercomputers, there is a place for quick and dirty methods of flow visualization. Here we see a model of a swept wing like those seen on many commercial airliners. It was painted with a layer of fluorescent oil, then placed in a wind tunnel and subjected to flow. As air blows across the model, it moves the oil, leaving behind streaks that show how air near the surface moves.
We can see, for example, that near the fuselage, the air flows mostly front to back across the wing. That’s what we expect, especially for a wing generating lift. But further out on the wing, the flow moves mostly along the wing, not across it. There’s also a distinctive line running just a short ways behind the leading edge on this outer section of wing. It looks as though air flowing over the wing separated at this point, leaving disordered and unhelpful flow behind. It’s likely that the model was tested at an angle of attack where the outer section of the wing was beginning to stall. (Image credit: ARA)