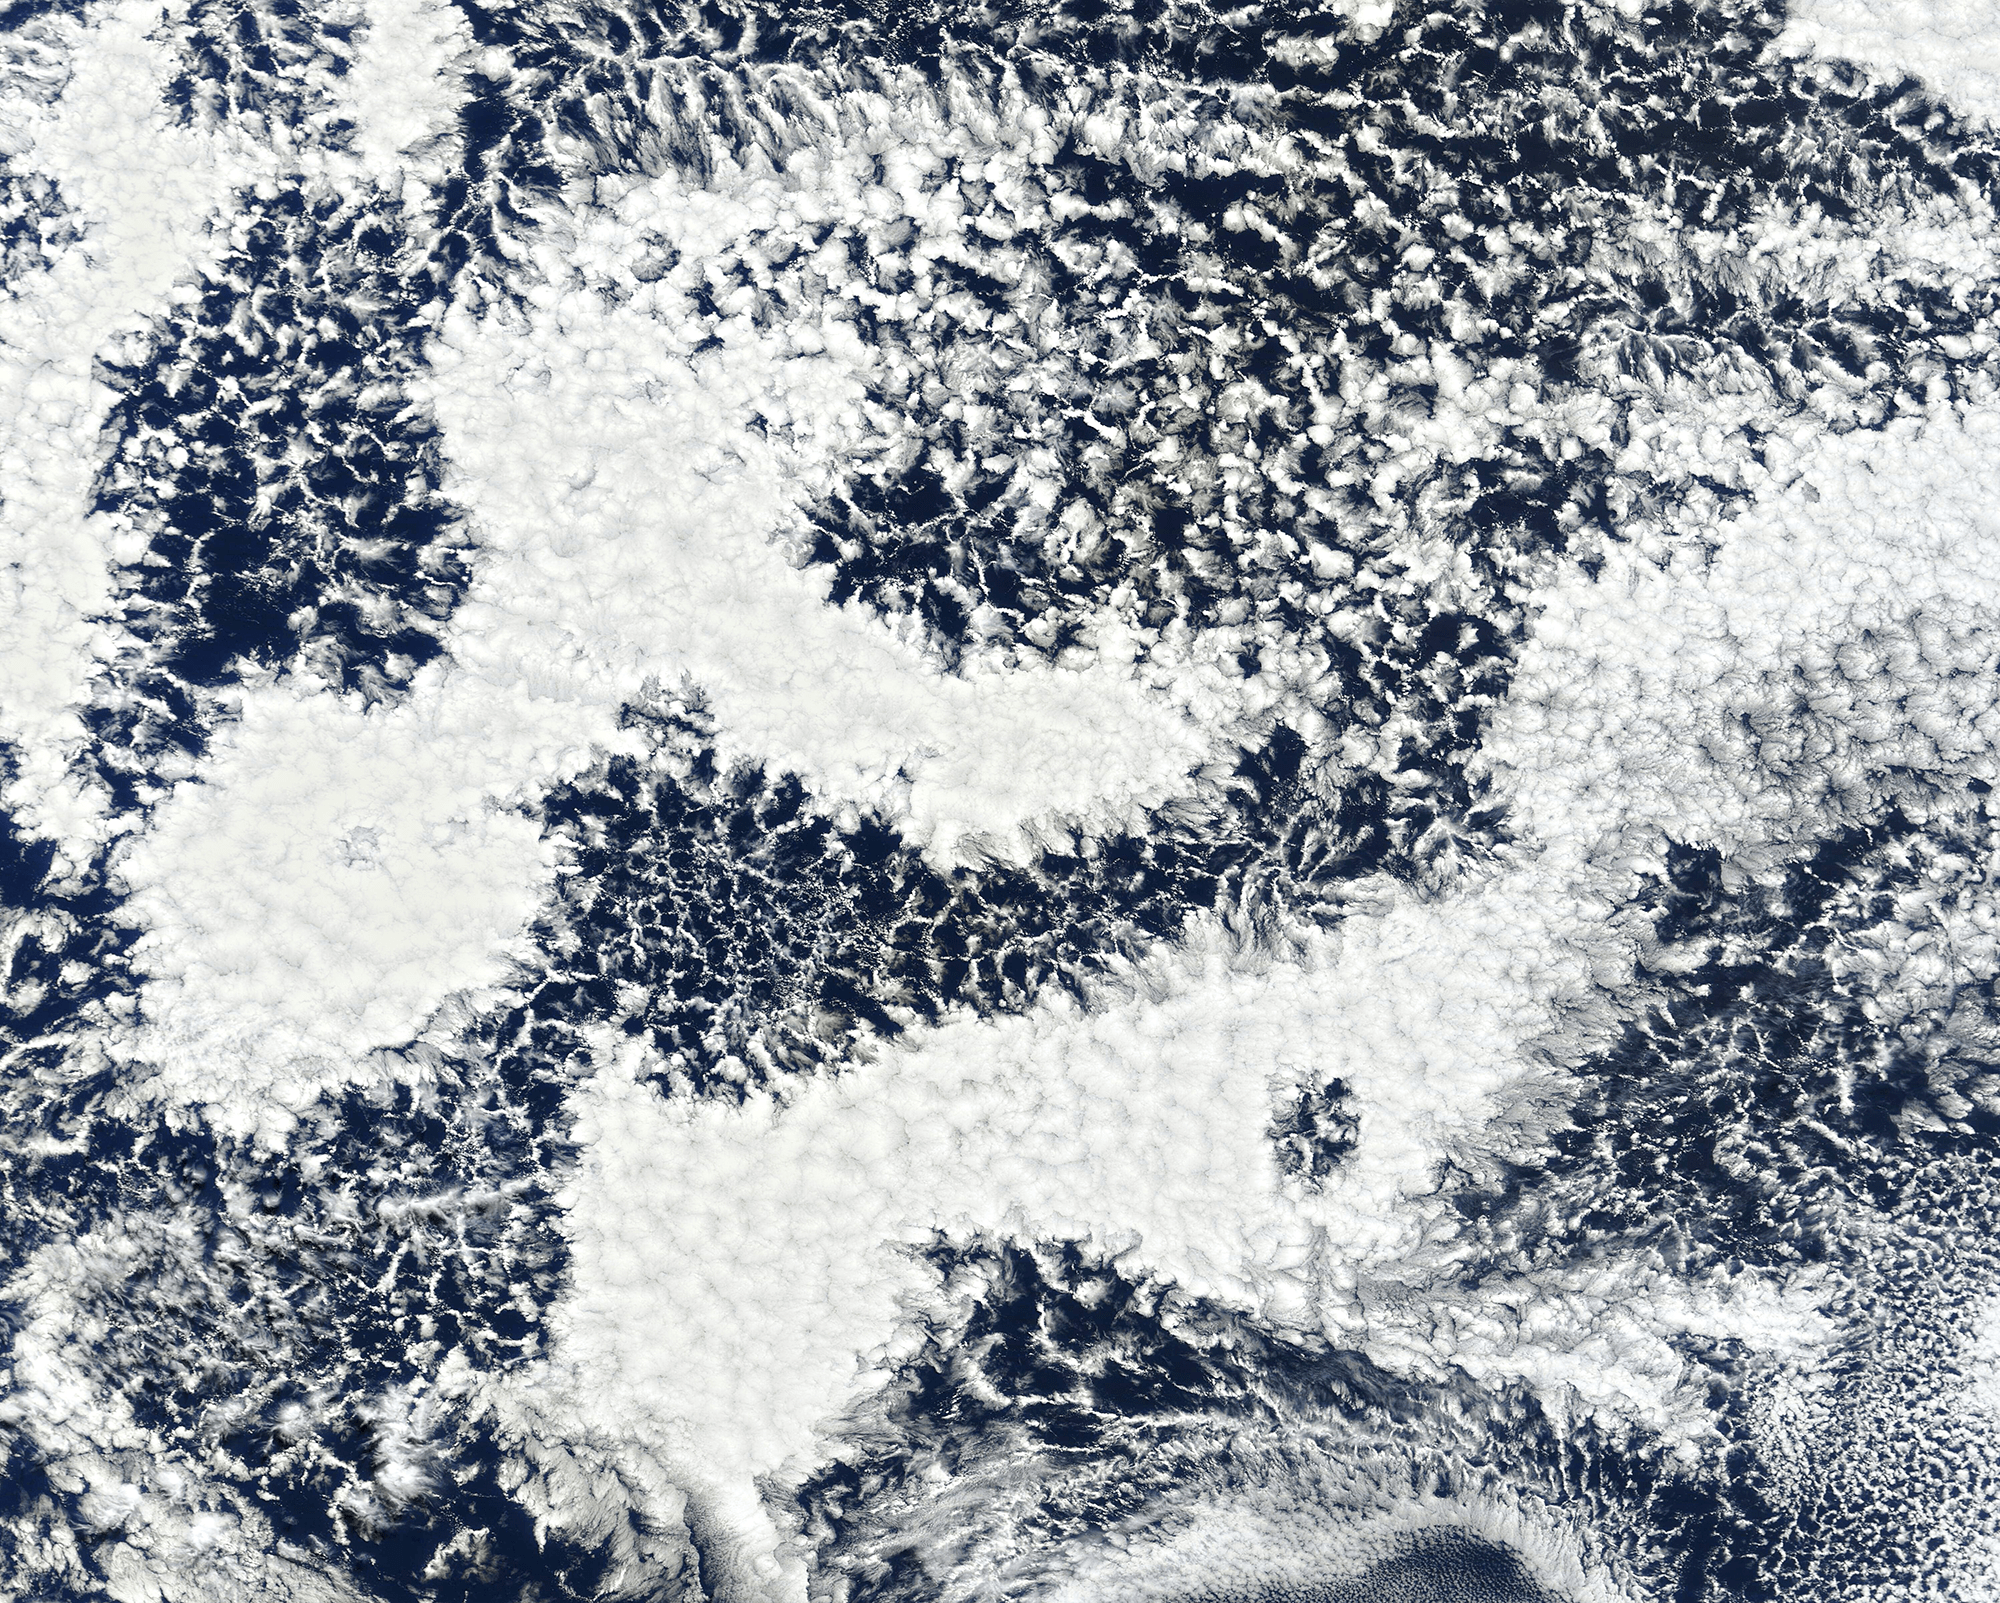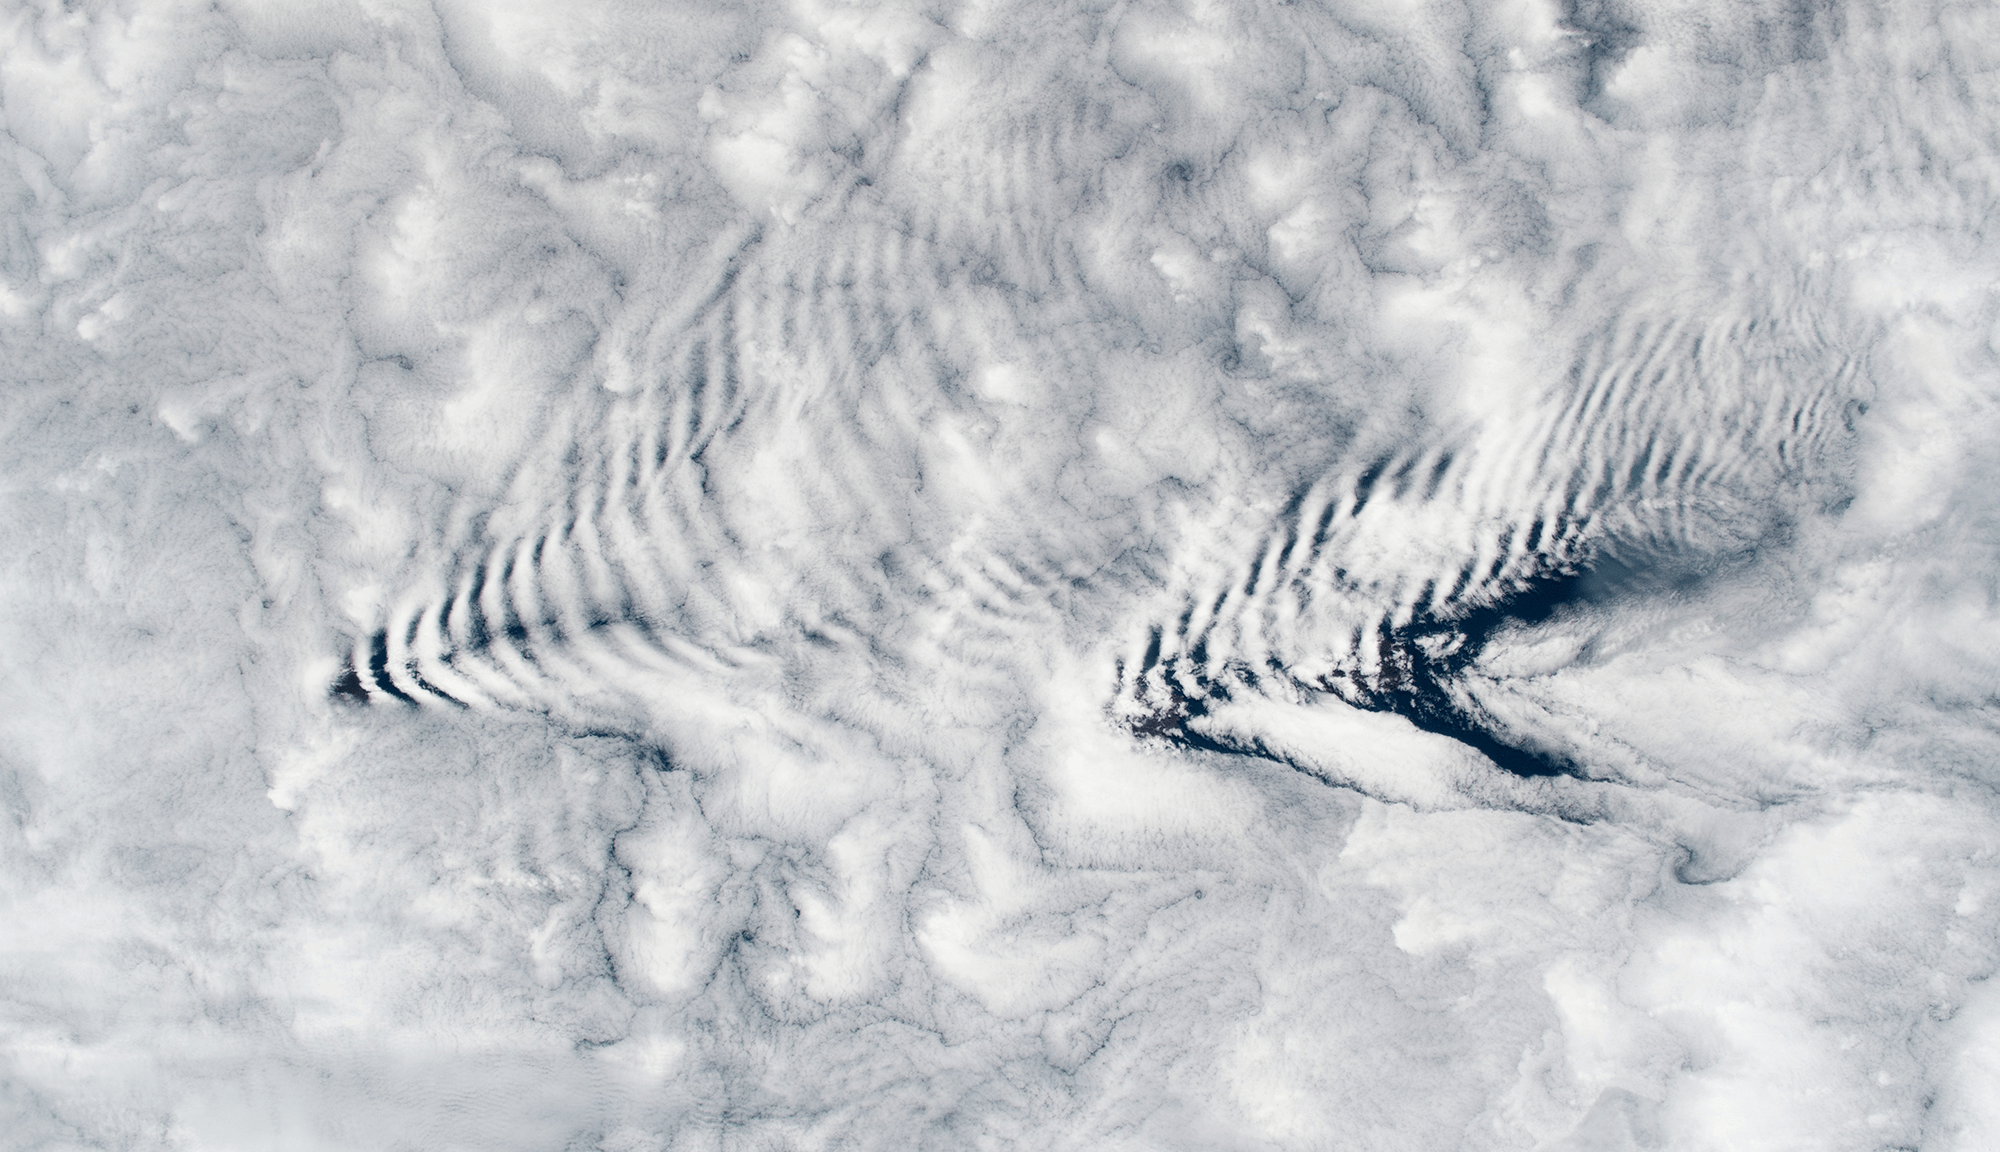
An astronaut snapped this image of wave clouds formed around the Crozet Islands, which lie between South Africa and Antarctica. Clouds like these form when warm, moist air gets pushed up and over a mountain. As it rises, the air cools and its pressure decreases, causing condensation. Pushed out of equilibrium, gravity then pulls the air back downward in the wake of the mountain. That warms the air, causing evaporation. Like a mass bouncing on a spring, the air continues to yo-yo up and down, forming cloudy stripes and clear ones until the energy from its mountain climb is spent. (Image credit: NASA; via NASA Earth Observatory)
Tag: satellite image

A Sea of Pollen
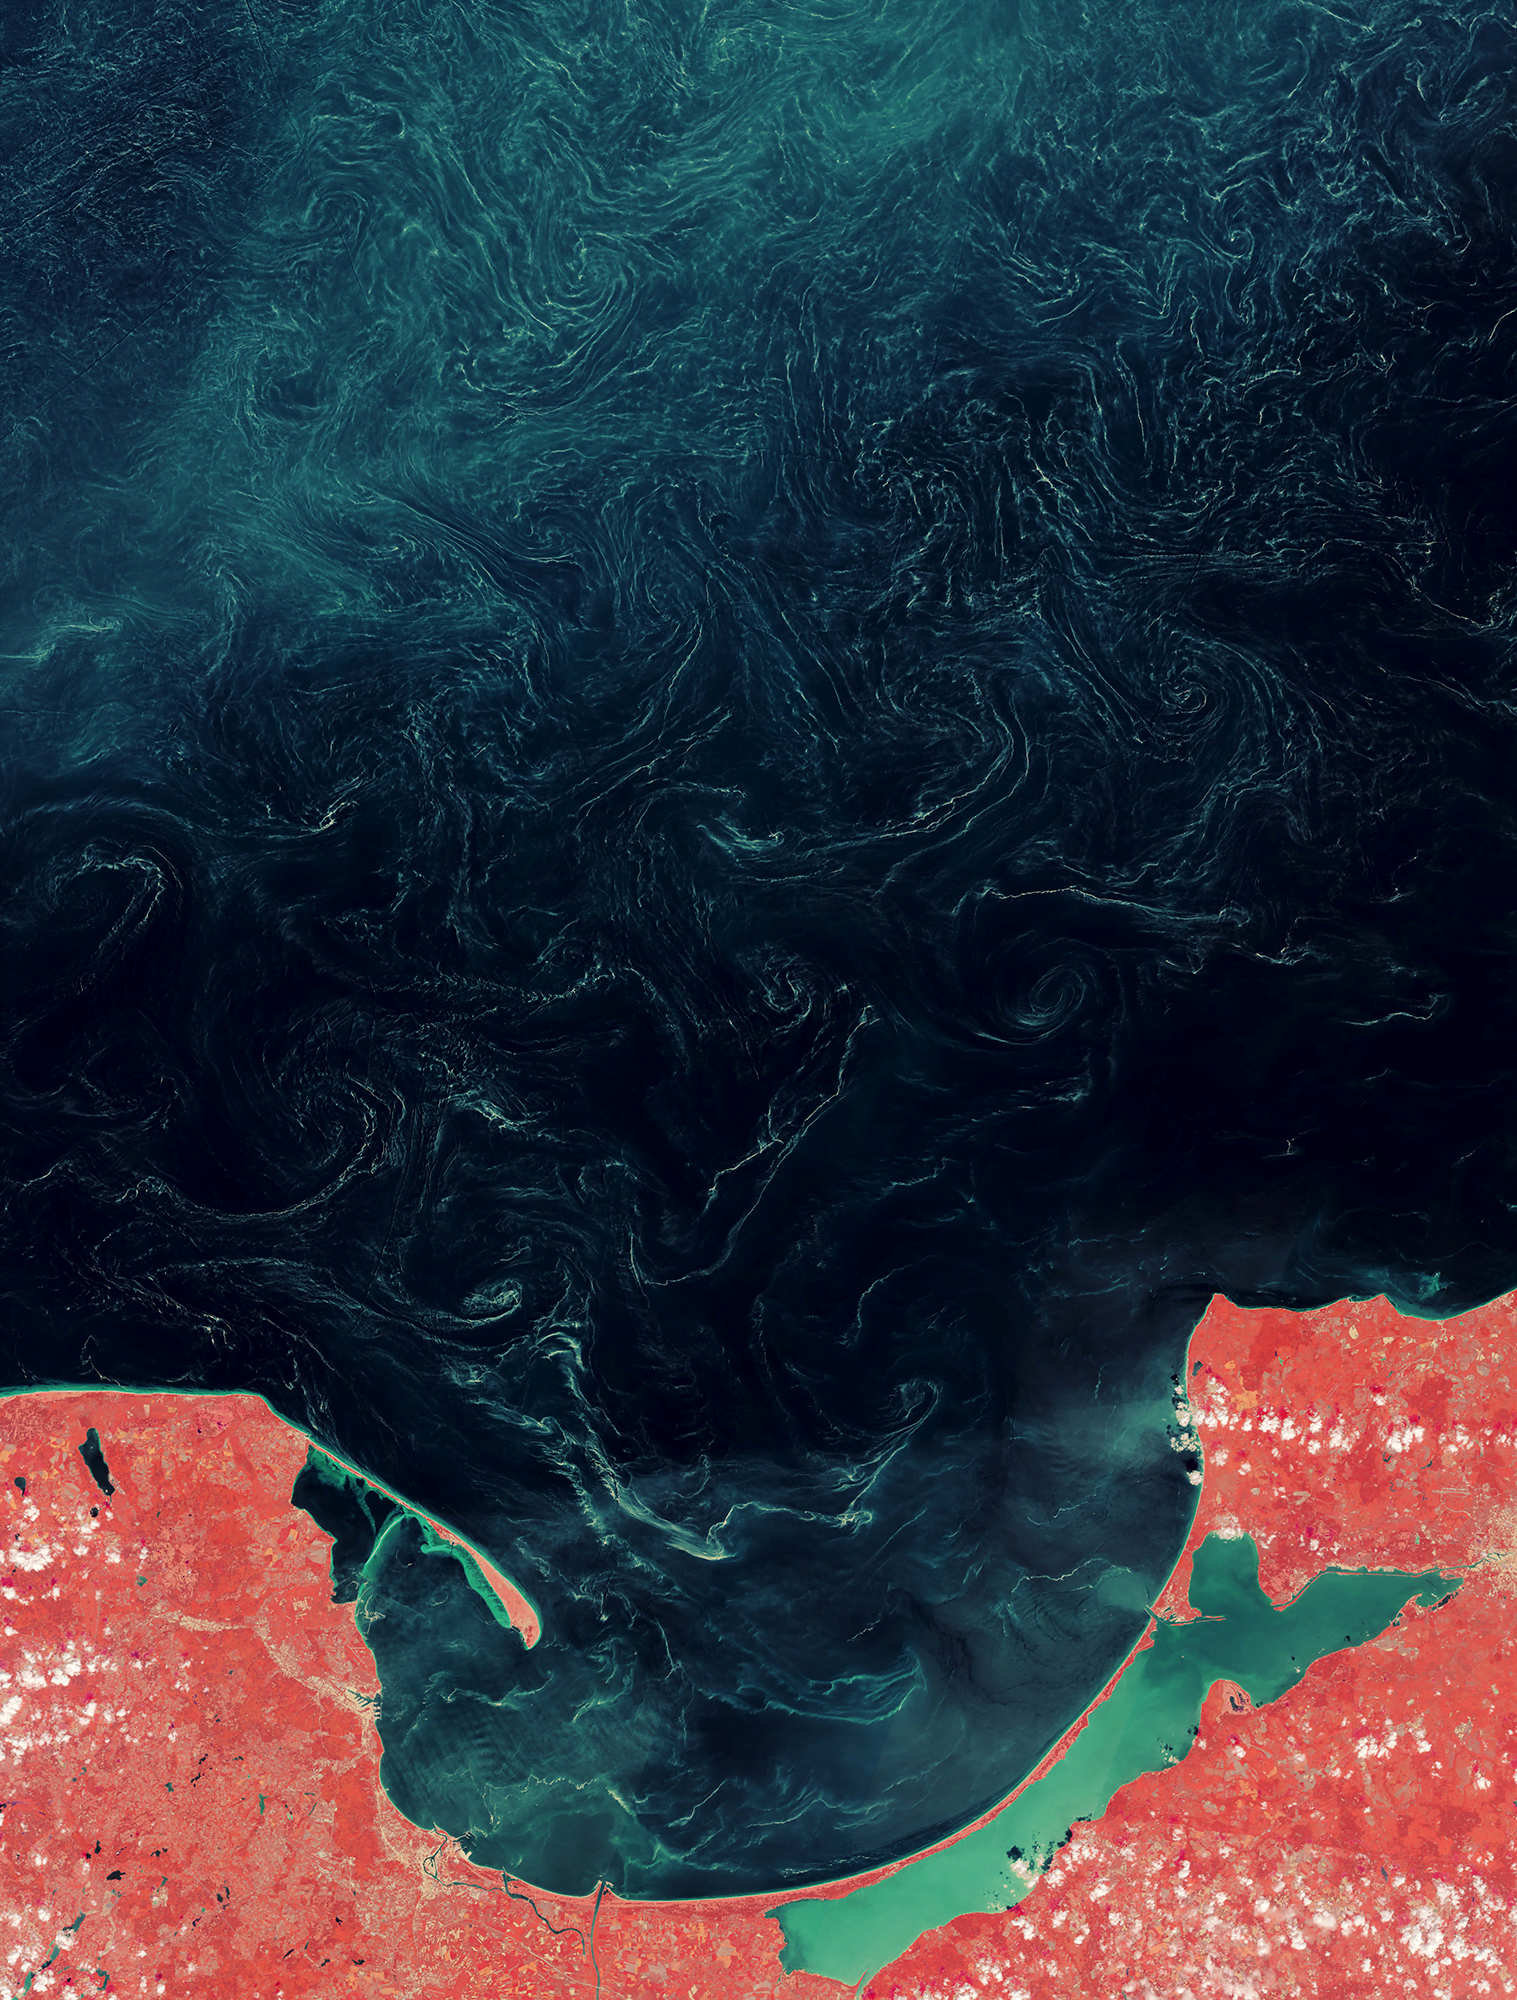
Fellow allergy sufferers, beware! This false-color satellite image of the Baltic Sea shows massive slicks made up of pine pollen. I don’t know about you, but the mere thought of enough pollen that it’s visible from space makes me want to double — triple?! — my antihistamines. The swirling patterns in the pollen come from wind-driven currents and waves moving the pollen on the surface of the water.
It took some sleuthing for scientists to identify these slicks as pollen rather than bacteria or plankton. But by combining experimental results, ground-based observations, and satellite image processing, scientists discovered that the pine pollen has a particular spectral signature. Using that, the team could trawl through older satellite imagery and locate pine pollen in previous seasons. They identified pine pollen slicks in 14 of the last 20 springs. The size of the slicks is growing over time, too, consistent with other observations of longer pollinating seasons. (Image credit: L. Dauphin; via NASA Earth Observatory)

Stirring Up Sediment
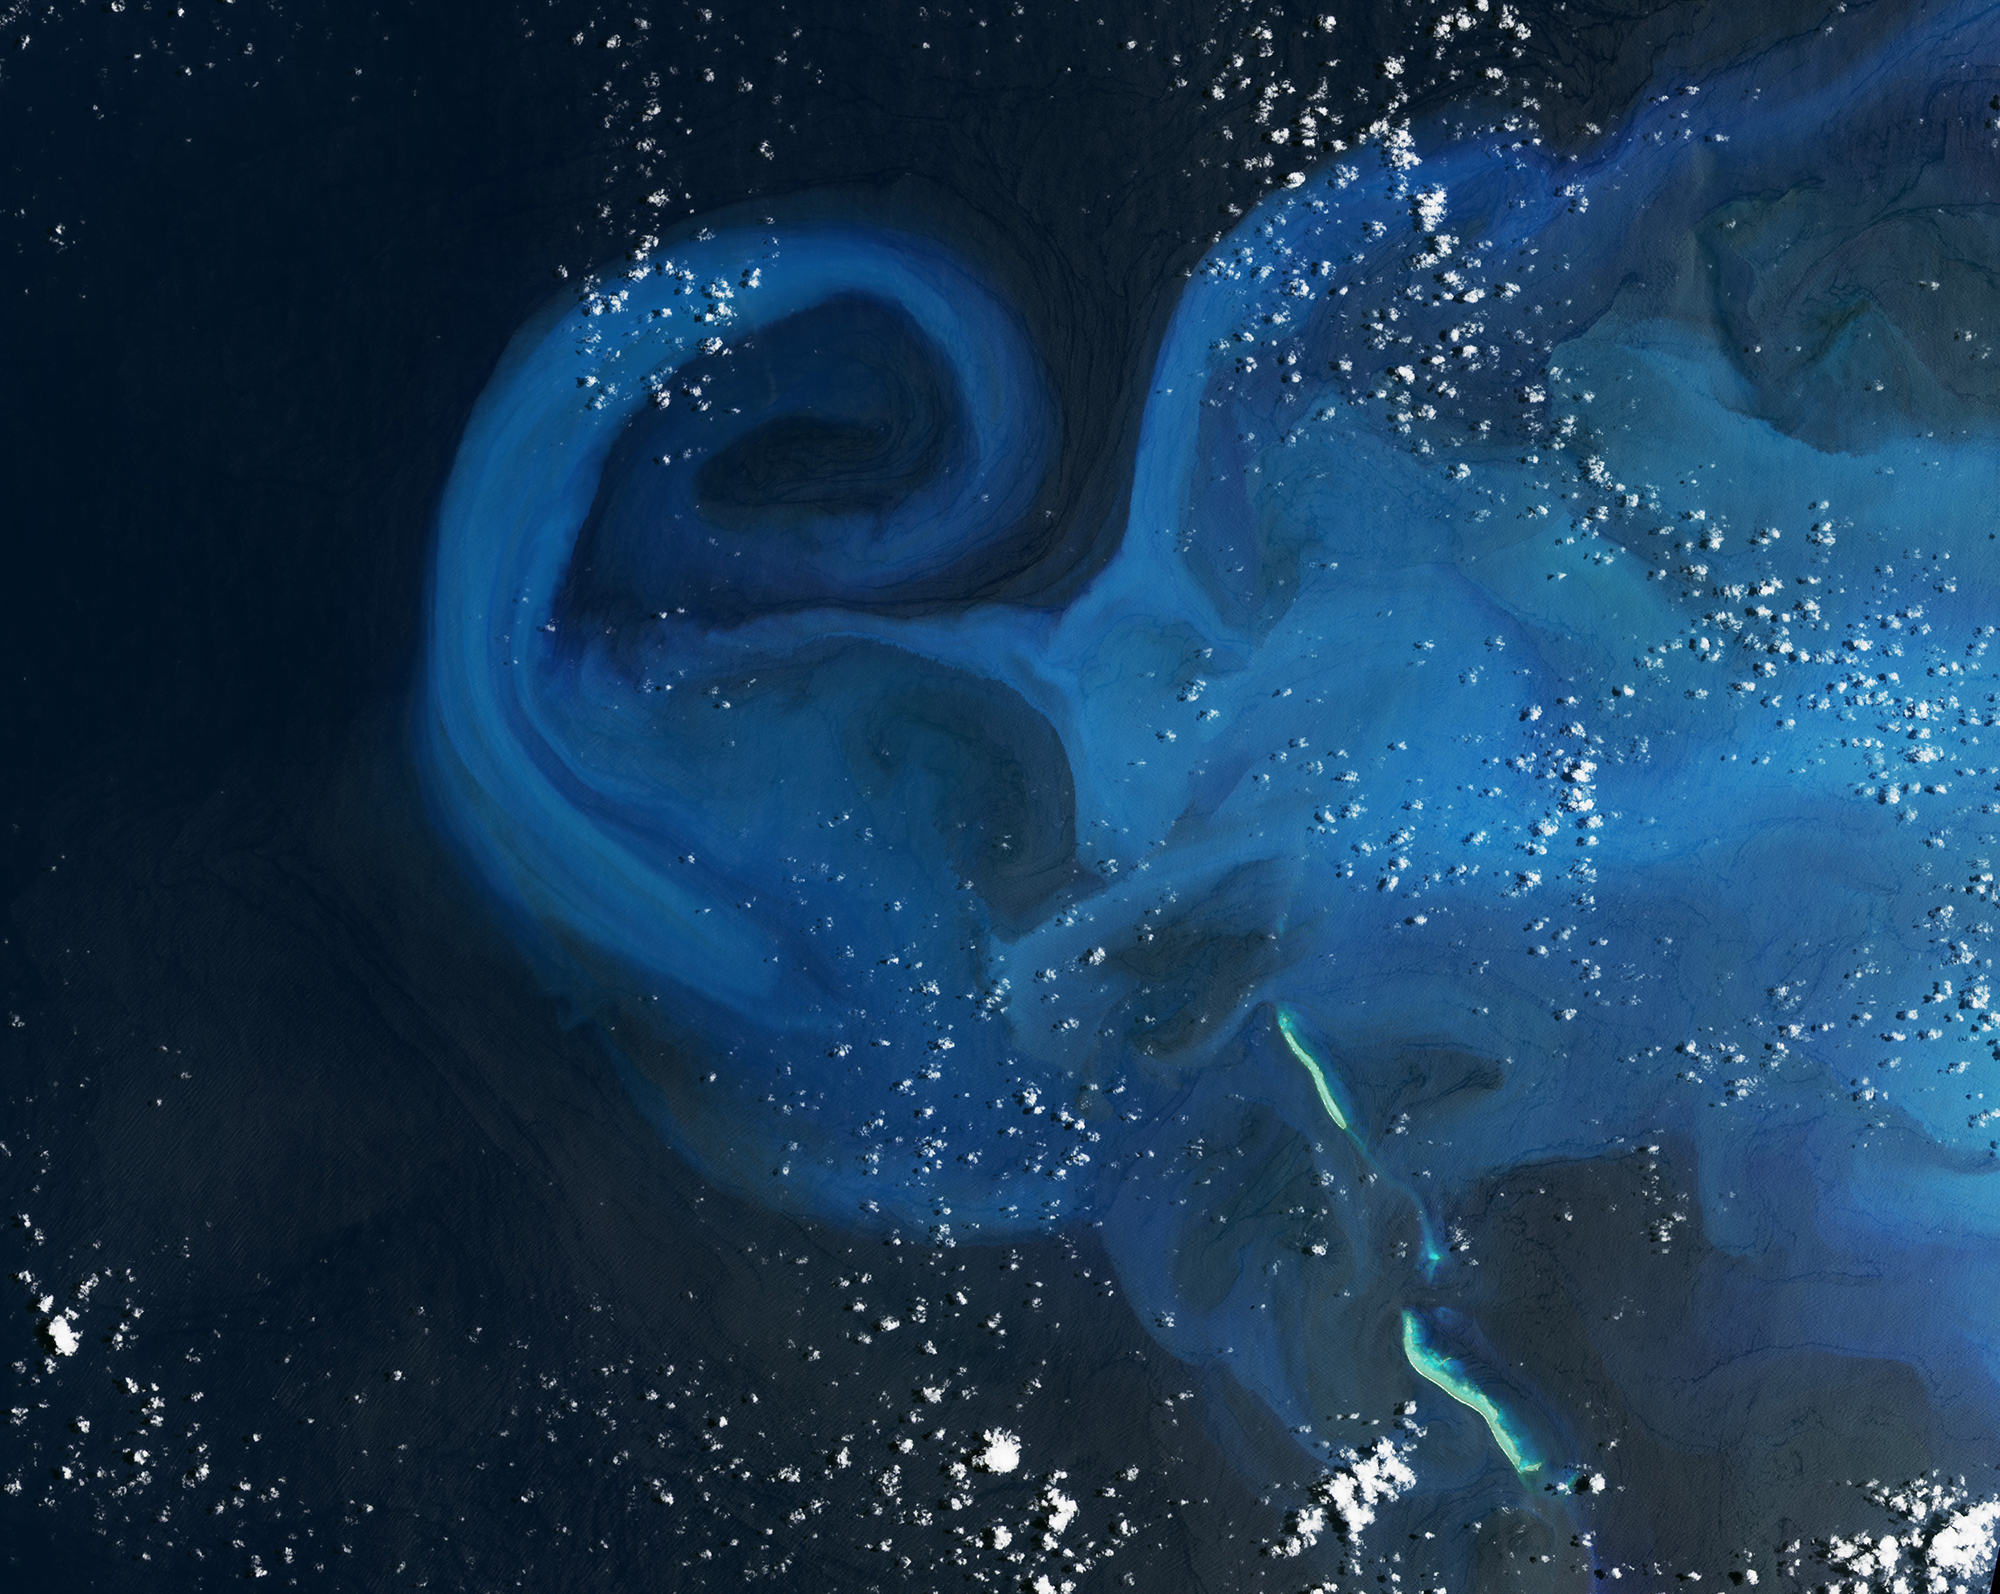
In early February, Tropical Cyclone Gabrielle passed over the Bellona Plateau in the Coral Sea, stirring up sediment from the shallow reefs there. Once the storm cleared, large swirls of carbonate sediment mixed into the deeper waters around the plateau. As the sediment sinks to depths of kilometers, it will dissolve into the deep ocean waters, eventually getting captured as part of sedimentary rocks. This is a critical step in the ocean’s carbon capture cycle.
Unfortunately, climate change is disrupting the ocean’s ability to capture carbon. An excess of carbon dioxide acidifies ocean waters, making it harder for creatures like corals and crabs to incorporate carbon into their bodies. That reduces sources for carbonate sediments like those seen here. Changes in ocean chemistry also affect where and how much carbonate can get dissolved. In short, ocean carbon capture has been an important process for Earth’s carbon cycle in the past, but the process is a slow one, and human activity has overloaded the ocean’s system in ways we don’t fully understand. (Image credit: A. Nussbaum; via NASA Earth Observatory)

Finding the Red in the Red Tide
Blooms of the algae Karenia brevis — known as a red tide — bring havoc to Gulf Coast shores. The algae can kill fish and other marine life, and it causes skin irritation and even respiratory problems for humans. But in spite of the moniker, these algae can be hard to spot; they can add a green, brown, red, or black hue to the water.
The false-color image above uses a new image processing technique that reveals the bloom. Using satellite images taken over multiple days, scientists can track and study the red tide in unprecedented detail. The new technique will be a boon to those trying to monitor and understand red tides. (Image credit: Y. Yao/USF/Planet Labs/L. Dauphin; via NASA Earth Observatory)

Cellular Clouds
Though tough to make out from the surface, our oceans are often covered by cell-shaped clouds stretching thousands of kilometers. This satellite image shows off two such types of marine stratocumulus cloud. Open-celled clouds appear as thin wisps of vapor around an empty middle; in these clouds, cool air sinks through the center while warm air rises along the edges. Open-celled clouds are good rain producers.
On the flip side, closed-cell clouds have a vapor-filled center and breaks in the cloud cover along each cell’s edge. These clouds don’t produce much rain, but they do lift warm, moist air through their middles and let cool air sink along their edges. Closed-cell clouds tend to last much longer than their open-celled counterparts; they can stick around for half a day, whereas open-celled clouds break up in only a couple hours. (Image credit: J. Stevens; via NASA Earth Observatory)

Submarine Volcano
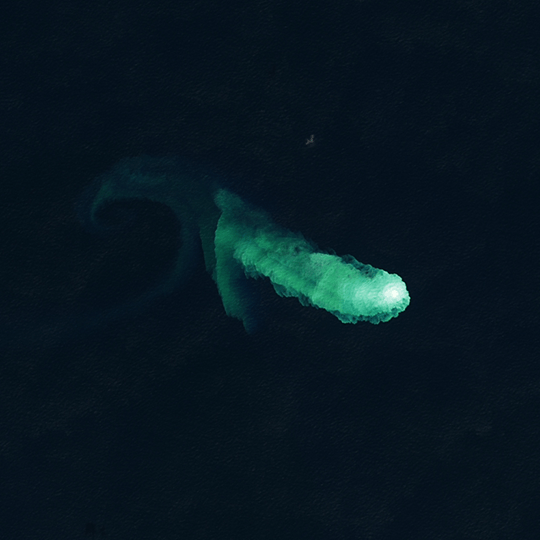
This pale green plume signals the activities of Kaitoku, an underwater seamount near Japan. Periodic activity picked up there in August 2022 and continued into the new year. The rising plume likely consists of superheated acidic seawater mixed with particulates, sulfur, and rock fragments. Underwater volcanoes like this one are thought to account for up to 80 percent of our planet’s volcanic activity. (Image credit: L. Dauphin; via NASA Earth Observatory)

Sedimentation After Flooding
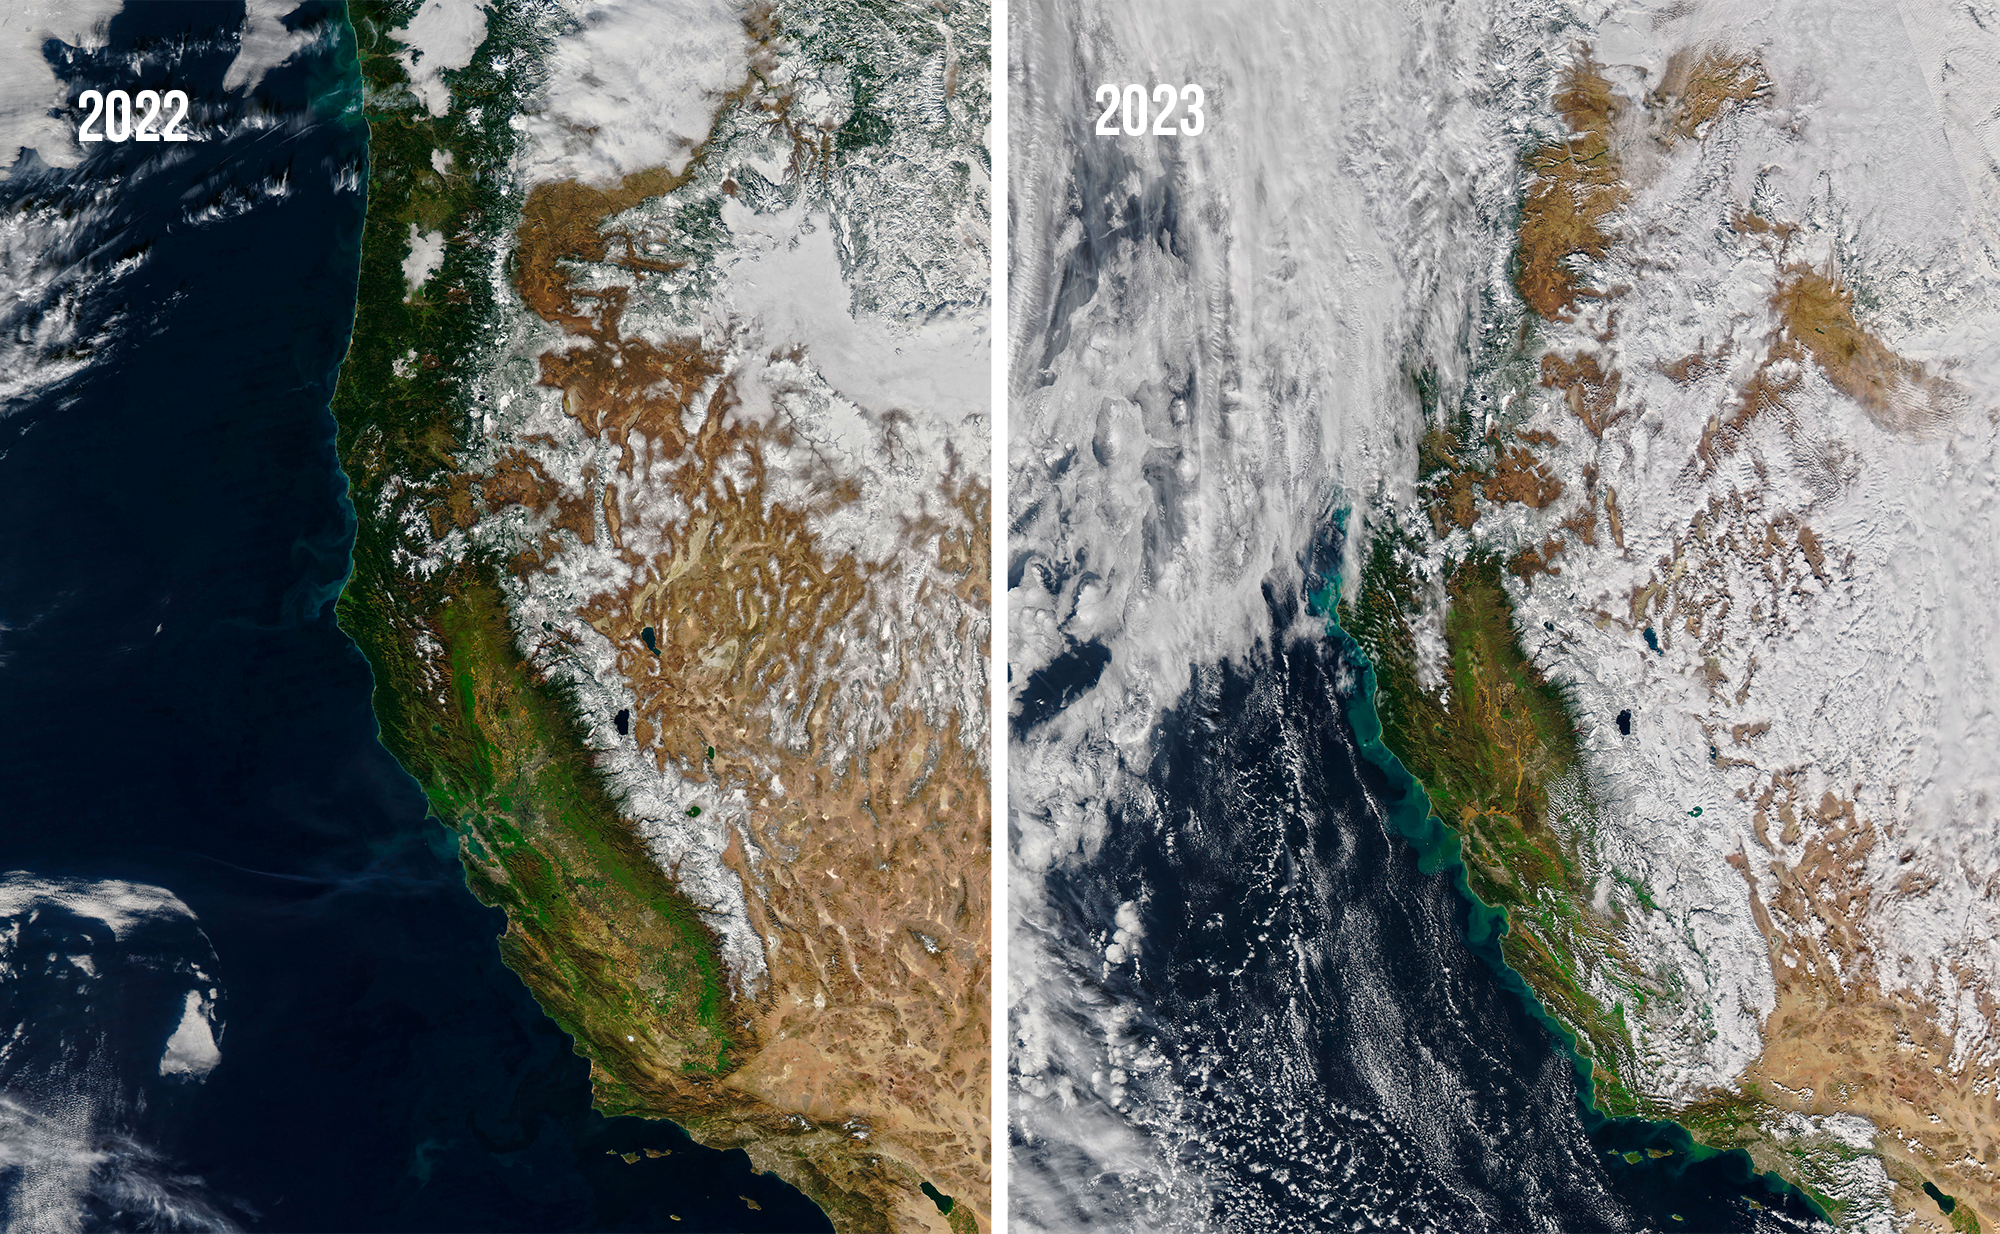
The new year brought California a series of atmospheric rivers that poured record amounts of water onto drought-stricken lands. While the precipitation refreshed snowpacks and reservoirs, much of it washed away as soils oversaturated. Those flows carried sediment with them, creating swirls of brown and green along the coastline.
Compare the two satellite images above to see how different January 2022 looked from January 2023, post-deluge. The snow levels in January 2023 were about 248 percent of their average level for that part of the season. But the sediment levels in the ocean are also drastically increased, indicating high levels of erosion. (Image credit: J. Stevens; via NASA Earth Observatory)

Where Fresh and Salty Meet
Waterways twist through the wetlands of Adair Bay in this astronaut-captured image of northwestern Mexico. The estuary marks the transition between the Great Altar Desert and the Gulf of California. Fresh and salt water mix in the sediment-rich waterways. Mangroves and other salt-tolerant vegetation flourish in the coastal marsh. During low tides, evaporating water leaves behind salt flats, seen here in gray and white. High tides flood the area with nutrients that support both the vegetation and abundant aquatic life. (Image credit: NASA; via NASA Earth Observatory)

Vietnam’s Emerald Isles
Vietnam’s Hạ Long Bay is home to more than 1,600 islands, many of them made up of mountainous limestone. The area is famous for its karst features, a type of terrain formed from highly porous, water-soluble rock. Over time, water dissolves and fractures the limestone, creating karst landscapes full of caves, springs, sinkholes, and fluted rock outcroppings. The area’s erosion also produces highly fertile soil, leading to a verdant ecosystem with many unique and endemic species. (Image credit: N. Kuring/NASA/USGS; via NASA Earth Observatory)

Summer Melt
A warm summer in 2022 has resulted in record melting on Svalbard. Located halfway between the Norwegian mainland and the North Pole, more than half of Svalbard is normally covered in ice. But with glaciers in retreat and firn — a surface layer of compressed porous snow — melting, pale blue ice is getting direct exposure to the sun and warm air temperatures. The result has been melting 3.5 times larger than the average melt between 1981 and 2010. Look closely and you’ll find deep blue meltwater ponds dotting the ice, too. The run-off of meltwater has likely carried extra sediment into the surrounding waters, accounting for some of the paler water colors along the coast. (Image credit: J. Stevens/USGS; via NASA Earth Observatory)