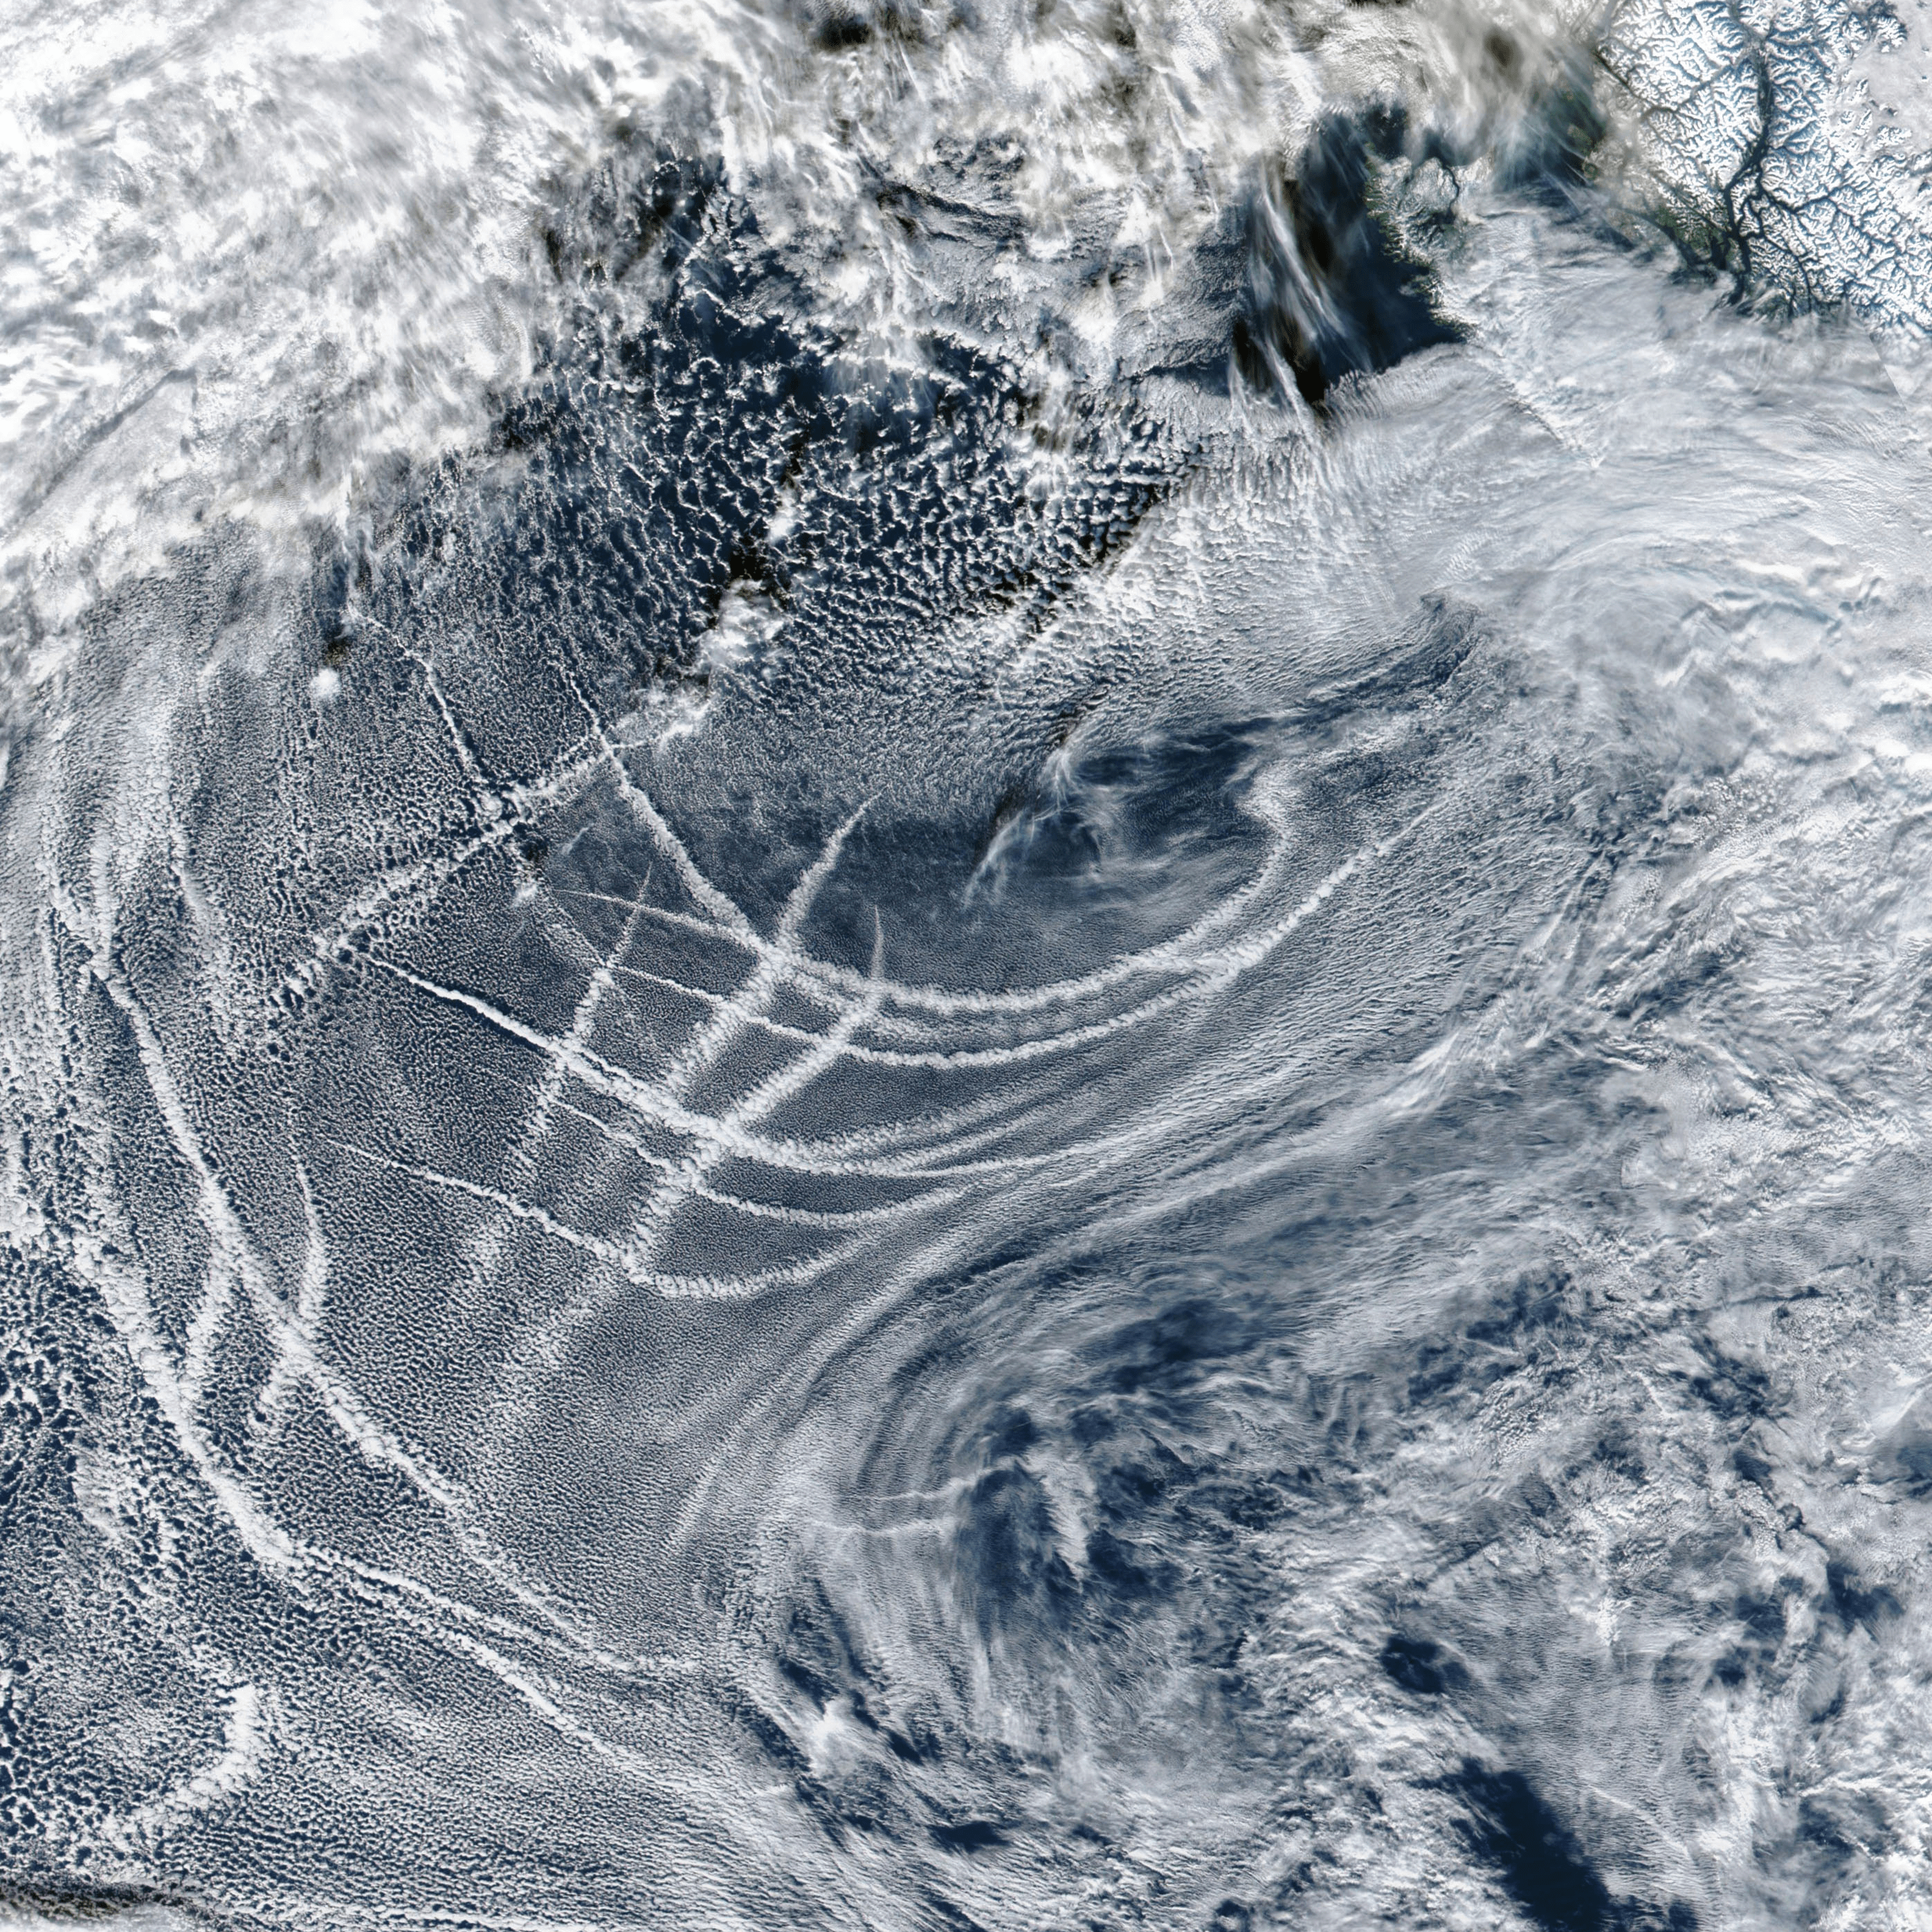
Line-like clouds criss-cross the Pacific Ocean in this satellite image. Each one is a ship track, a remnant left behind a passing ship. As they travel, ships leave a trail of exhaust that seeds the atmosphere with aerosols that serve as additional nucleation sites for clouds. The tiny particles interact with existing low-level clouds, making them brighter. Of course, the aerosols are present in the wake of ships regardless of whether they seed clouds that we can observe. (Image credit: J. Stevens; via NASA Earth Observatory)
Tag: satellite image

Streaks of Sea Ice
As summer approaches in the Southern Ocean, sea ice melts, but the process is not purely one-way. Temperatures in some locations are cold enough for some limited new freezing. The result is a mix of ice conditions like those seen here. The oldest, thickest ice is part of the ice shelf in the image’s lower right. Normally, younger sea ice would nestle against this shelf, but strong winds have blown that ice north-eastward.
In the open waters between, delicate frazil ice — tiny needle-like crystals — forms. The wind, coupled with the wave motion, drives the frazil ice together to form streaks of nilas, which eventually accumulate into a layer along the older, broken, windswept ice. (Image credit: J. Stevens/USGS; via NASA Earth Observatory)

Swirls in the Wake
Rocky islands make excellent atmospheric swirls, as seen here around Guadalupe Island. Winds blowing in from the ocean get forced up and around the island’s topography, resulting in vortices that shed alternately from either side of the island. The pattern they form is known as a von Karman vortex street and is easily seen in satellite imagery, thanks to the swirls that can persist for tens of kilometers downstream. Personally, I never get tired of this one! (Image credit: NASA/GSFC/JPL; video credit: NOAA/CIRA; via Dakota Smith; submitted by @SellaTheChemist)

Siberia’s Lena River Delta
As rivers near the sea, they often slow down and branch out, creating intricate paths through delta wetlands. This video explores the Arctic’s largest river delta, that of the Lena River in Siberia, during its spring and summer flood season. The images were all taken by satellite and processed with color enhancements to highlight patterns in the water. Although this is not quite how the area would appear by eye, all of the visible patterns are real. (Image credit: N. Kuring/NASA’s Ocean Color Web; video credit: K. Hansen; via NASA Earth Observatory)


Bullseye
The Cumbre Vieja volcano in the Canary Islands began erupting in mid-September 2021. This satellite image, captured October 1st, shows a peculiar bullseye-like cloud over the volcano. Hot water vapor and exhaust gases rose rapidly from the erupting volcano until colliding with a drier, warmer air layer at an altitude of 5.3 kilometers. The warm upper layer, known as a temperature inversion, prevented the volcanic gases from rising any further, so they instead spread horizontally. The outflow from the volcano varies and is non-uniform, and its fluctuations generated gravity waves that are visible here as the expanding rings of clouds. (Image credit: L. Dauphin; via NASA Earth Observatory)

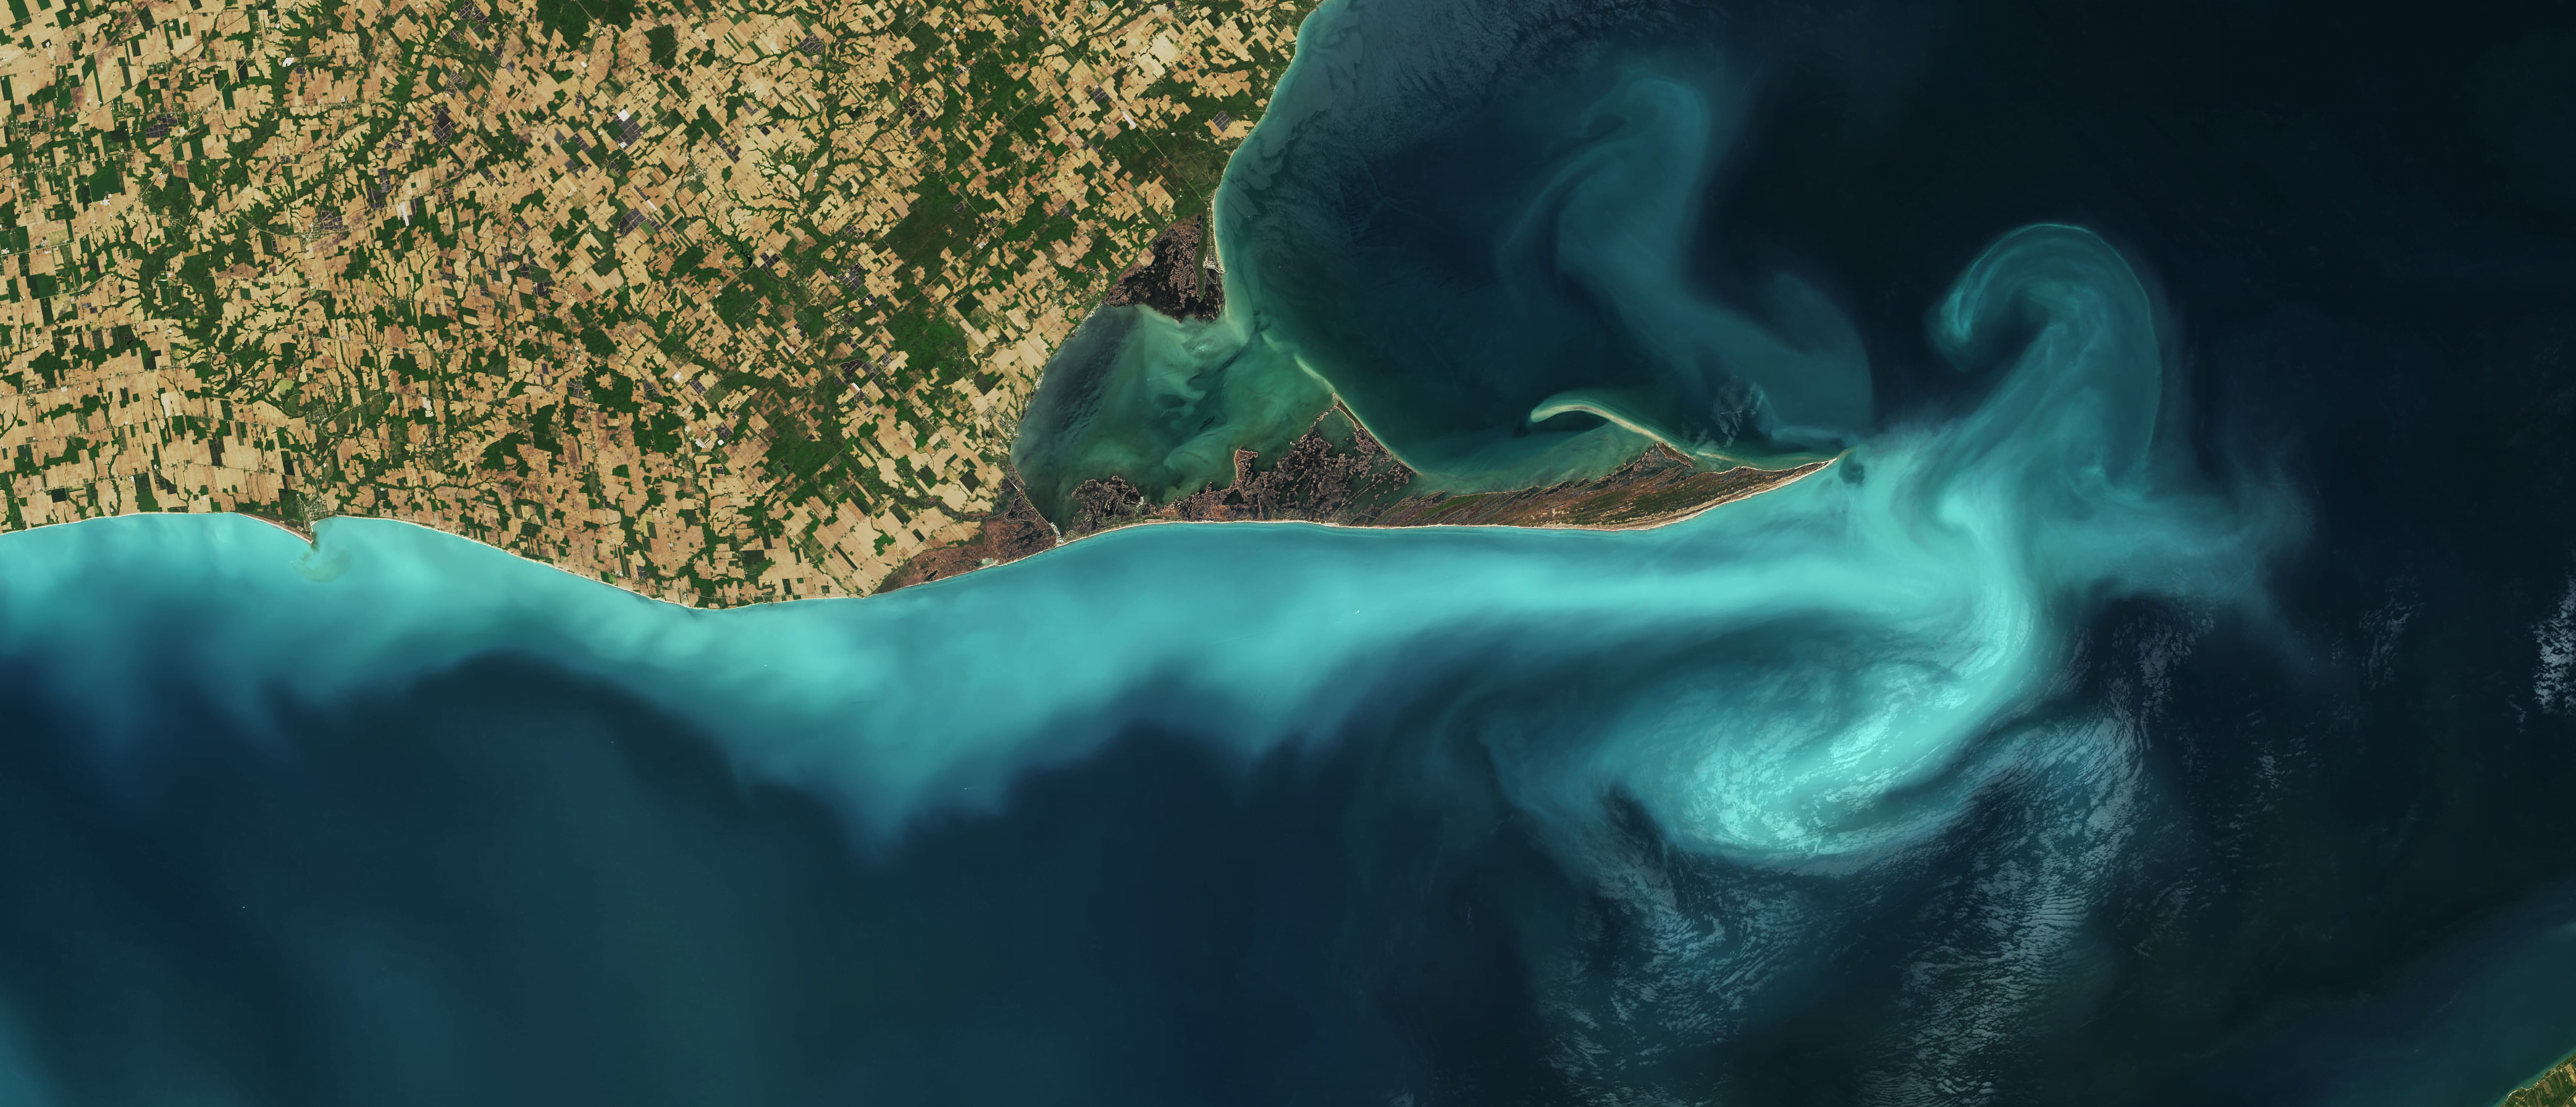
Suspended Sediments in Lake Erie
Lake Erie’s Long Point is outlined in turquoise in this natural-color satellite image. The pale color is likely due to limestone sediments in the shallow waters getting resuspended by a seiche or other disturbance. A seiche is a standing wave that forms in a partially- or fully-bounded body of water; in Lake Erie they are typically wind- and weather-driven. (Image credit: J. Stevens/USGS; via NASA Earth Observatory)

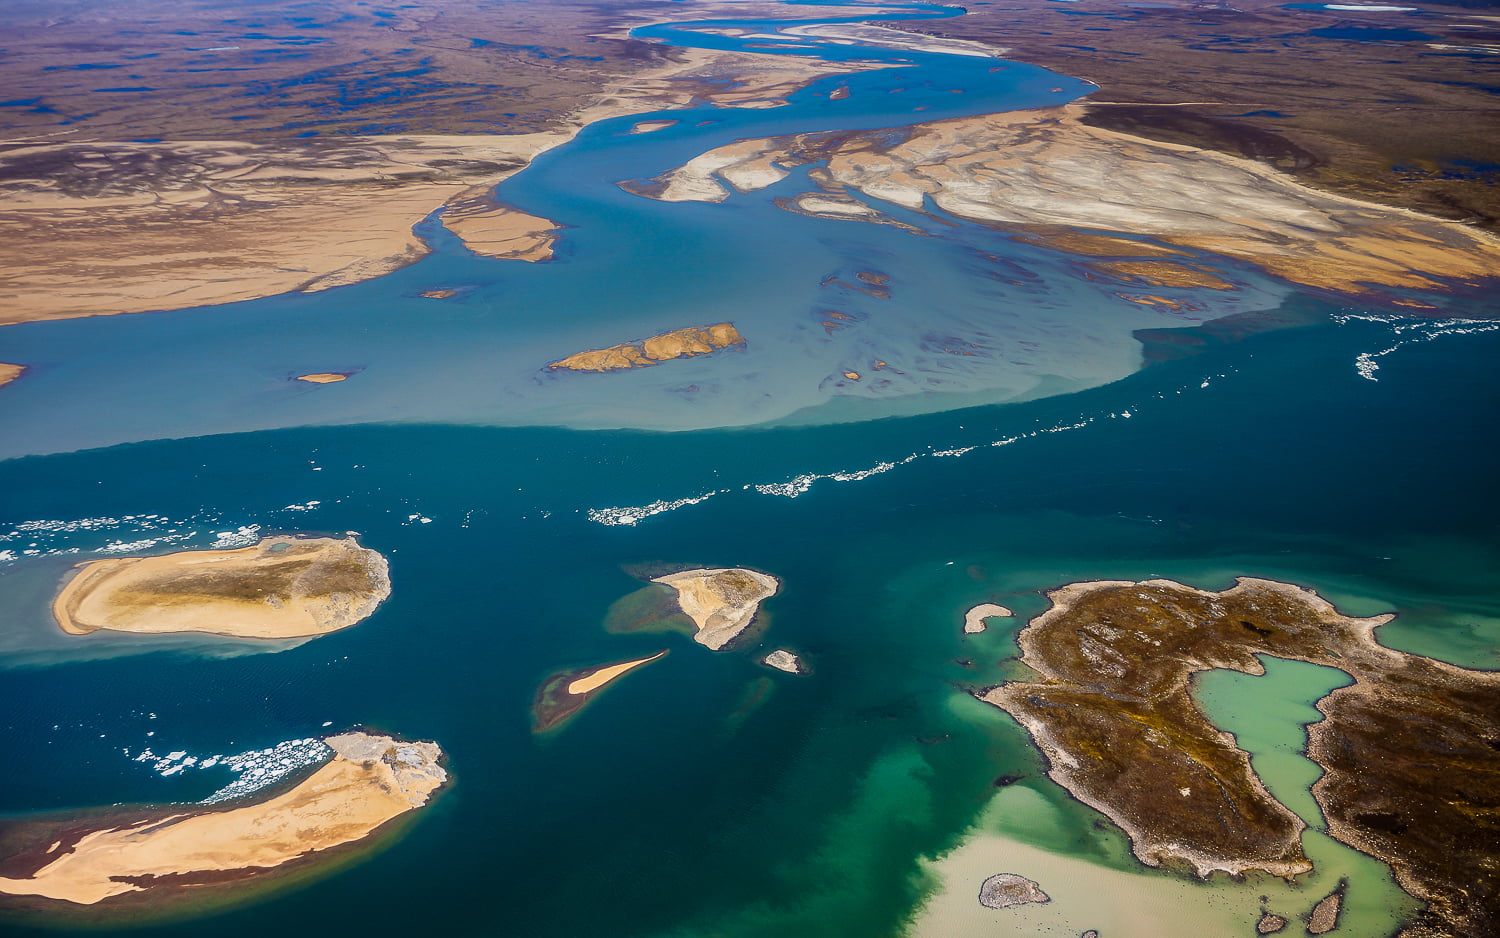
Meeting Without Mixing
When bodies of water meet, they don’t always mix right away. Here we see the confluence of the Back and Hayes Rivers in the Canadian Arctic. The Back River appears as a darker blue-green color compared to the light turquoise Hayes River. The different colors reflect the levels of algae and sediment carried in their waters. As seen in both the aerial and satellite photos here, there’s a distinct line where the two waters meet without mixing, and that line persists for kilometers beyond their initial confluence. Typically, this lack of mixing between bodies of water is caused by differences in temperature, salinity, and turbidity (amount of sediment) that make the density of each river’s water different. (Image credit: top – R. Macdonald/Univ. of Manitoba, bottom – J. Stevens/USGS; via NASA Earth Observatory)
Sea Swirls by the Shore

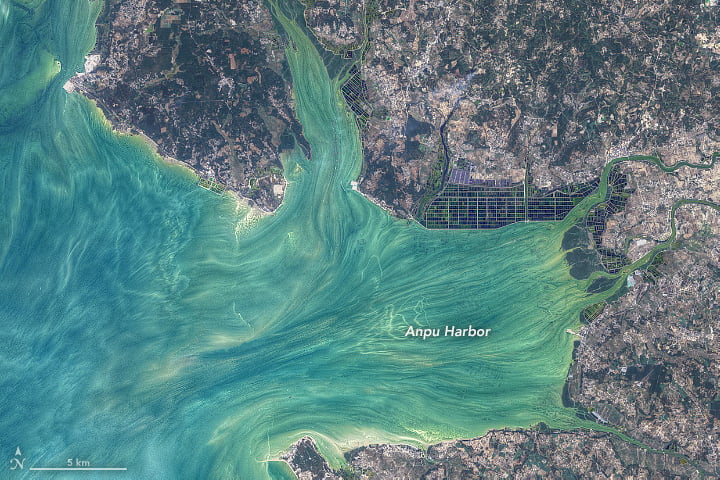

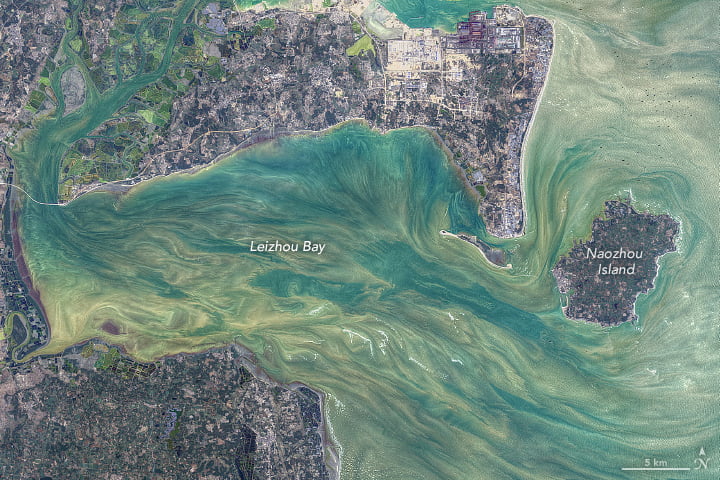
Water and sediments swirl in these enhanced satellite photos of China’s Leizhou Peninsula. Color-filtering algorithms have drawn out the details of the flows, but the patterns themselves are real. Tides, currents, sediment, and human activity combine to form these complex flows along the peninsula’s shores. The straight parallel lines seen off Liusha Bay, for example, are likely the result of a traditional fishing method using nets suspended off poles anchored into the seabed. (Image credit: N. Kuring; via NASA Earth Observatory)

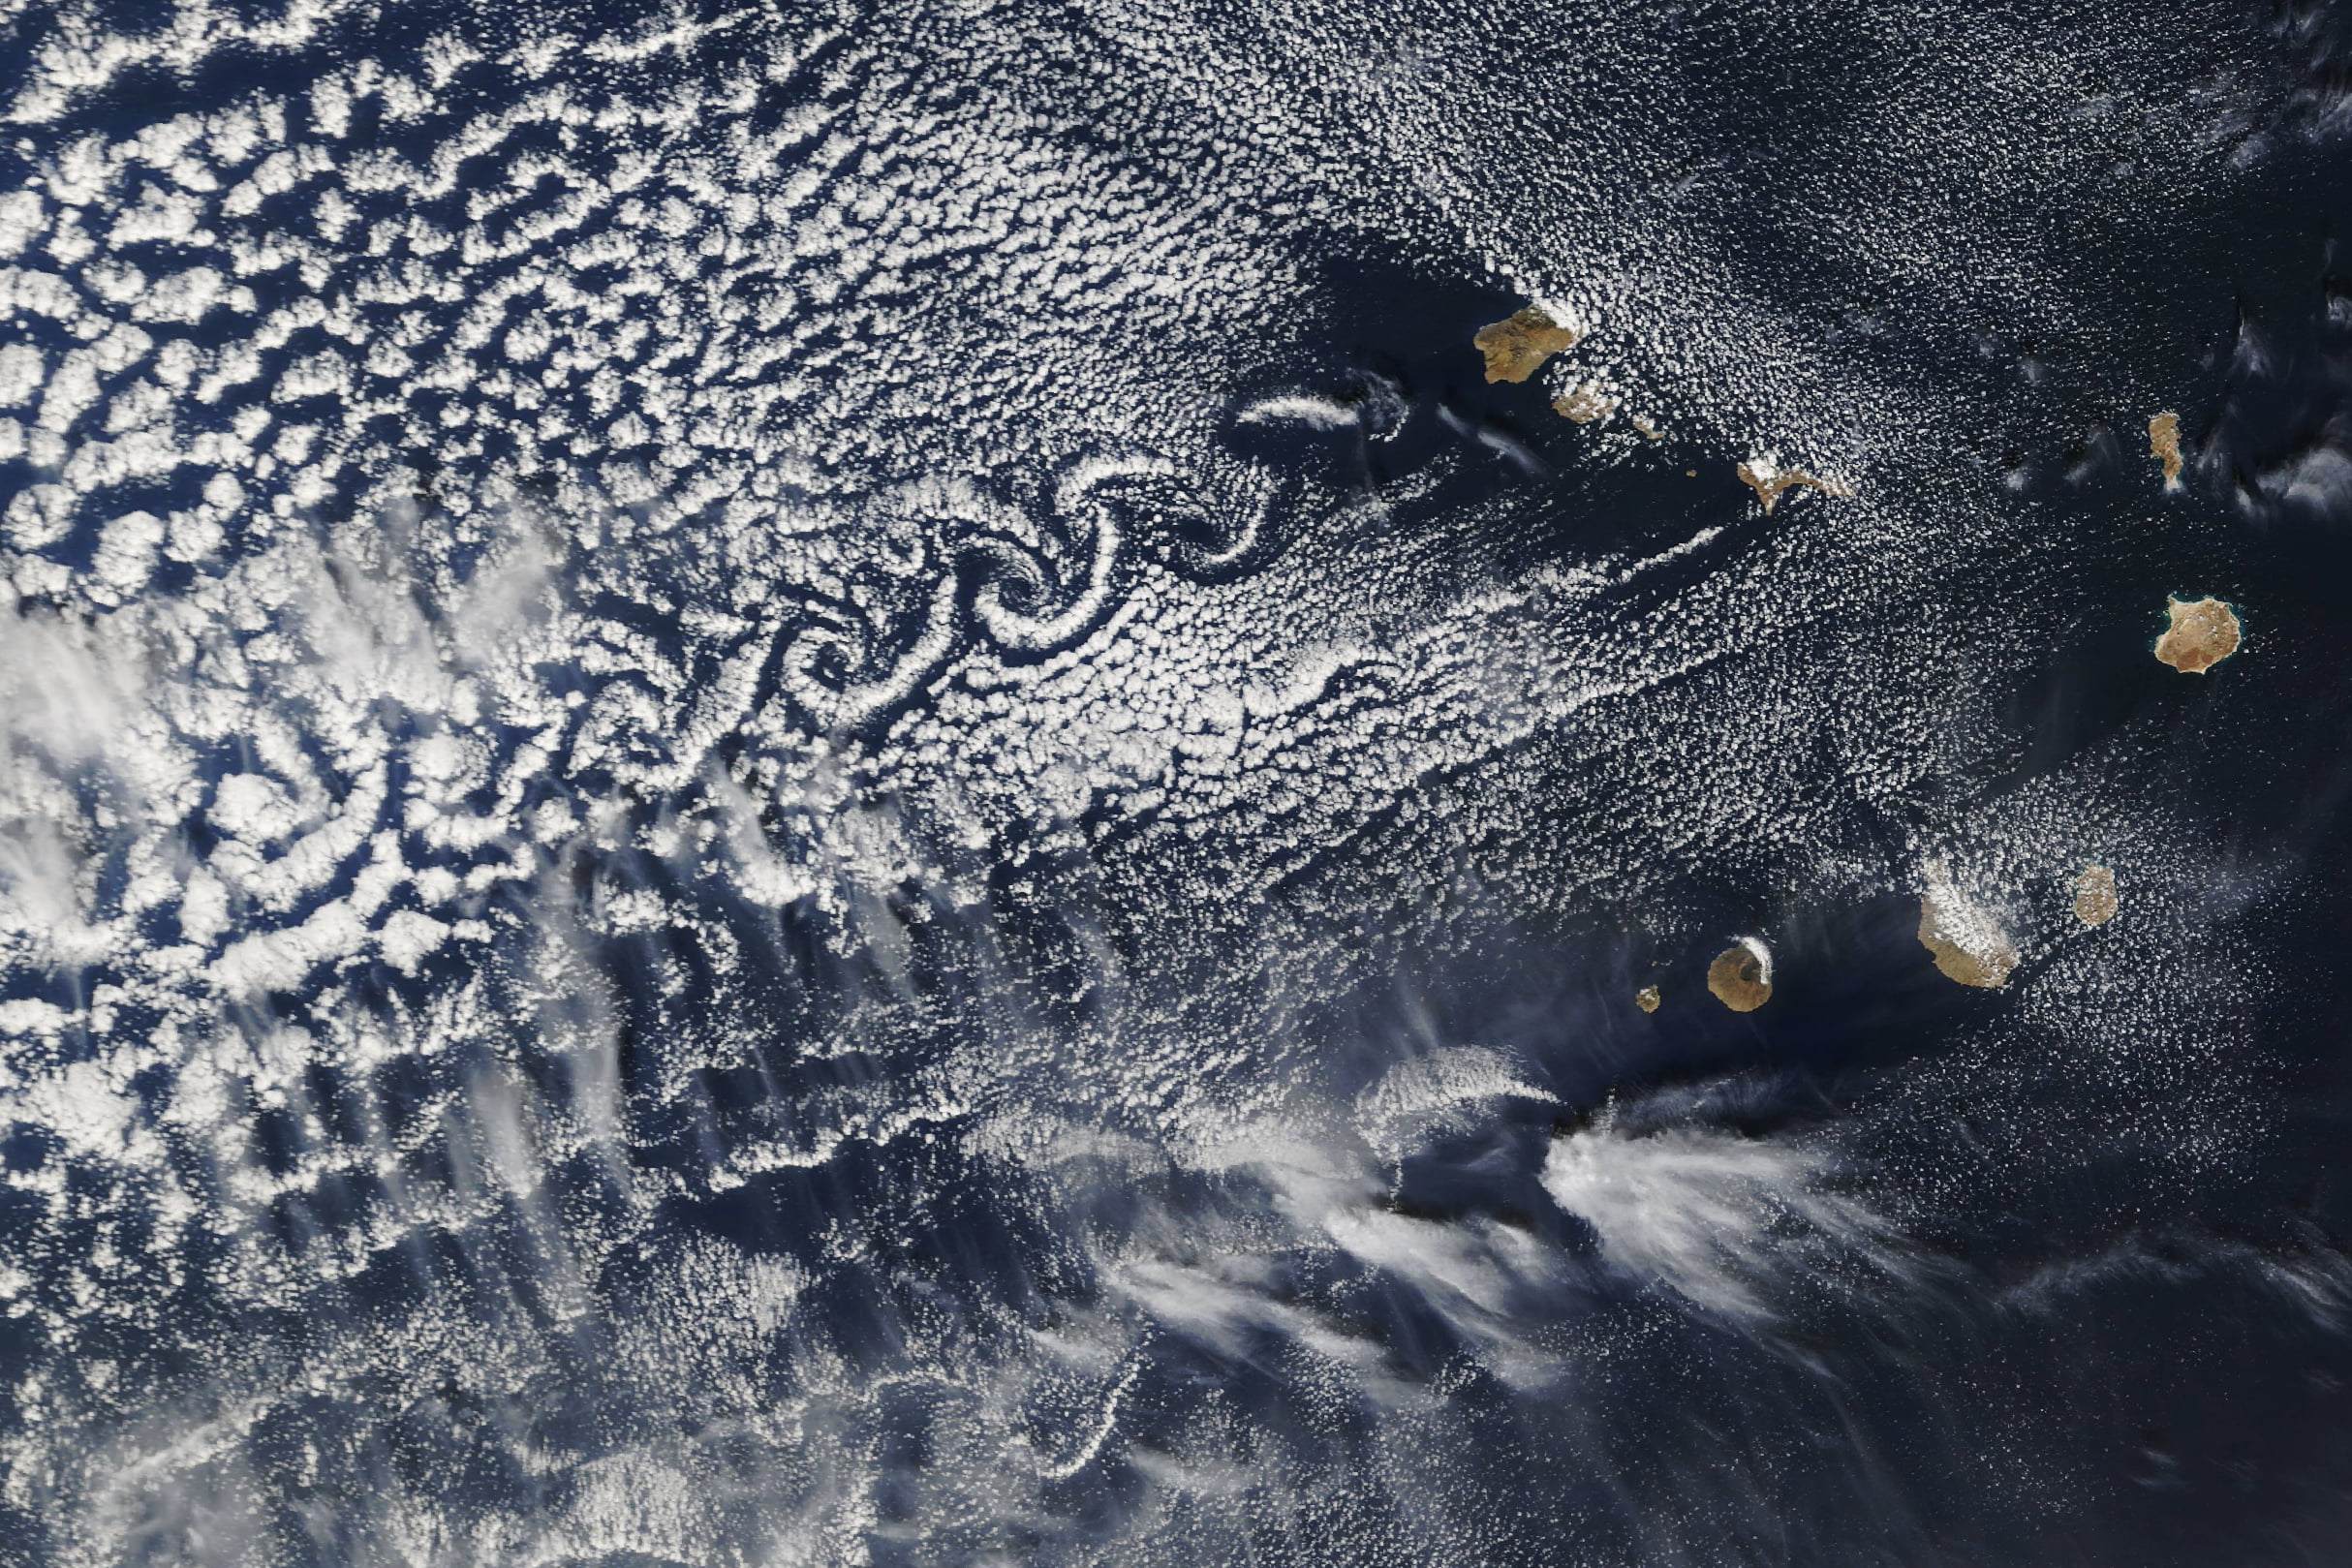
Strings of Swirls
Von Karman vortex streets are the rows of alternating vortices shed off isolated objects interrupting a flow. Here, the volcanic peaks of Cabo Verde disrupt an atmospheric flow accustomed to an empty ocean. In a steady wind, air wraps around the volcanoes and detaches first on one side, creating a vortex, then from the other side, making a vortex of the opposite rotation. Although these structures are always present, we only see them when they stir up the cloud layer, leaving these strings of swirls for hundreds of kilometers behind the islands. (Image credit: L. Dauphin/NASA; via NASA Earth Observatory)

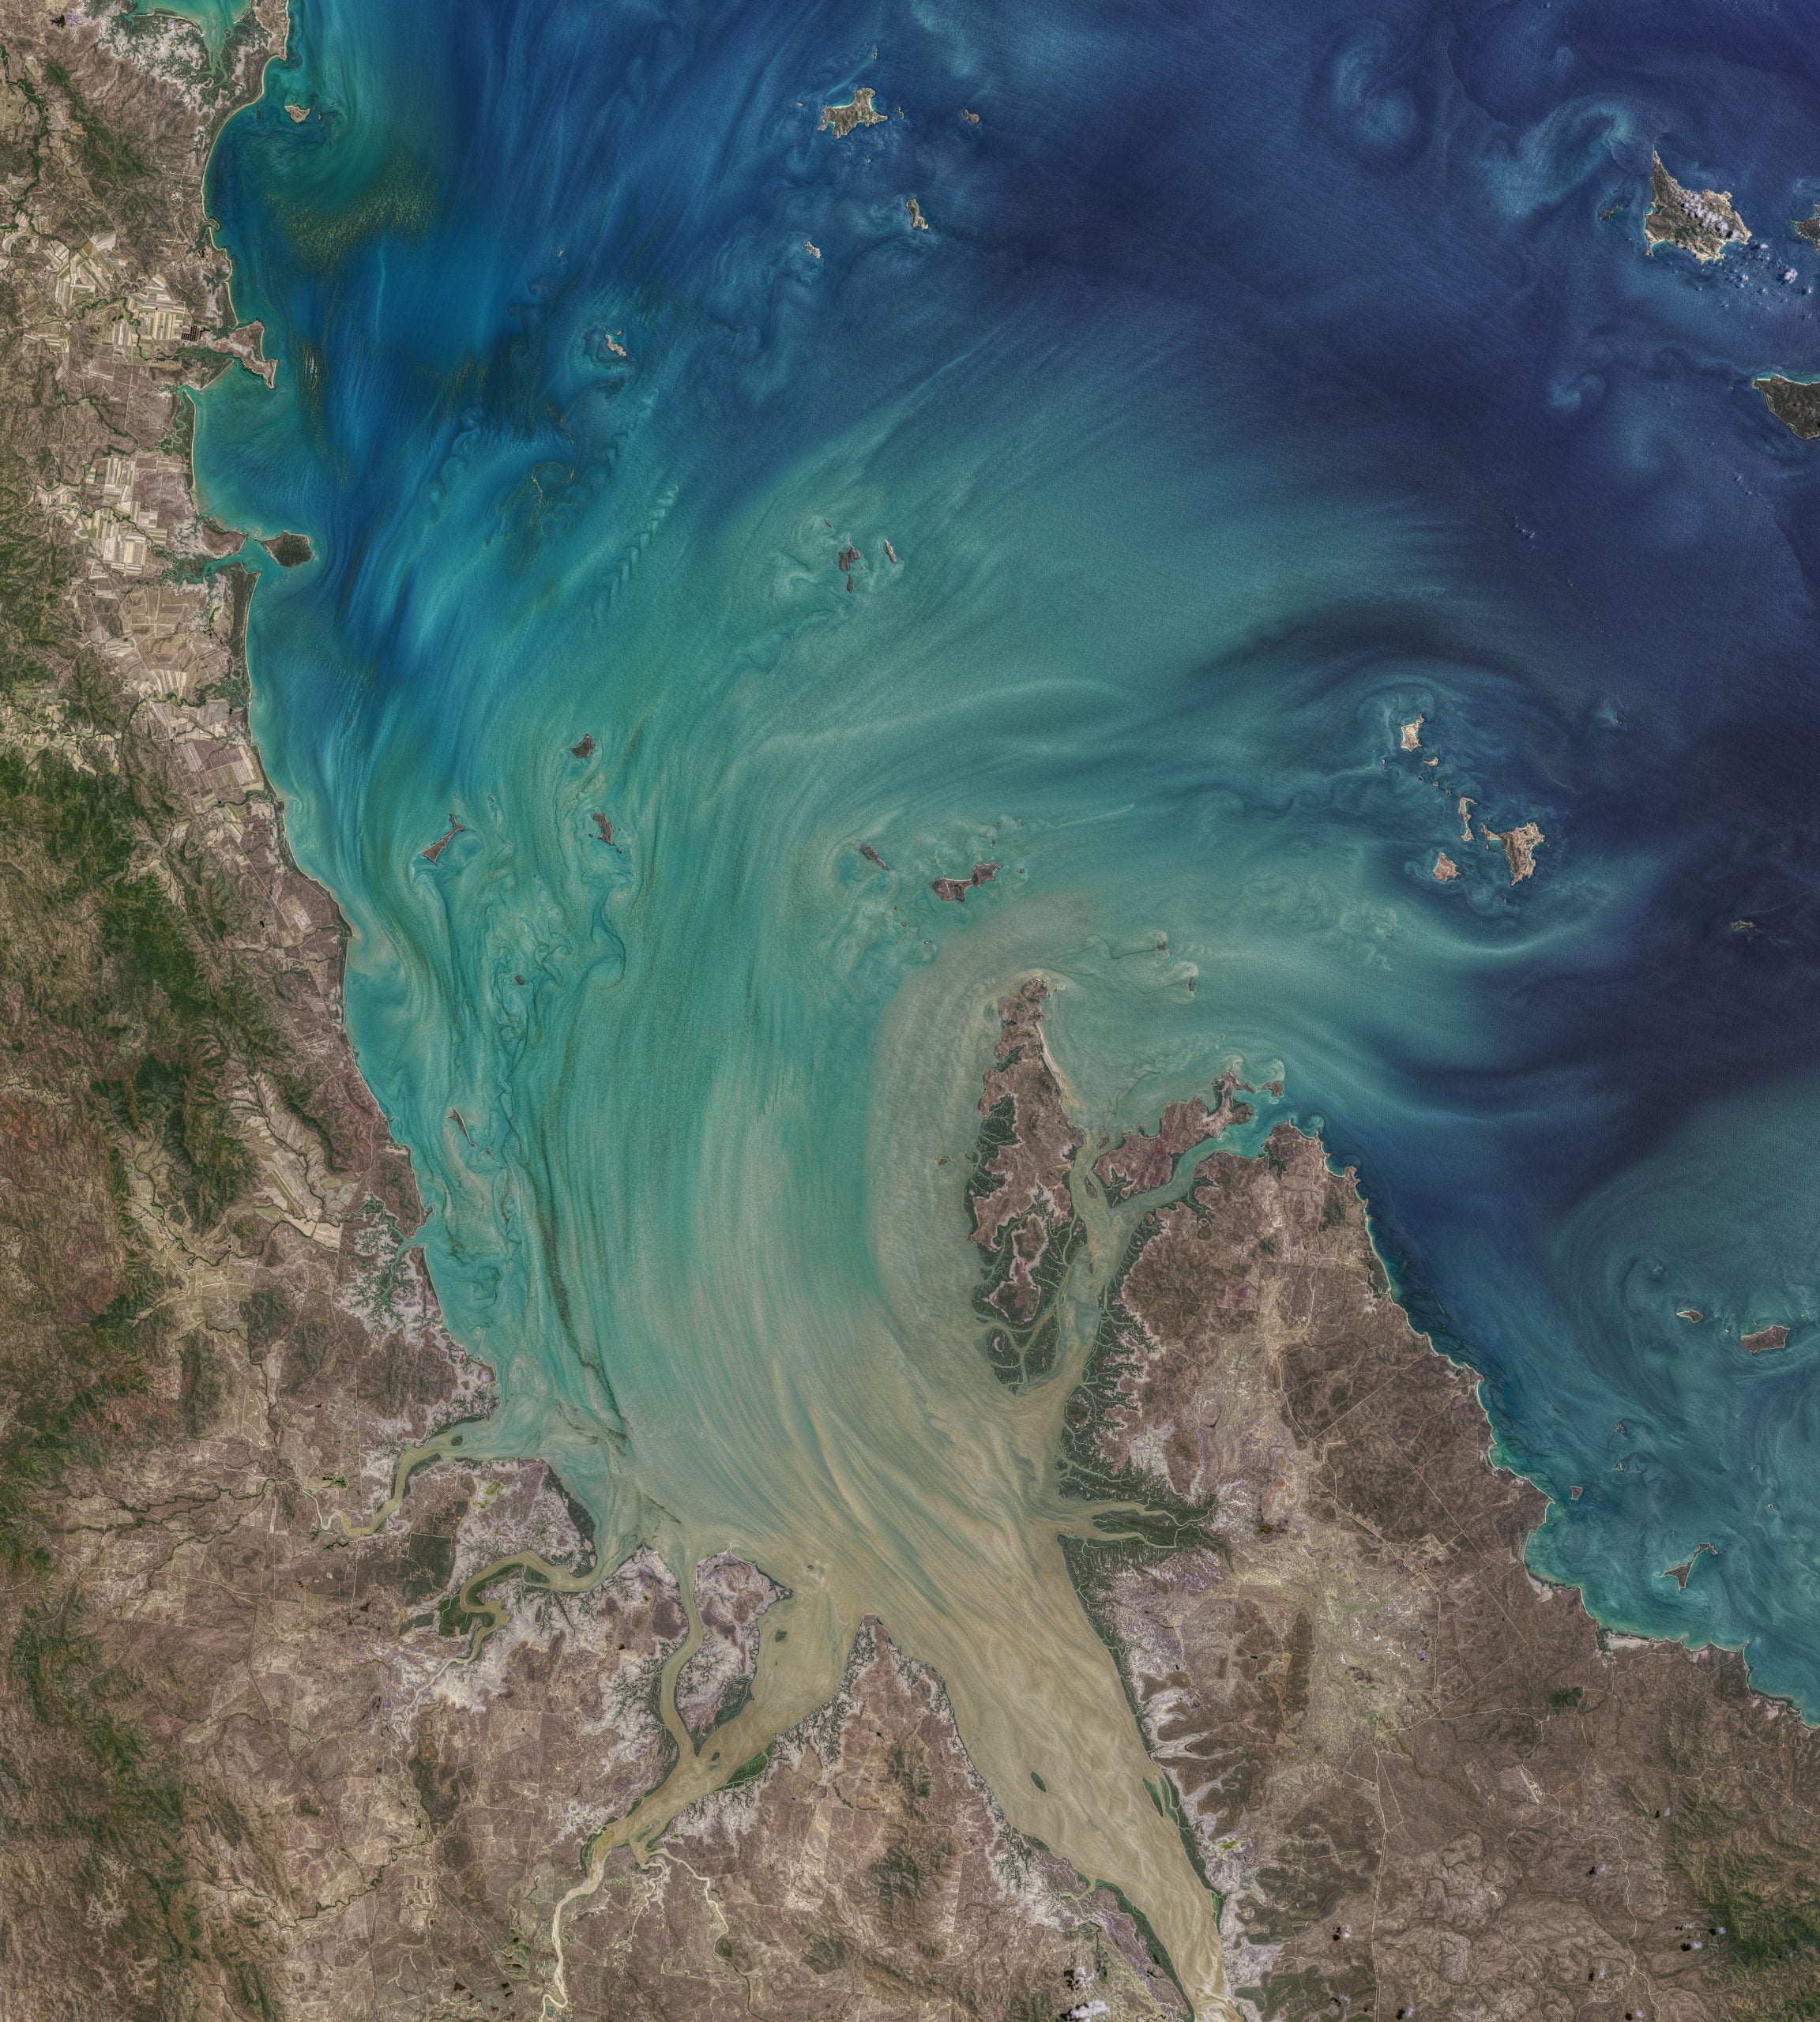
High Tide
Broad Sound, in eastern Australia, is home to some of the most extreme tidal swings in the world, with more than ten meters difference between high and low tides. The bay’s peculiar geography, along with the topography of nearby reefs, combine to cause the large tides. This color-enhanced satellite image shows the bay at high tide, as phytoplankton and suspended sediments are swept into the bay and around its many islands. The level of detail is just stunning. I particularly love all the von Karman vortex streets visible in the wakes of islands. I count more than a dozen of them! (Image credit: N. Kuring/NASA/USGS; via NASA Earth Observatory)