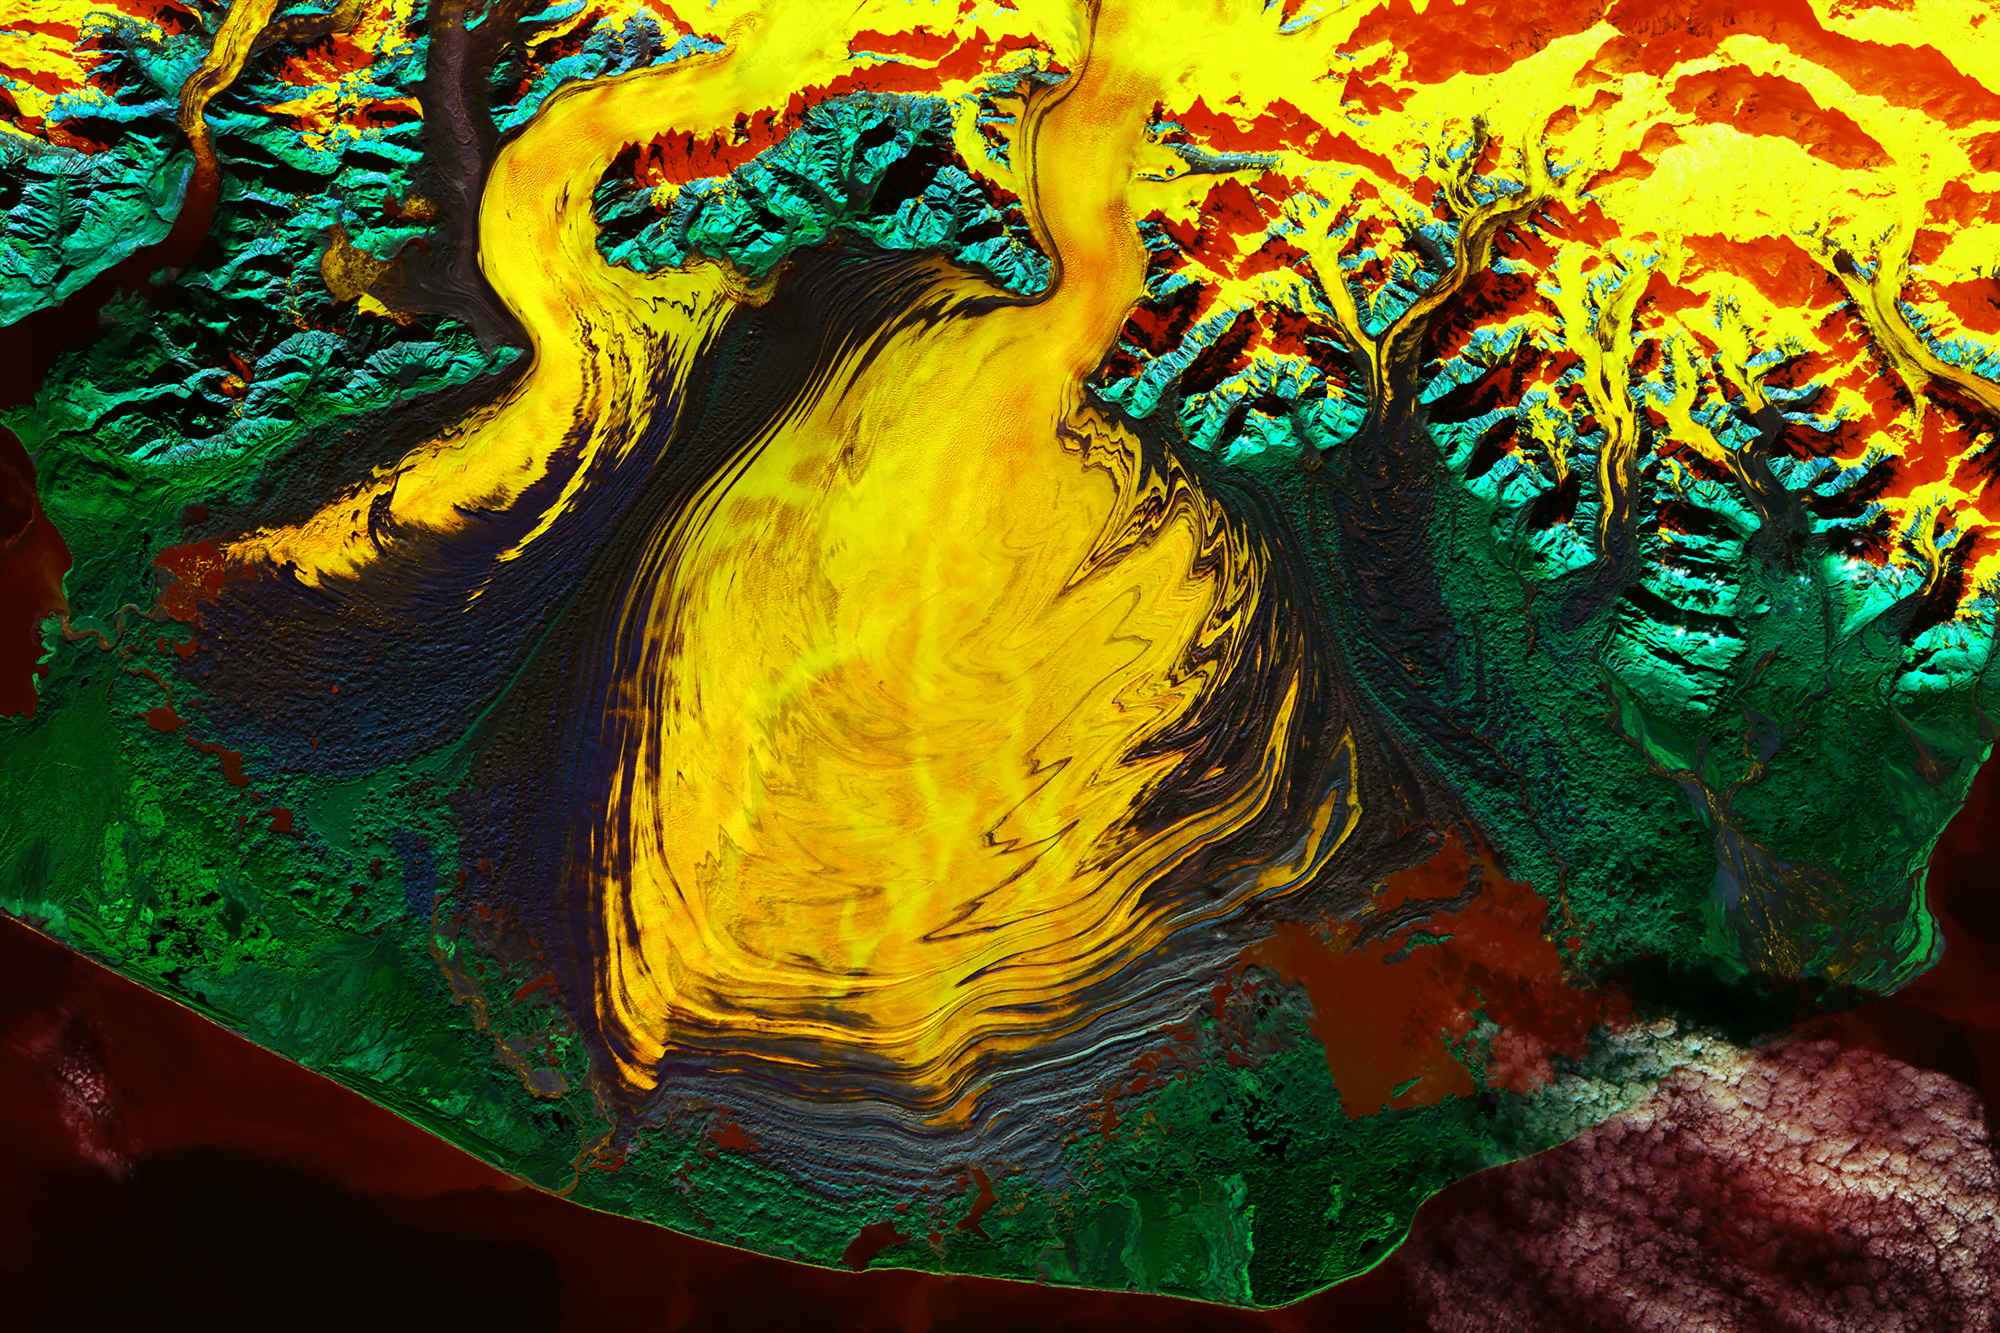
This false-color satellite image of Malaspina Glacier (Sít’ Tlein) is a riot of color. Composed of coastal/aerosol, near infrared, and shortwave infrared bands from Landsat 9, the colors highlight features otherwise hard to identify. Watery features appear in reds, oranges, and yellows; vegetation is green and rock appears in blue. The glacier covers more than 4000 square kilometers, an area larger than the state of Rhode Island. The dark lines atop the glacier are moraines, where rock, soil, and other debris has been scraped up along the glacier’s edge. Over time, changes in the glacier’s velocity cause the moraines to fold and shear, creating the zigzag pattern seen here. (Image credit: W. Liang; via NASA Earth Observatory)
Tag: satellite image

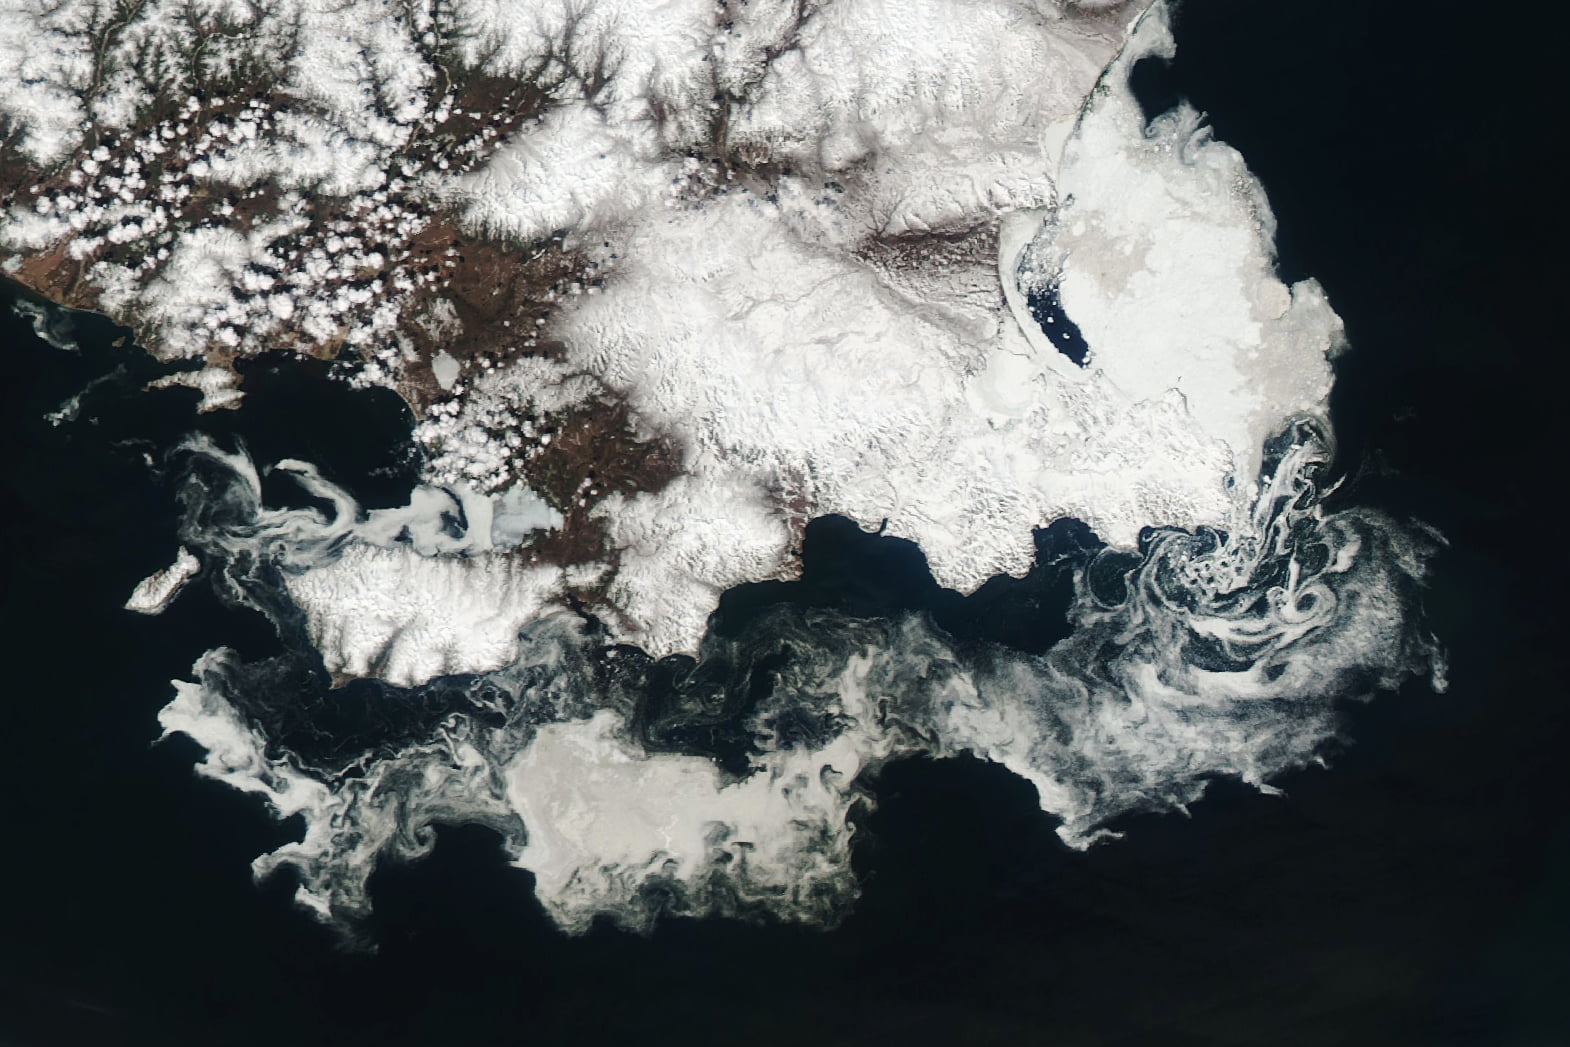
Swirling Sea Ice
The Sea of Okhotsk is the northern hemisphere’s southernmost sea that seasonally freezes. Caught between the Siberian coast and the Kamchatka Peninsula, cold air from Siberia helps freeze water kept at lower salinity due to freshwater run-off. This image, taken in May 2023, shows free-floating sea ice forming spirals driven by wind and waves. Small islands off the eastern coast (right side in image) are likely responsible for the swirling eddies seen there. Like phytoplankton blooms and sediment swirls in warmer seasons, the sea ice acts as a tracer to reveal flow. (Image credit: W. Liang; via NASA Earth Observatory)

An August Arc
In summer, the fjords of Greenland are littered with ice, but in August 2023, satellites caught an odd interloper. See the thin white arc spanning the fjord in the photo above? Scientists suspect this ephemeral feature was a wave caused by a large iceberg calving off the glacier on the right. When large chunks of ice fall into the water, they can cause distinctive waves that travel out from the point of impact.
Another possible mechanism is an underwater plume. In Greenland’s fjords, such plumes are sometimes formed from freshwater melting below the glacier. When that water rises to the surface, it can push ice. (Image credit: W. Liang; via NASA Earth Observatory)

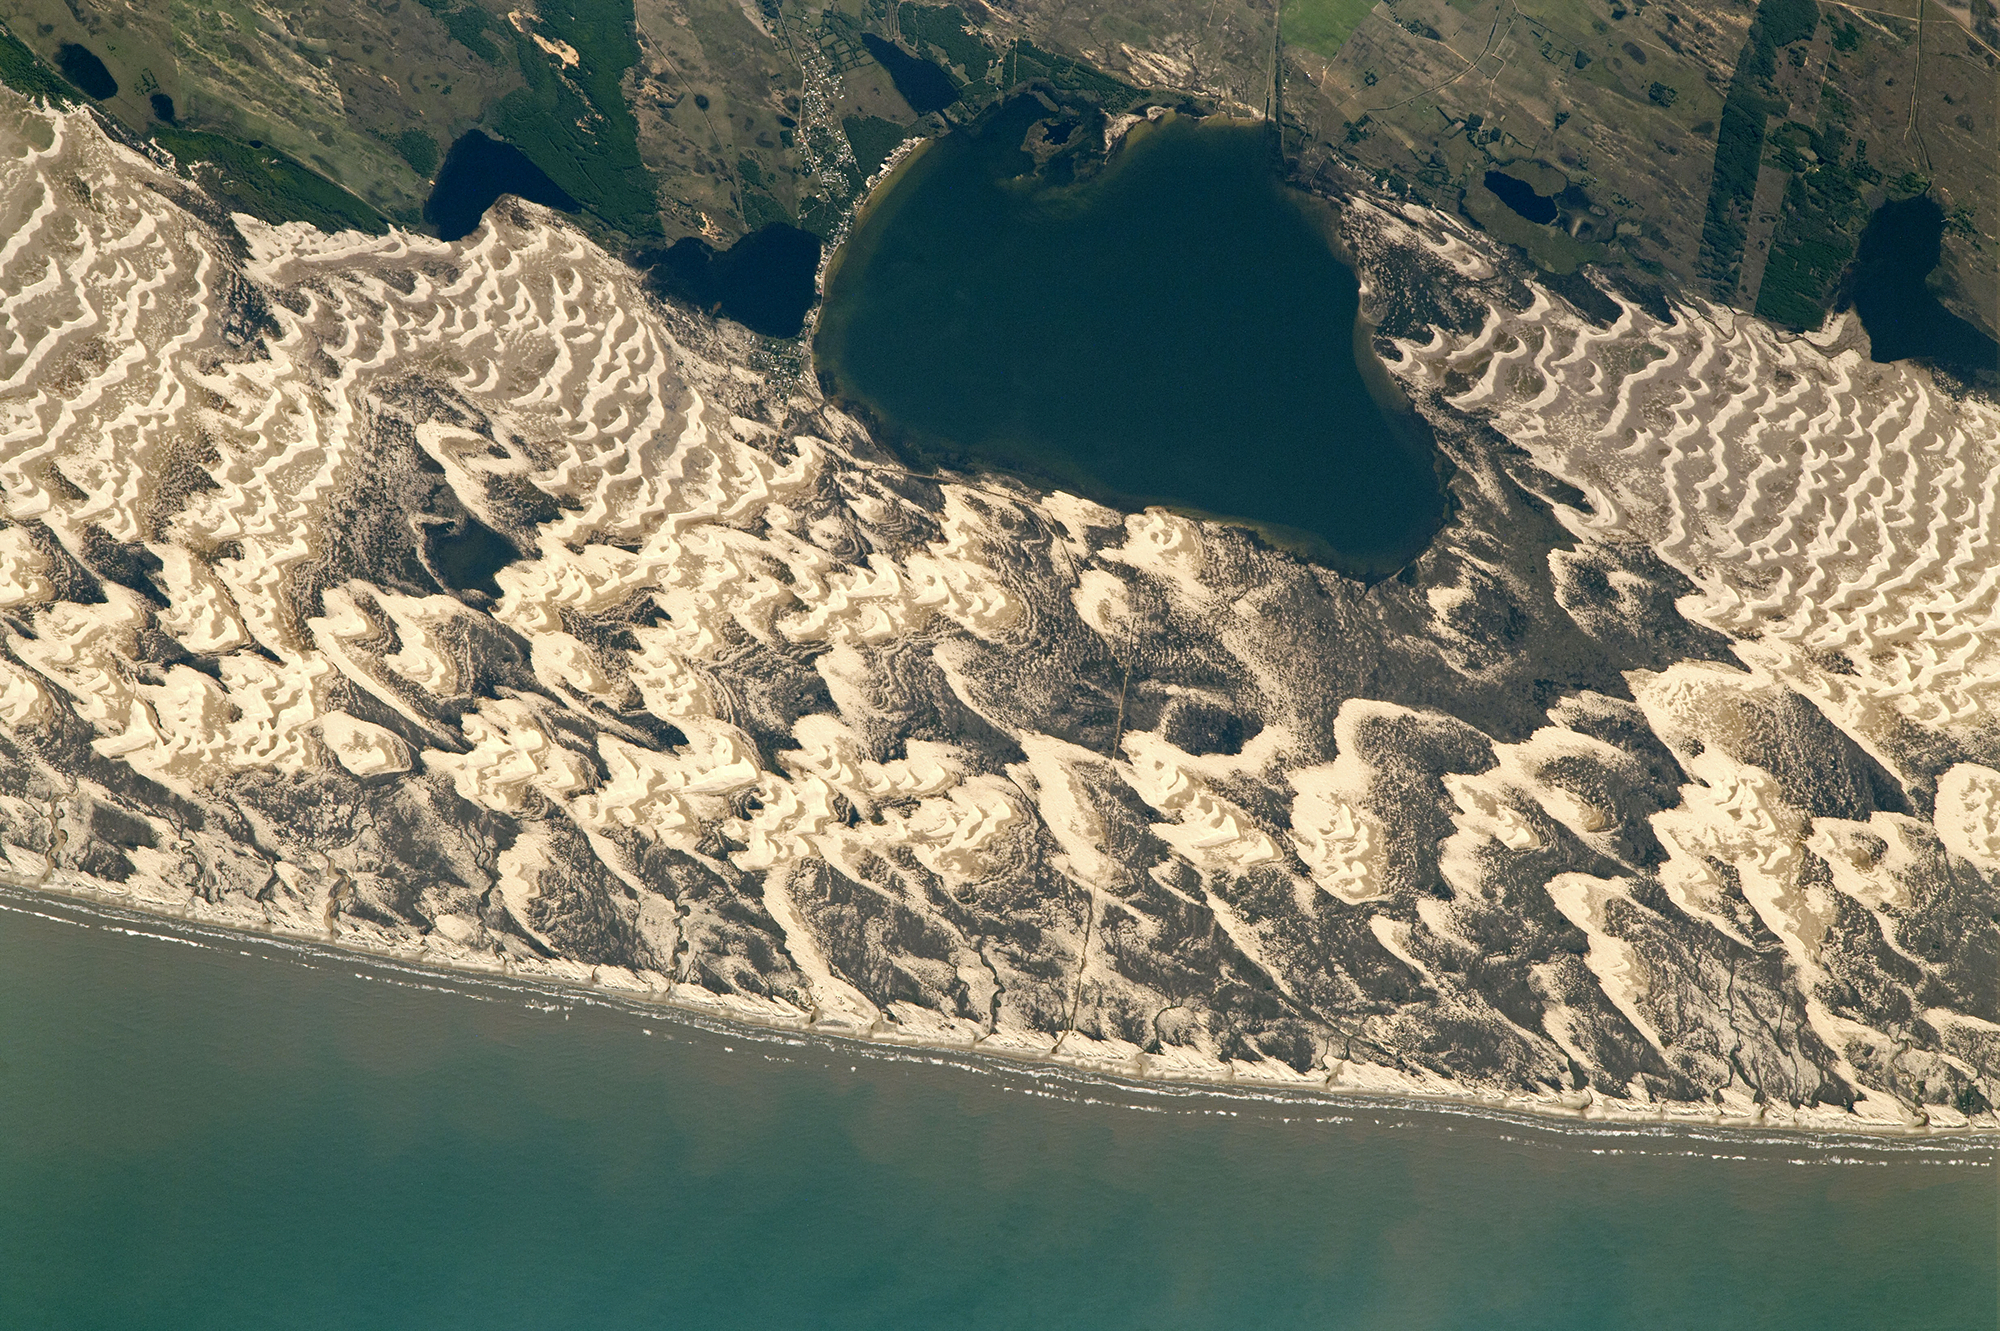
Field of Dunes
Barchan dunes collide in this astronaut image of Brazil’s southern coastline. Barchan (pronounced “bar-kahn”) dunes are crescent-shaped; their tips point downwind into their direction of travel. When many barchan dunes overlap, they coalesce into a dune field like the one seen here. A dune’s speed depends on many factors, including the wind speed, dune size, and its proximity to other dunes. In experiments, dunes have even chased one another and changed speeds to avoid collision. (Image credit: NASA; via NASA Earth Observatory)

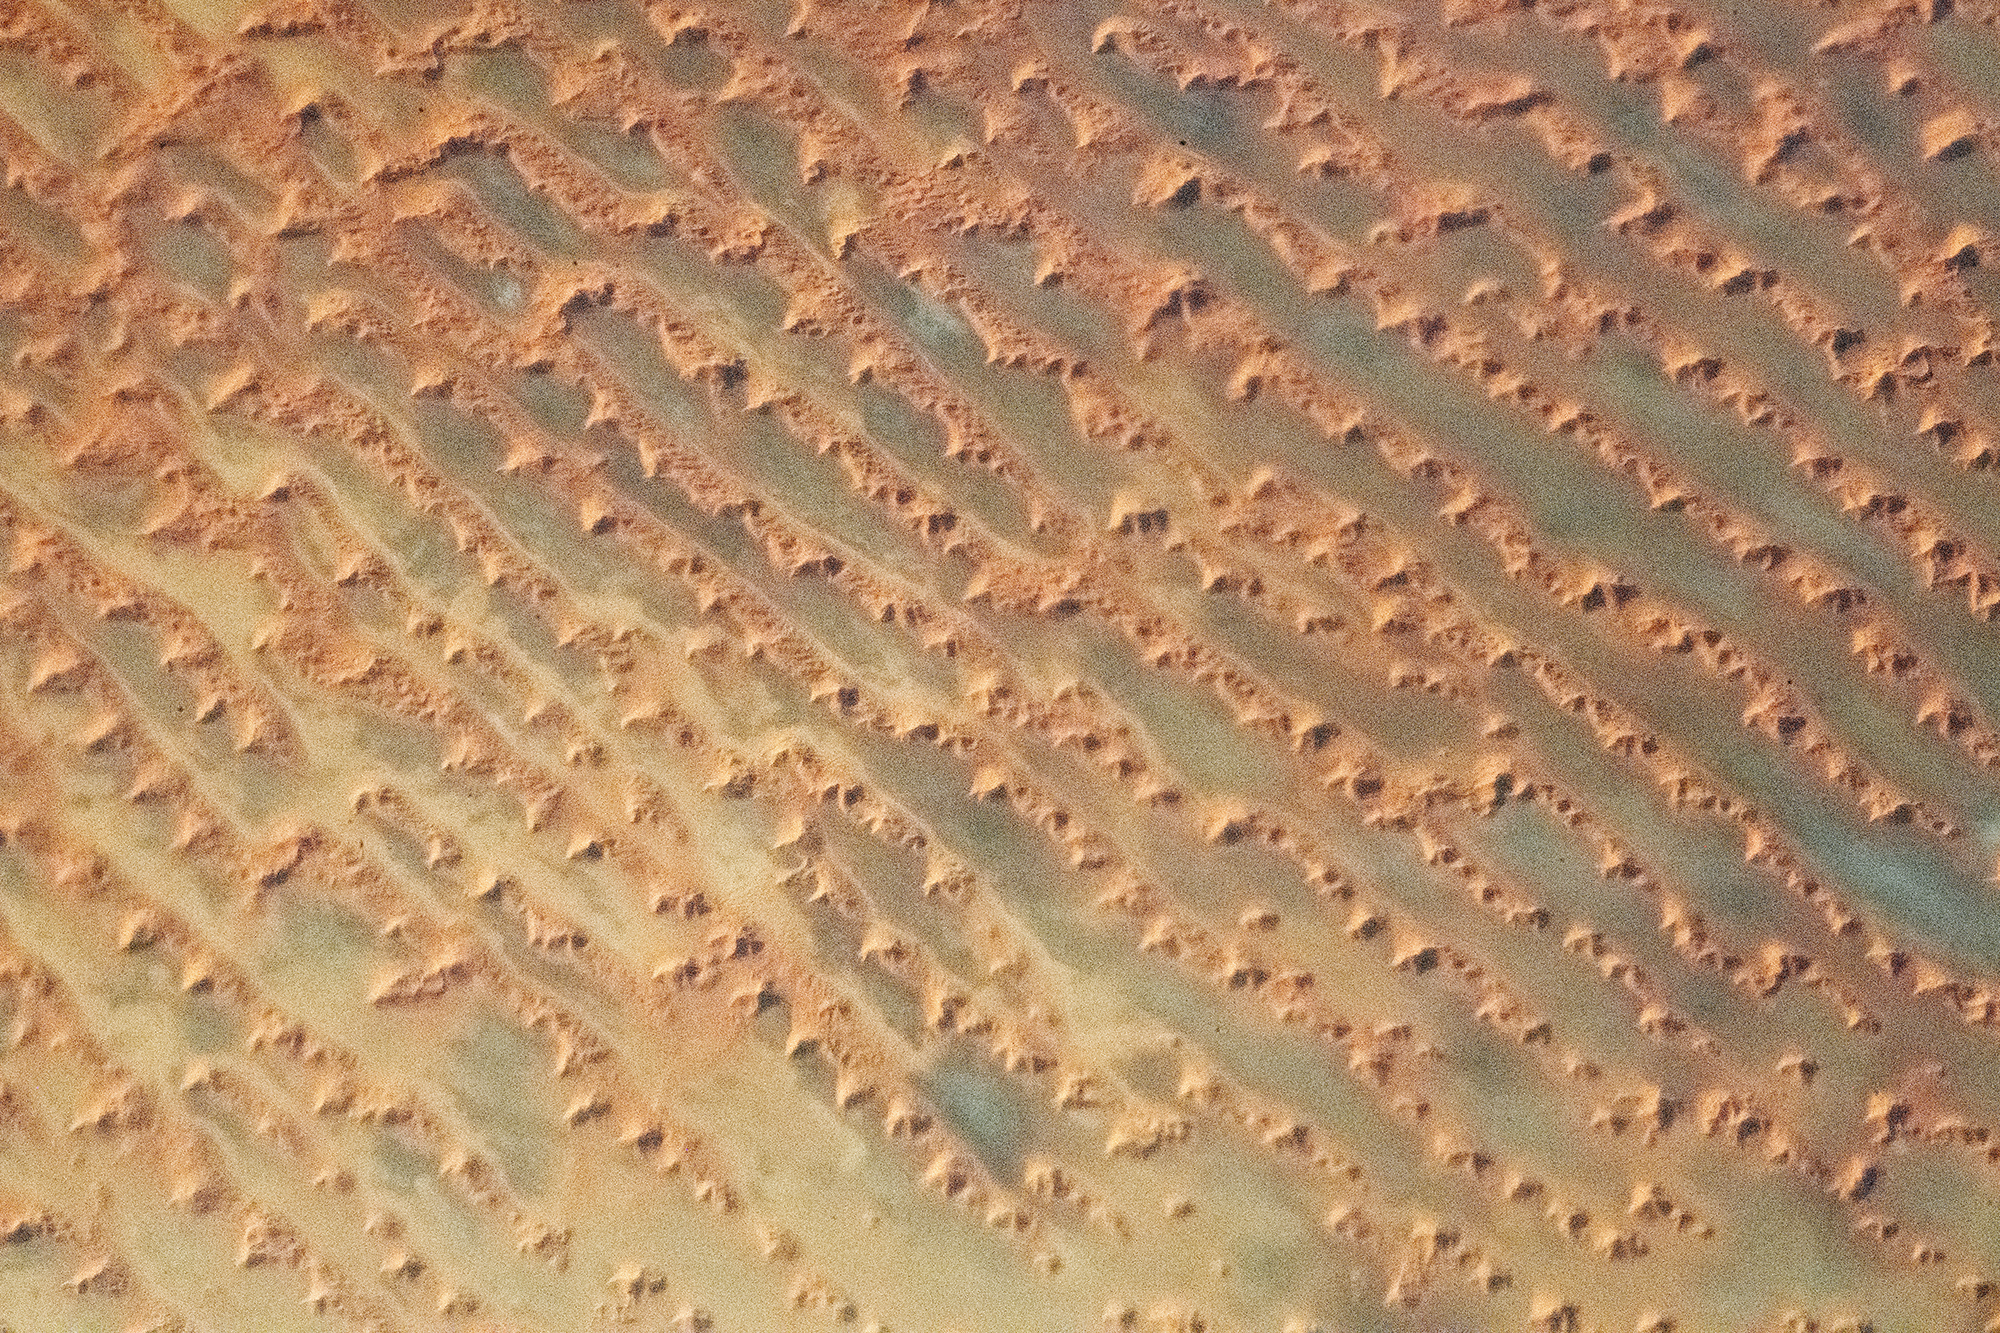
Complex Dunes
Sometimes landscapes have a beauty that’s hard to see from the ground. This astronaut’s photo shows a dune field in the sand seas of Saudi Arabia. Vast linear dunes line up along the direction of prevailing winds. Atop these dunes are more complex formations, star dunes, that are built up in the wake of changing winds. Built from three or more intersecting arms, the star dunes are steeper than the linear dunes they sit atop. Such complex dune fields — with multiple types of dunes — form in areas with especially abundant sands. (Image credit: NASA; via NASA Earth Observatory)
Clouds Down Under
This large and unusual cloud formation was captured one July morning over western Australia. Stretching over 1,000 kilometers, the clouds have interesting features at both the large and small scale. The small-scale ripples within the clouds are gravity waves triggered by the terrain below. The larger, arced features are tougher to explain, though they may also be related to gravity waves and terrain, just on a much larger scale. They also resemble fallstreak clouds where supercooled droplets evaporate from the inside of the cloud out. (Image credit: W. Liang; via NASA Earth Observatory)

Predicting Landslides
Landslides can cause catastrophic damage, but historically it’s been difficult to monitor susceptible slopes and predict when they’ll fail. But a recent study looking at the 2017 Mud Creek landslide in California shows that new methods could provide a heads up.
The researchers used satellite data from the months preceding the landslide to study how areas on the slope moved relative to one another. Within their survey region, they found sub-regions where ground locations largely moved together. These sub-regions, called communities in the researchers’ parlance, were remarkably persistent, showing little variation over long periods. But 56 days before the landslide, the researchers saw a sudden change between the communities on the slope. They believe their methodology could help identify slopes in danger of imminent slides.
So far, though, they’ve only applied this method to the Mud Creek landslide. It’s a promising start, but they’ll need to show that the technique works for other slides as well. If so, it will be a major step forward in landslide prediction. (Image credit: USGS; research credit: V. Desai et al.; via APS Physics)

Atlantic Blooms
In April 2023, swirls of green and turquoise burst into vivid color in the Atlantic. Much of the color comes from a phytoplankton bloom. Although phytoplankton are individually microscopic, they form eddies a hundred kilometers across that are visible from space. In detailed images like the one above (available here in full resolution) these swirls have amazing turbulent details. Some of the brightest sections almost look like a field of sea ice! (Image credit: L. Dauphin; via NASA Earth Observatory)


Anabranching Riverways
The Diamantina River in Australia is dry for much of the year. But seasonal rains flood its riverbeds and provoke a bloom of vegetation along its banks. This false-color satellite image shows the river in April 2023; land appears pale and reddish, the river and its sediment blue, and vegetation a bright green. The Diamantina is an anabranching river; rather than the typical meandering paths of a delta, anabranching rivers have semi-permanent paths hemmed in by vegetation-stabilized islands. Look closely, though, and you’ll still see smaller delta-like features known as floodouts dotting some of the islands. (Image credit: A. Nussbaum; via NASA Earth Observatory)

This close-up shows details like miniature deltas (floodouts) and wind-formed dunes. 
Swirls Over the Canaries
Rocky, isolated islands disturb the atmosphere, sending air swirling off one side of the island and then the other. The effects are not always visible to the naked eye, but, as they do here, they can show up in satellite imagery as whirling von Karman vortex streets. The eddies of this image are due to the Canary Islands, and if you follow the line of swirls backward, you’ll find their originating islands. Note that the cloudy swirls don’t appear immediately behind the islands. That’s because there wasn’t enough moisture in the air for clouds to condense yet; the same swirls that you see in the downstream clouds exist in the clear air closer to the islands. (Image credit: A. Nussbaum; via NASA Earth Observatory)


