Tag: satellite image

  • Lines of Ice Eddies

    Lines of Ice Eddies

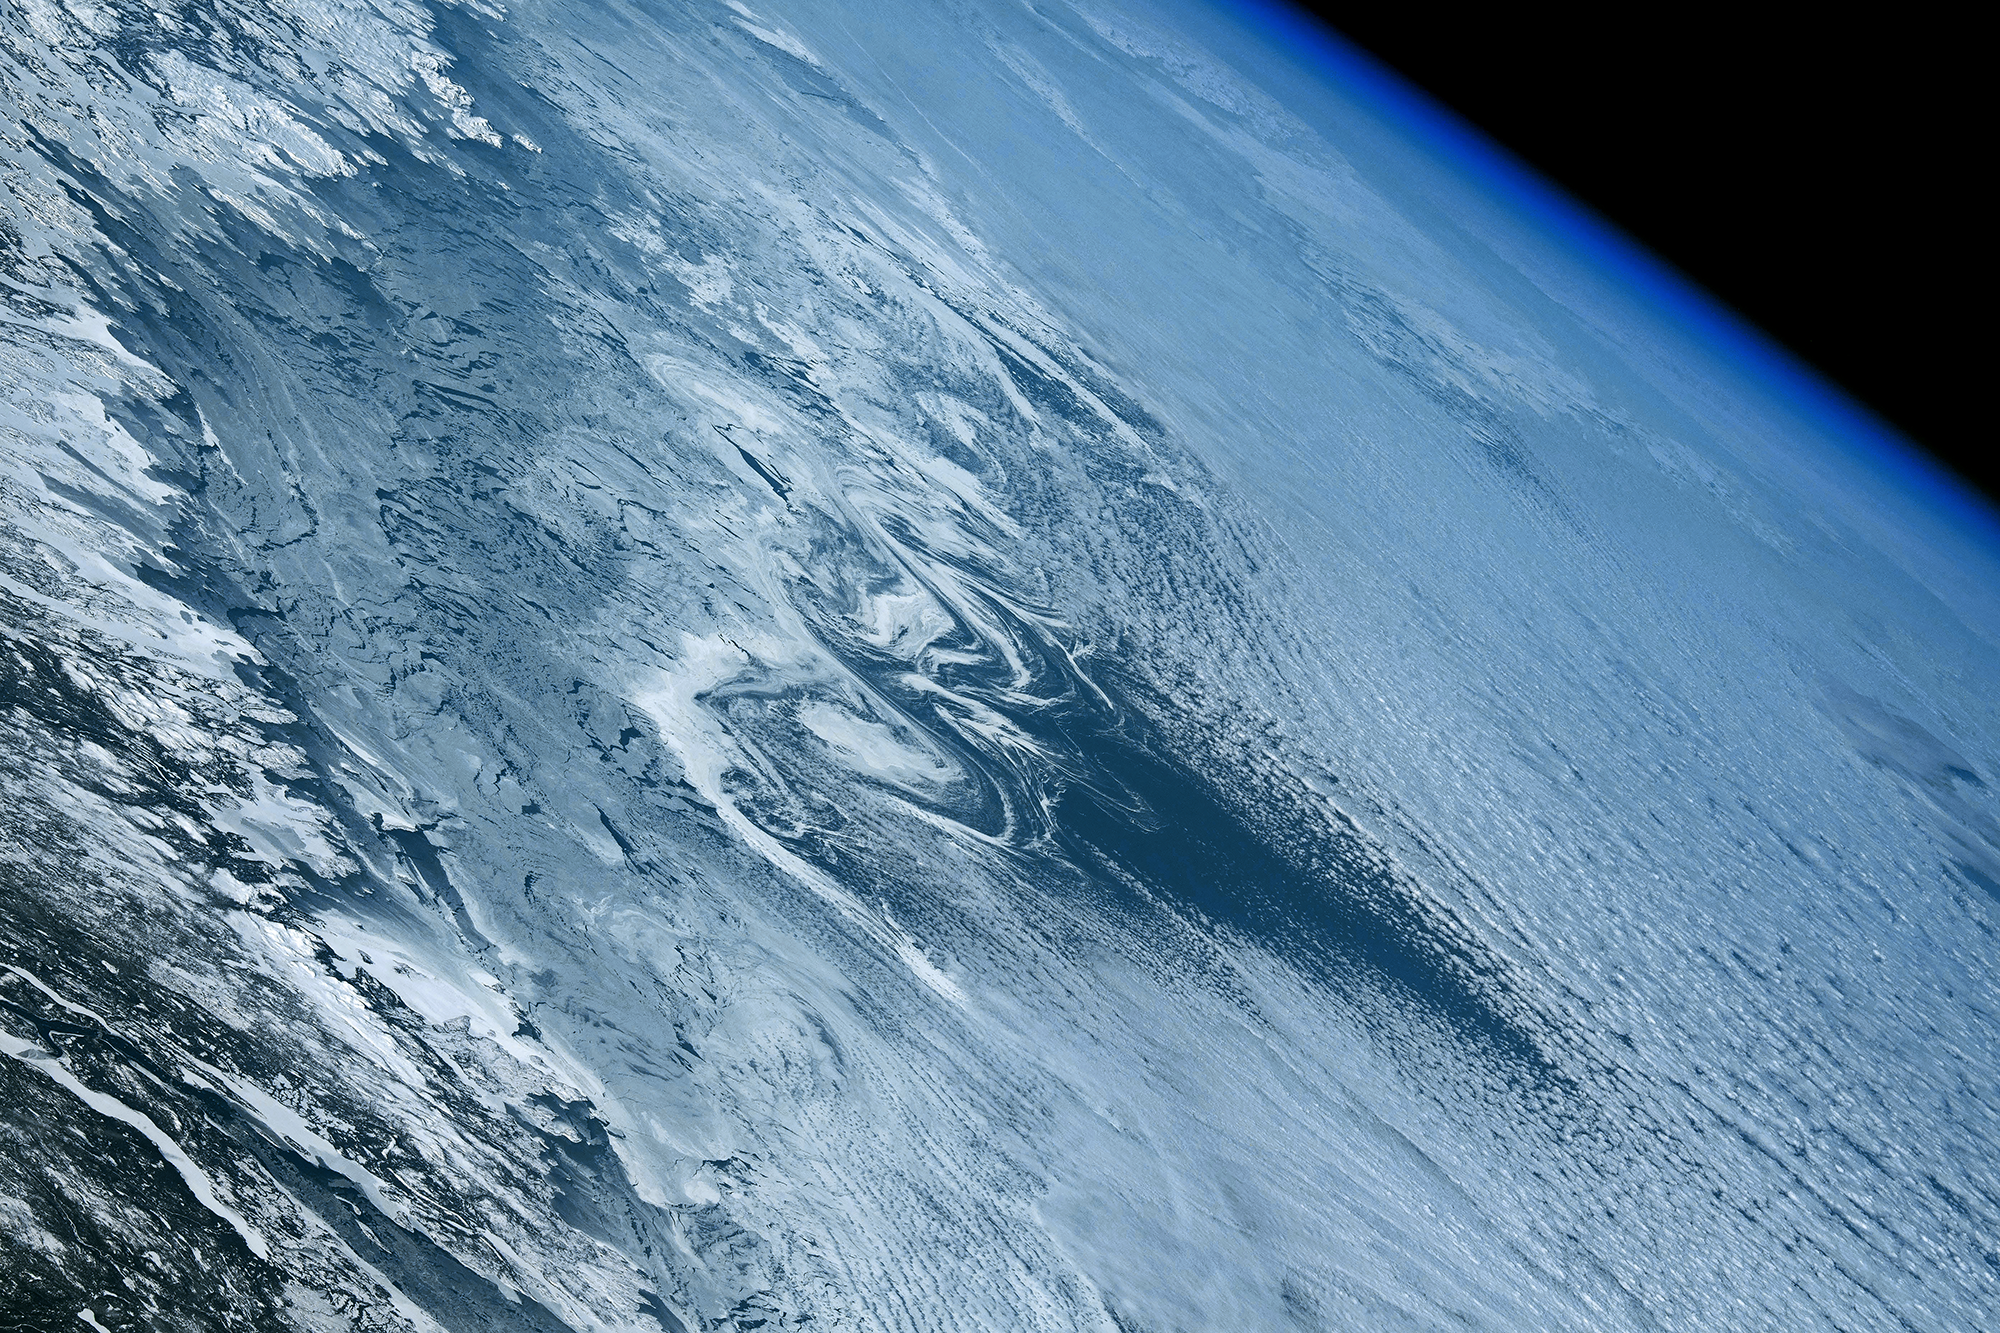
    In February 2024, the North Atlantic’s sea ice reached its furthest extent of the season, limning the coastline with tens of kilometers of ice. These images — both capturing the Labrador coast on the same day — show the swirling patterns marking the wispy edges of ice field. In this region, the ice is likely following an eddy in the ocean below. Eddies like these can form along the edges where warm and cold currents meet. An ice eddy is particularly special, though, as the water must be warm enough to fragment the sea ice, but not so warm that it melts the smaller ice pieces. (Image credit: top – NASA, lower – M. Garrison; via NASA Earth Observatory)

    This satellite image shows sea ice off the Labrador coast, on the same day in February 2024.
    This satellite image shows sea ice off the Labrador coast, on the same day in February 2024.
  • Sea Ice Swirls

    Sea Ice Swirls

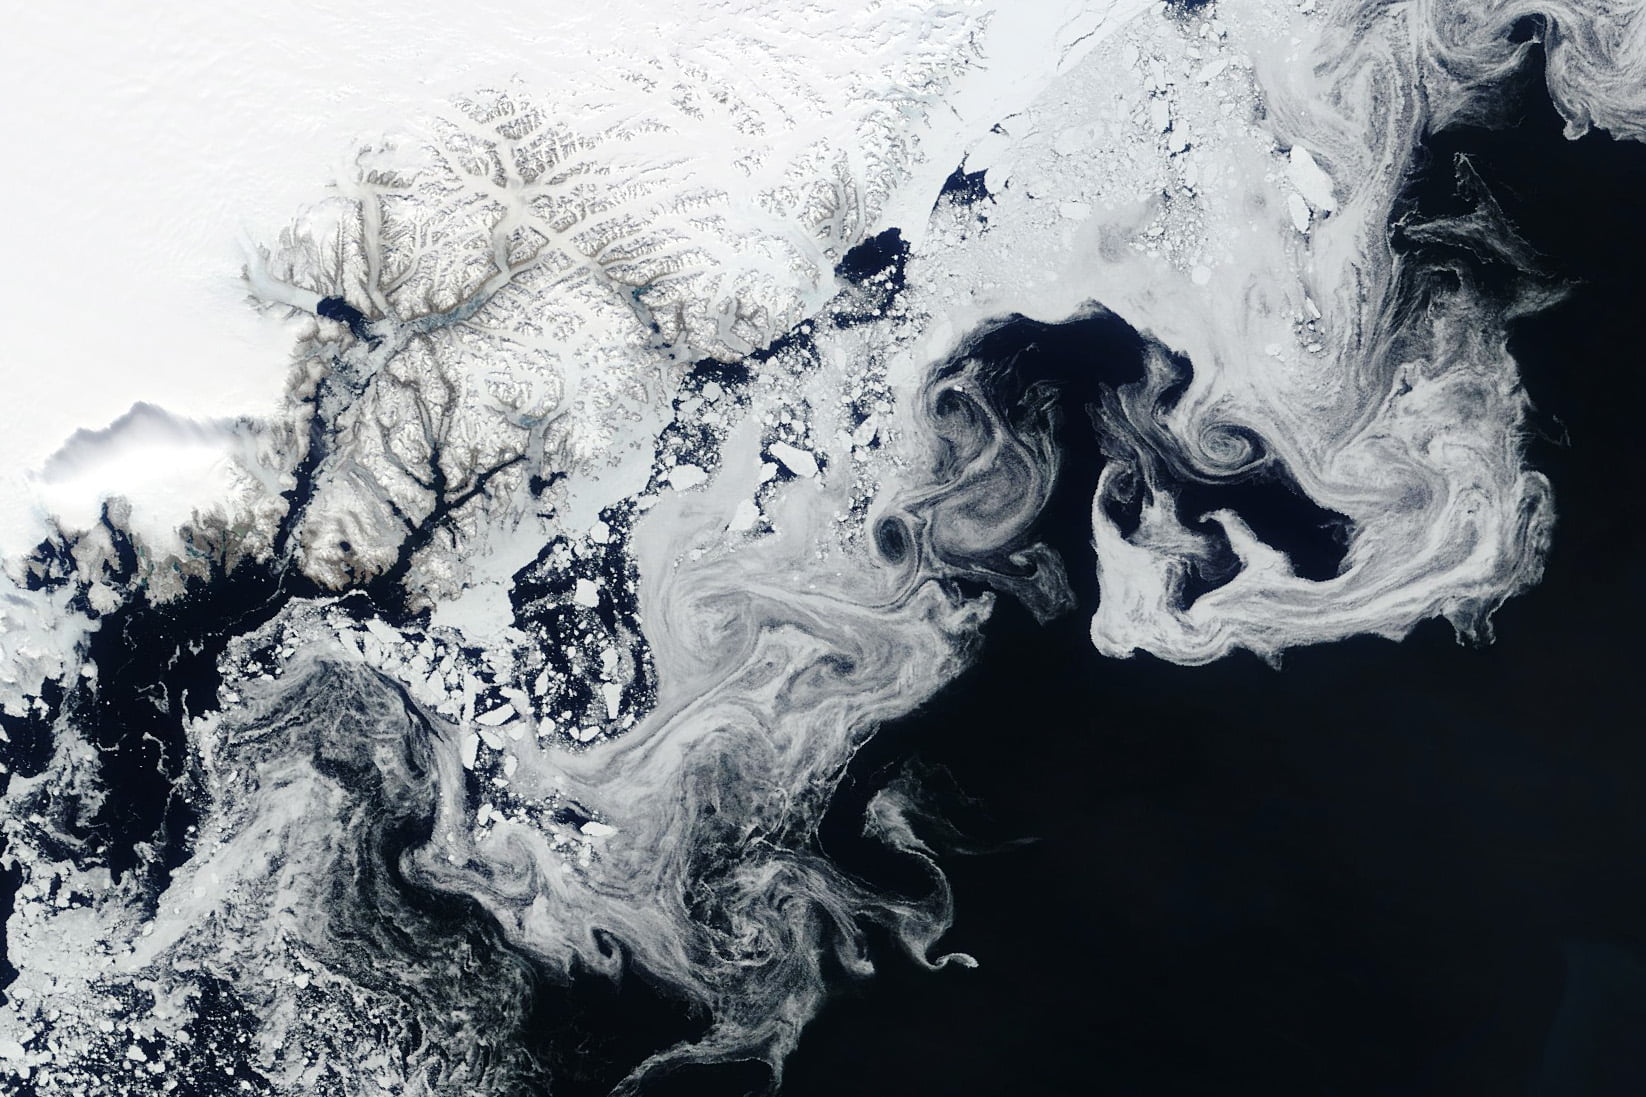
    Fragments of sea ice tumble and swirl in this satellite image of Greenland’s east coast. In spring, Arctic sea ice journeys down the Fram Strait between Greenland and Svalbard. Along the way, large ice floes break — and melt — into smaller pieces. Large pieces of sea ice are visible closer to the coastline, but the smaller individual floes get, the wispier they appear in the satellite image. In the haziest portions of the image, the ice may be only meters across. In recent years, less and less Arctic sea ice has survived the journey southward, shifting the temperature and salinity of Arctic contributions to global ocean circulation. (Image credit: W. Liang; via NASA Earth Observatory)

  • Erie Algal Bloom

    Erie Algal Bloom

    Blue-green algae bloom in Lake Erie’s summer conditions. Unfortunately for those looking to spend summer on the water, the dominant organism in this bloom produces a toxin that “can cause liver damage, numbness, dizziness, and vomiting.” Bloom season can last from late June into October, depending on the how many nutrients get washed into the lake and when wind mixes the lake water in the fall. A new hyperspectral instrument aboard NASA’s PACE spacecraft will identify bloom species from space, helping scientists track, understand, and predict blooms like these. (Image credit: W. Liang; via NASA Earth Observatory)

  • Slushy Snow Affects Antarctic Ice Melt

    Slushy Snow Affects Antarctic Ice Melt

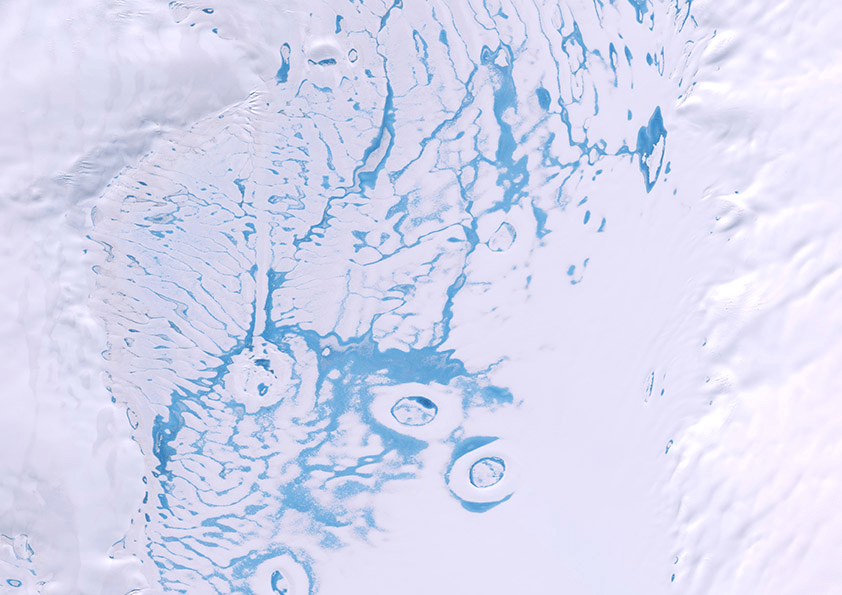
    More than a tenth of Antarctica’s ice projects out over the sea; this ice shelf preserves glacial ice that would otherwise fall into the Southern Ocean and raise global sea levels. But austral summers eat away at the ice, leaving meltwater collected in ponds (visible above in bright blue) and in harder-to-spot slush. Researchers taught a machine-learning algorithm to identify slush and ponds in satellite images, then used the algorithm to analyze nine years’ worth of imagery.

    The group found that slush makes up about 57% of the overall meltwater. It is also darker than pure snow, absorbing more sunlight and leading to more melting. Many climate models currently neglect slush, and the authors warn that, without it, models will underestimate how much the ice is melting and predict that the ice is more stable than it truly is. (Image credit: Copernicus Sentinel/R. Dell; research credit: R. Dell et al.; via Physics Today)

  • Swirls of Green and Teal

    Swirls of Green and Teal

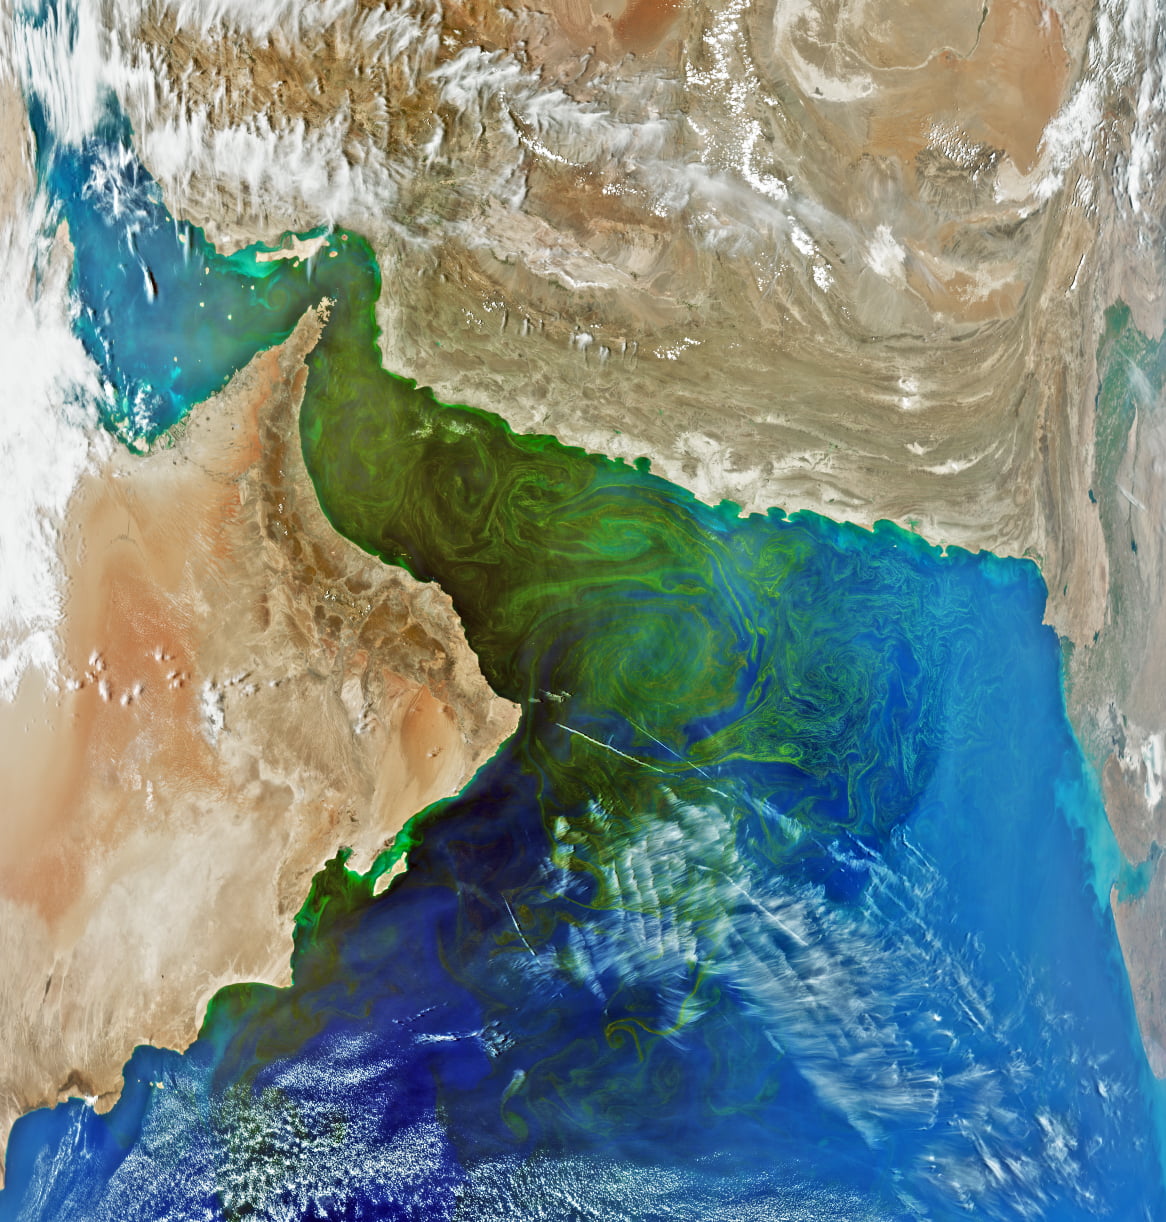
    Captured in March 2024, this satellite image of the Gulf of Oman comes from an instrument aboard the PACE spacecraft. The picture of a phytoplankton bloom is not quite natural-color, at least not as our eyes would see it. Instead, engineers combined data taken from multiple wavelengths and adjusted it to bring out the fine details. It’s not what we’d see by eye, but every feature you see here is real.

    Traditionally, the only way to identify the species of a phytoplankton bloom like this one is by taking a sample directly. But PACE’s instruments can detect hundreds of wavelengths of light, offering enough color detail that scientists may soon be able to identify and track phytoplankton species by satellite image alone. I wonder if distinguishing species could also provide some quantitative flow visualization from a series of these images. In the meantime, at least we can enjoy the view! (Image credit: J. Knuble; via NASA Earth Observatory)

  • Saharan Dust

    Saharan Dust

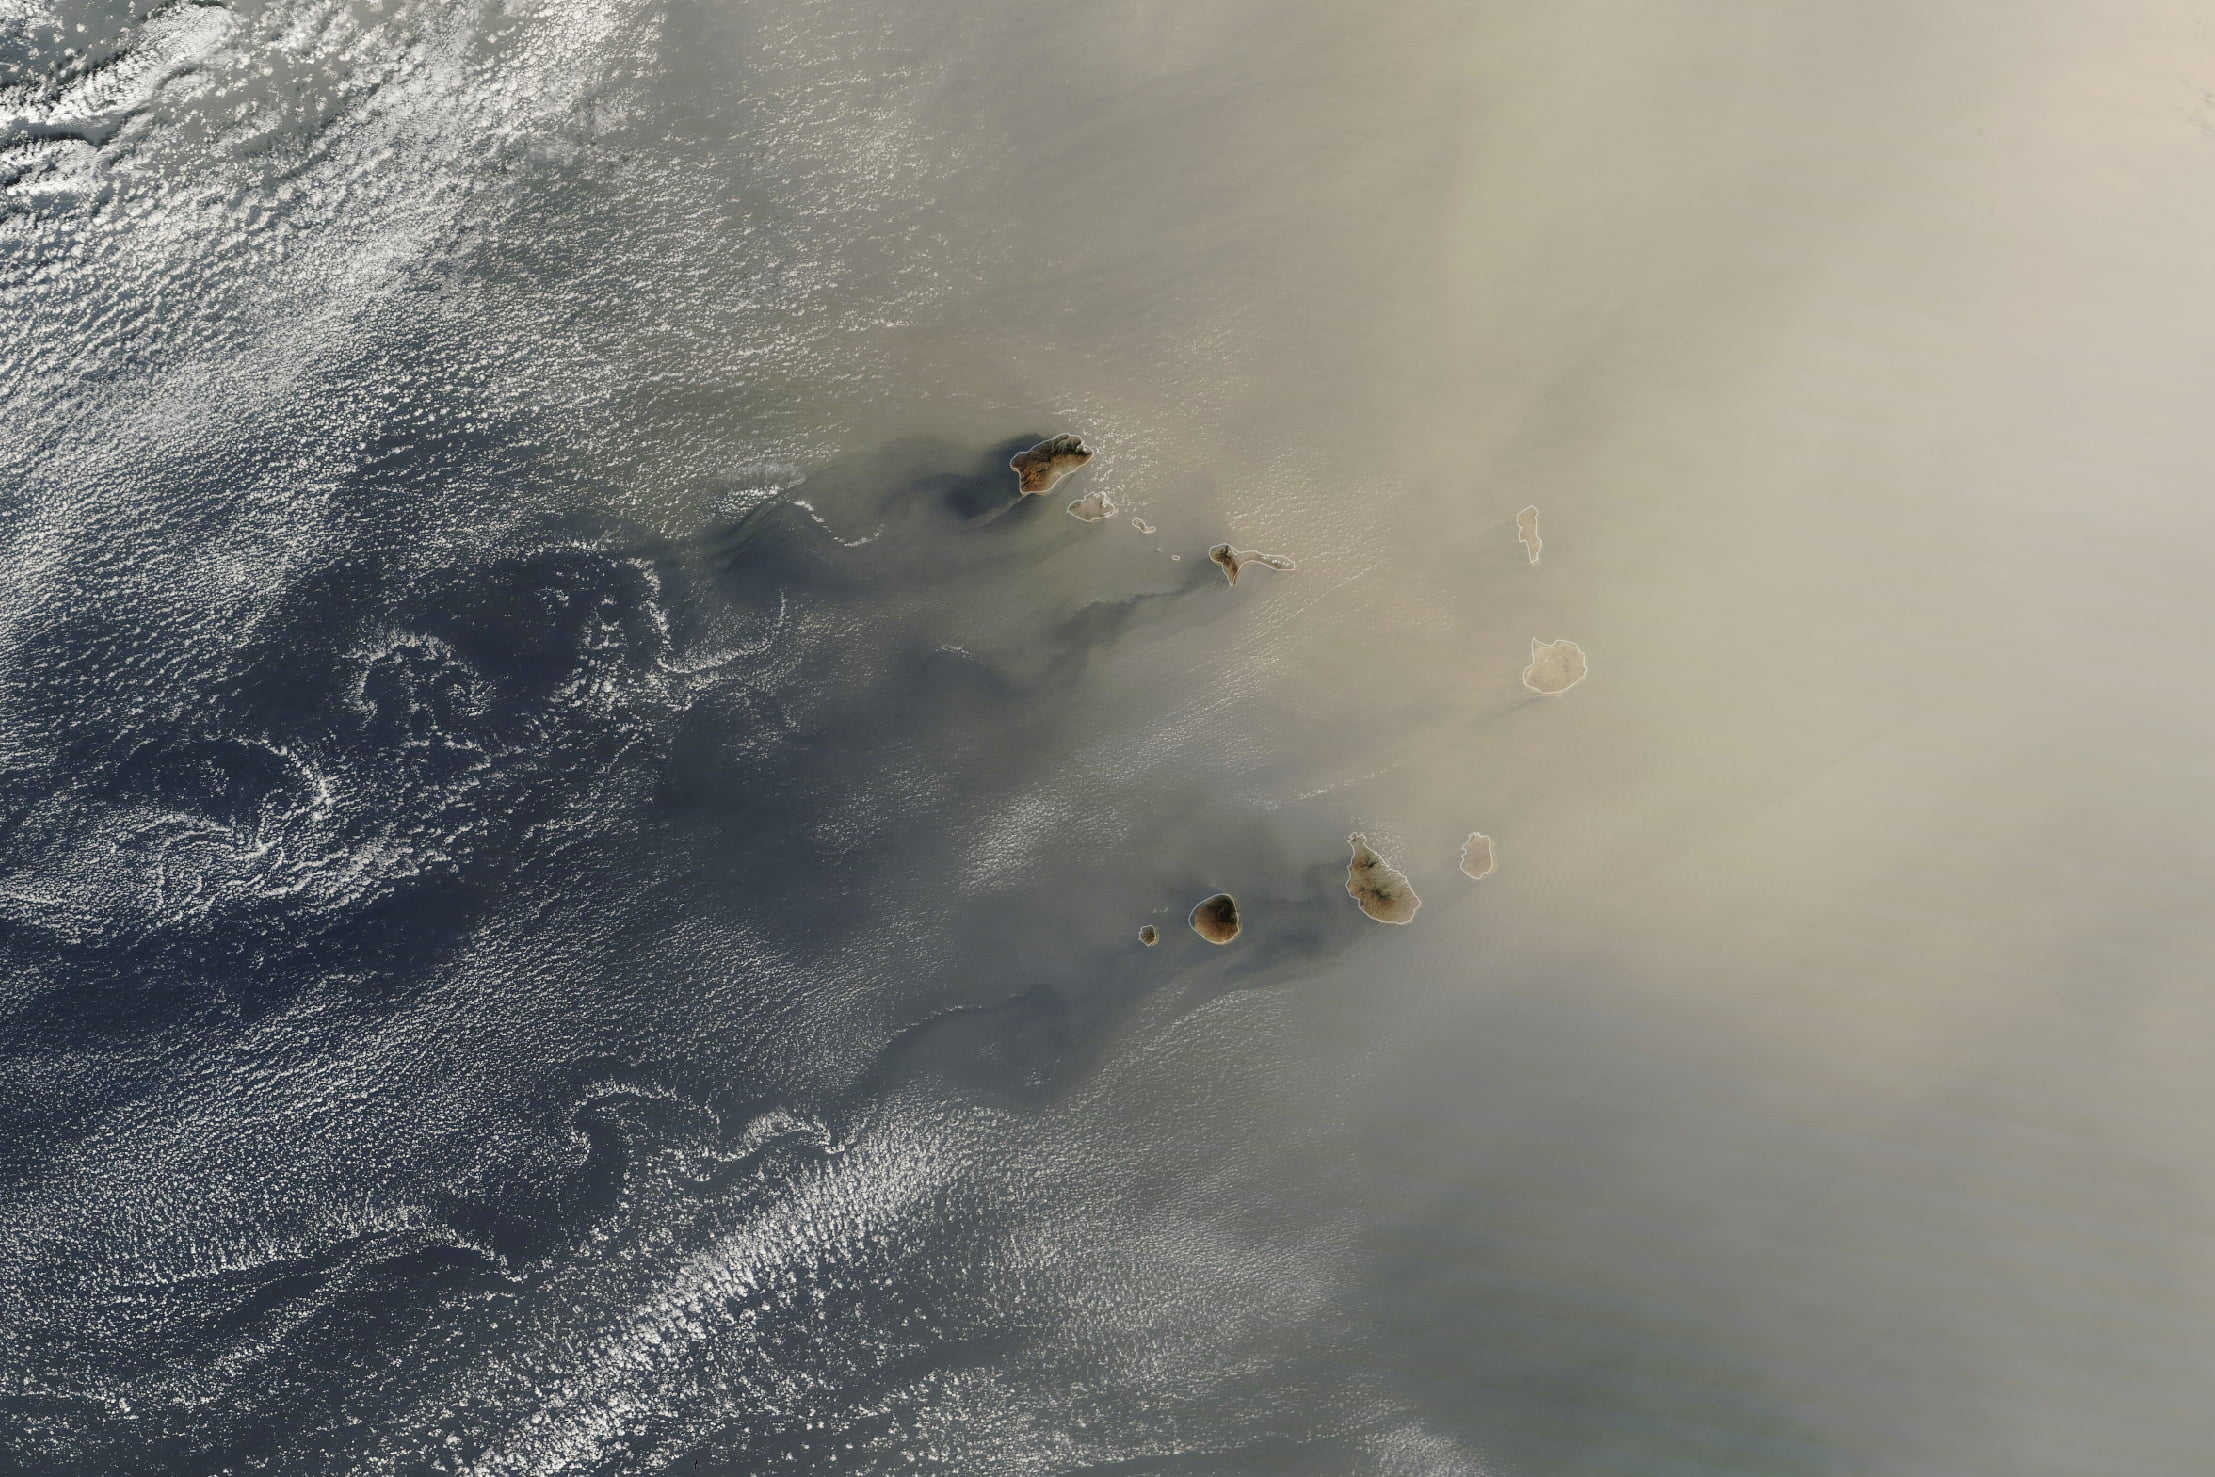
    In late January, dust from the Sahara blew westward toward the Cabo Verde archipelago before turning northward toward Europe. During winter and spring, Saharan dust tends to stay at lower altitudes, where it can be carried by the northeast trade winds. In contrast, from late spring to early fall, dust rises higher, carried westward by the Saharan Air Layer; there, the dust can help suppress both the formation and intensity of the Atlantic’s hurricanes.

    On the left side of the image scant clouds trace von Karman vortex streets behind the archipelago, marking the atmospheric disruption caused by the rocky islands. (Image credit: L. Dauphin; via NASA Earth Observatory)

  • Swirls Off South Australia

    Swirls Off South Australia

    Summer winds along Australia’s Bonney Coast push coastal waters offshore, triggering the upwelling of colder waters from depths below 300 meters. These cold waters from the deep are nutrient-rich, thanks to all the decomposition that happens along the ocean floor. The infusion of nutrients triggers an explosion of life, visible here in the form of a green phytoplankton bloom along the shelf break. In turn, the phytoplankton attract fish and blue whales. Even great white sharks are drawn to the cornucopia. (Image credit: W. Liang; via NASA Earth Observatory)

  • Seeding Clouds

    Seeding Clouds

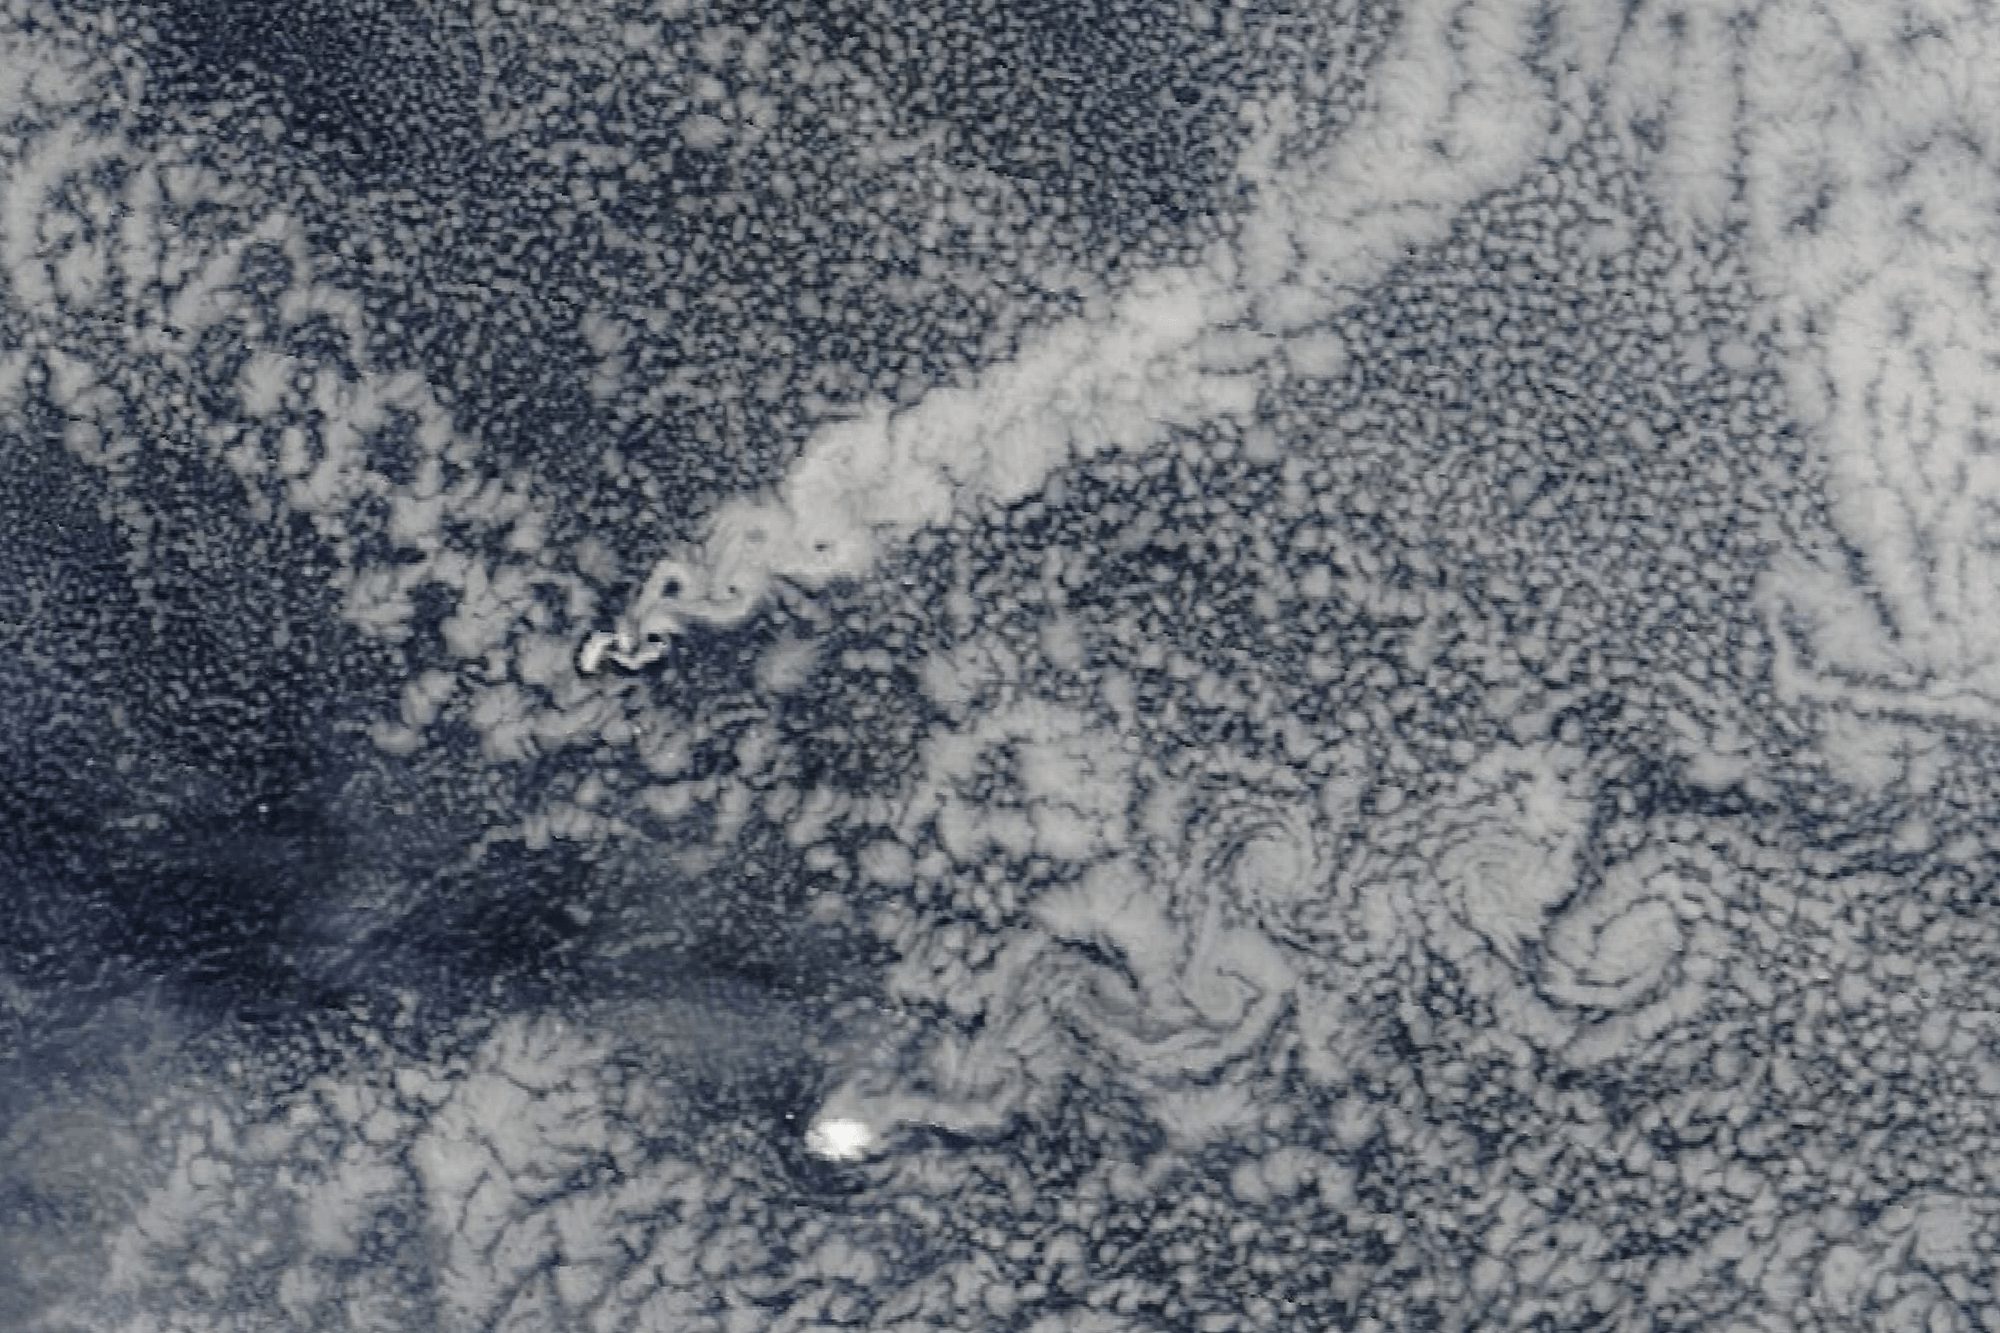
    In the remote South Atlantic, north of the Antarctic Circle, sit the volcanic Zavodovski and Visokoi islands. Though only roughly 500 and 1000 meters tall, respectively, each island disrupts the atmosphere nearby, often generating cloudy wakes. In today’s pair of images, the northerly Zavodovski has a particularly bright cloud wake, thanks to sulfate aerosols degassing from its volcano, Mount Curry. Though it’s hard to pick out the effect in the natural-color image above, the false-color version below shows the bright wake clearly. The filtering on this image turns snow and ice — like that on Visokoi’s peak — red and makes the water vapor of clouds white. The sulfates from Mount Curry act as nucleii for water droplets, forming many small, reflective drops that stand out against the rest of the sky. (Image credit: W. Liang; via NASA Earth Observatory)

    This false-color satellite image highlights the volcanic seeding by filtering snow and ice as red and water vapor in clouds as white.
    This false-color satellite image highlights the volcanic seeding by filtering snow and ice as red and water vapor in clouds as white.
  • Upwelling at Cabo Frio

    Upwelling at Cabo Frio

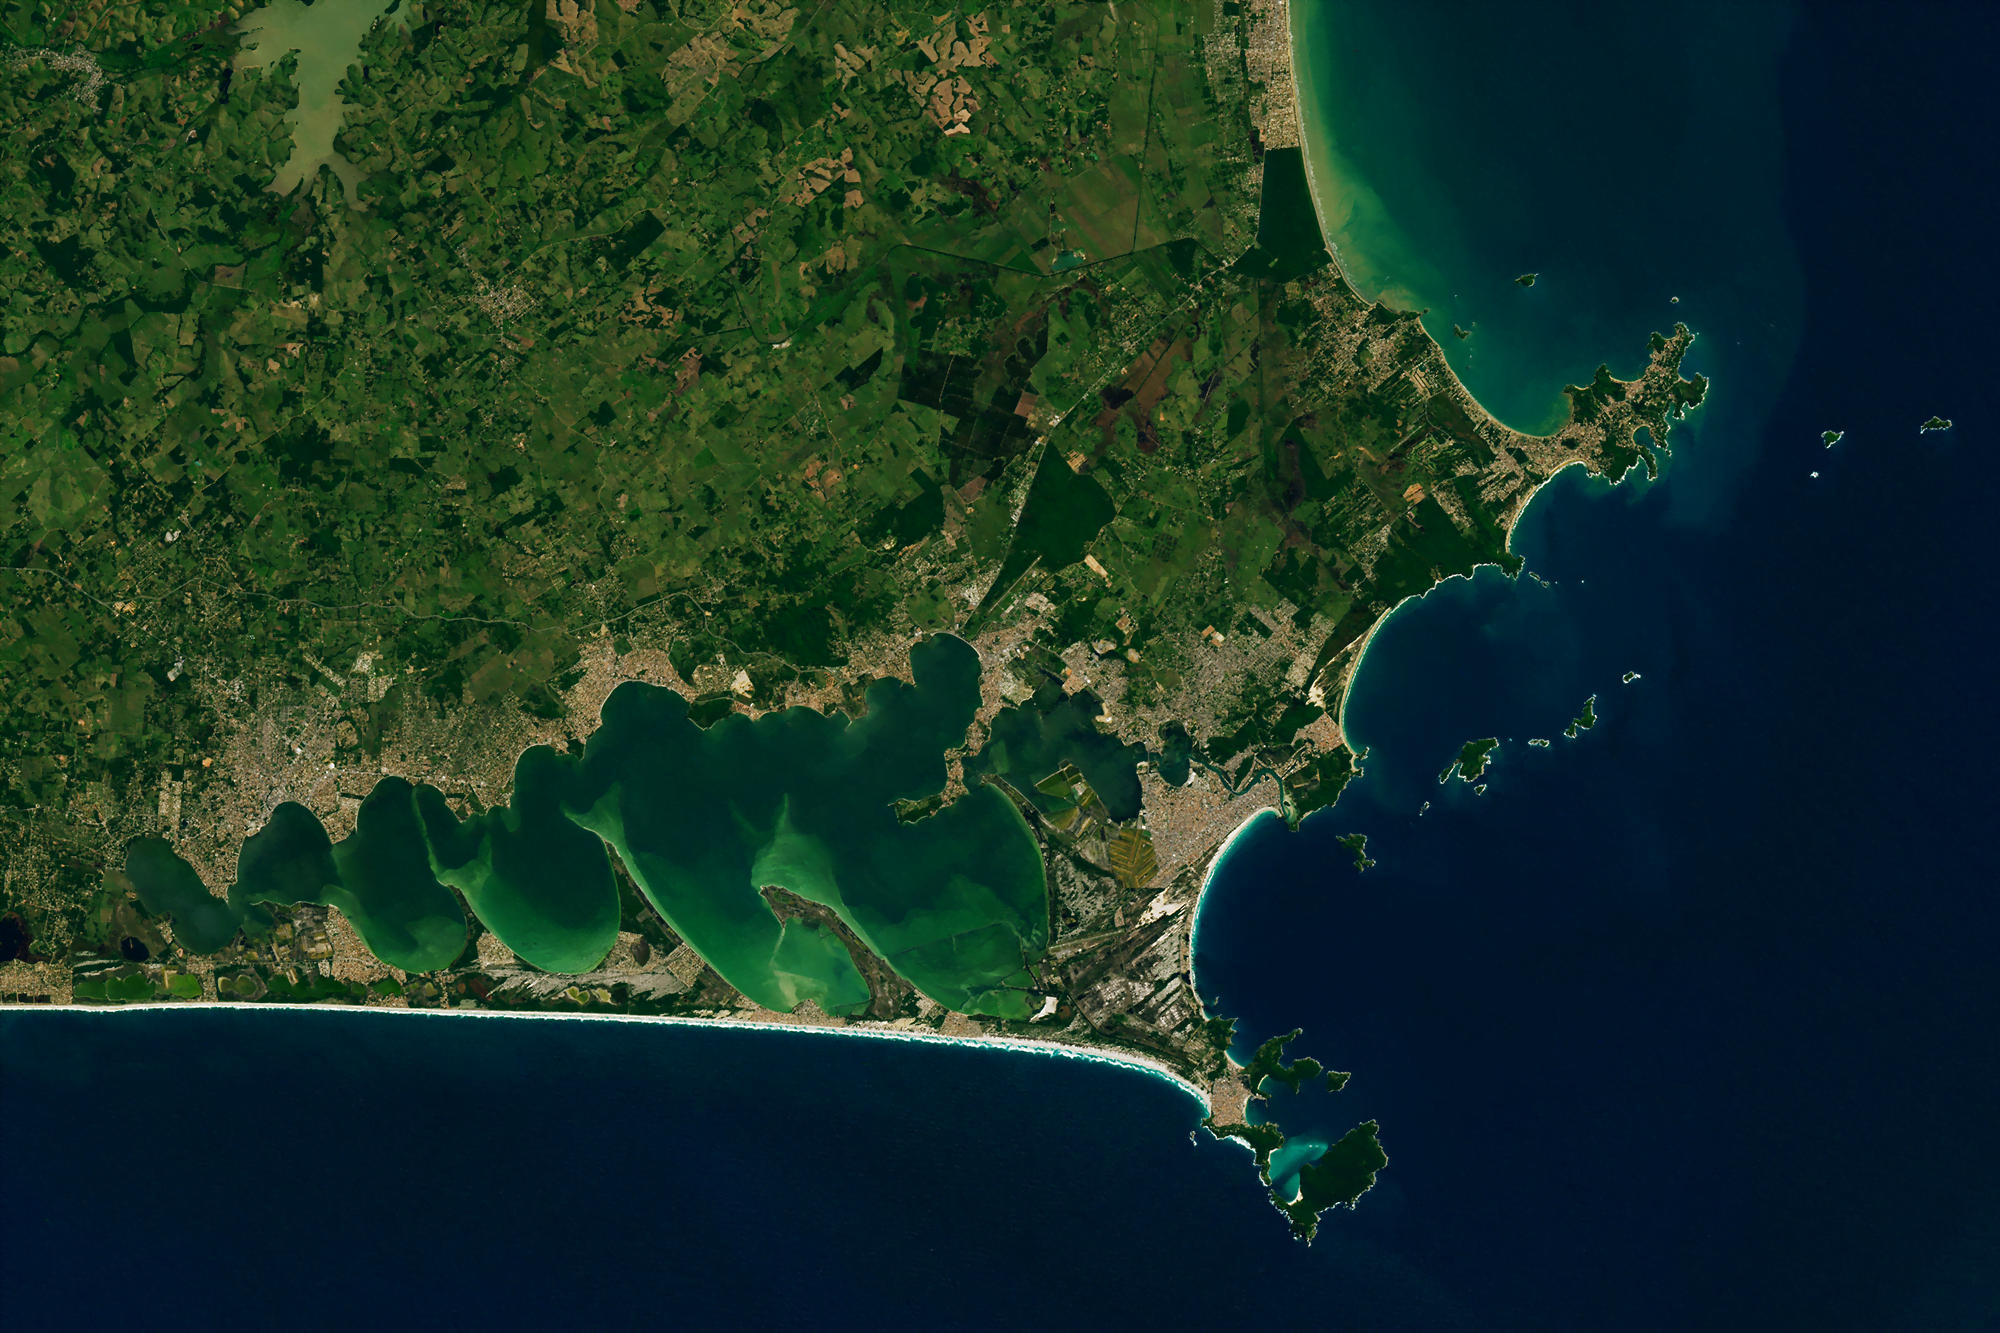
    The shores of the Brazilian state of Rio de Janeiro boast turquoise waters, white sands, and green lagoons, but European explorers discovered the waters around one promontory were unusually cold, leading to the name Cabo Frio. The chilly waters can be 8 degrees Celsius cooler than nearby surface temperatures, thanks to cold water upwelling near the coast. The upwelling is wind-driven; the dominant northeasterly winds push water out to sea, allowing colder waters to rise from the deep. (Image credit: L. Dauphin; via NASA Earth Observatory)

    A map of sea surface temperatures near Cabo Frio in Brazil.
    A map of sea surface temperatures near Cabo Frio in Brazil.
  • Fire in Ice

    Fire in Ice

    This false-color satellite image of Malaspina Glacier (Sít’ Tlein) is a riot of color. Composed of coastal/aerosol, near infrared, and shortwave infrared bands from Landsat 9, the colors highlight features otherwise hard to identify. Watery features appear in reds, oranges, and yellows; vegetation is green and rock appears in blue. The glacier covers more than 4000 square kilometers, an area larger than the state of Rhode Island. The dark lines atop the glacier are moraines, where rock, soil, and other debris has been scraped up along the glacier’s edge. Over time, changes in the glacier’s velocity cause the moraines to fold and shear, creating the zigzag pattern seen here. (Image credit: W. Liang; via NASA Earth Observatory)