Traditional weather forecasting models are physics-based and rely on supercomputers. Practically speaking, this means that they start from the basic governing equations (like the Navier-Stokes equations) and use approximations to model aspects of the problem in order to make the physics solvable, given constraints on time, computational power, spatial resolution, and so on.
So-called AI models approach the problem differently, training a model on past weather conditions in order to predict future weather. In some respects, this approach is very successful; AI-based models require less computational infrastructure to run and, in recent years, have greatly improved their predictions of everyday weather.
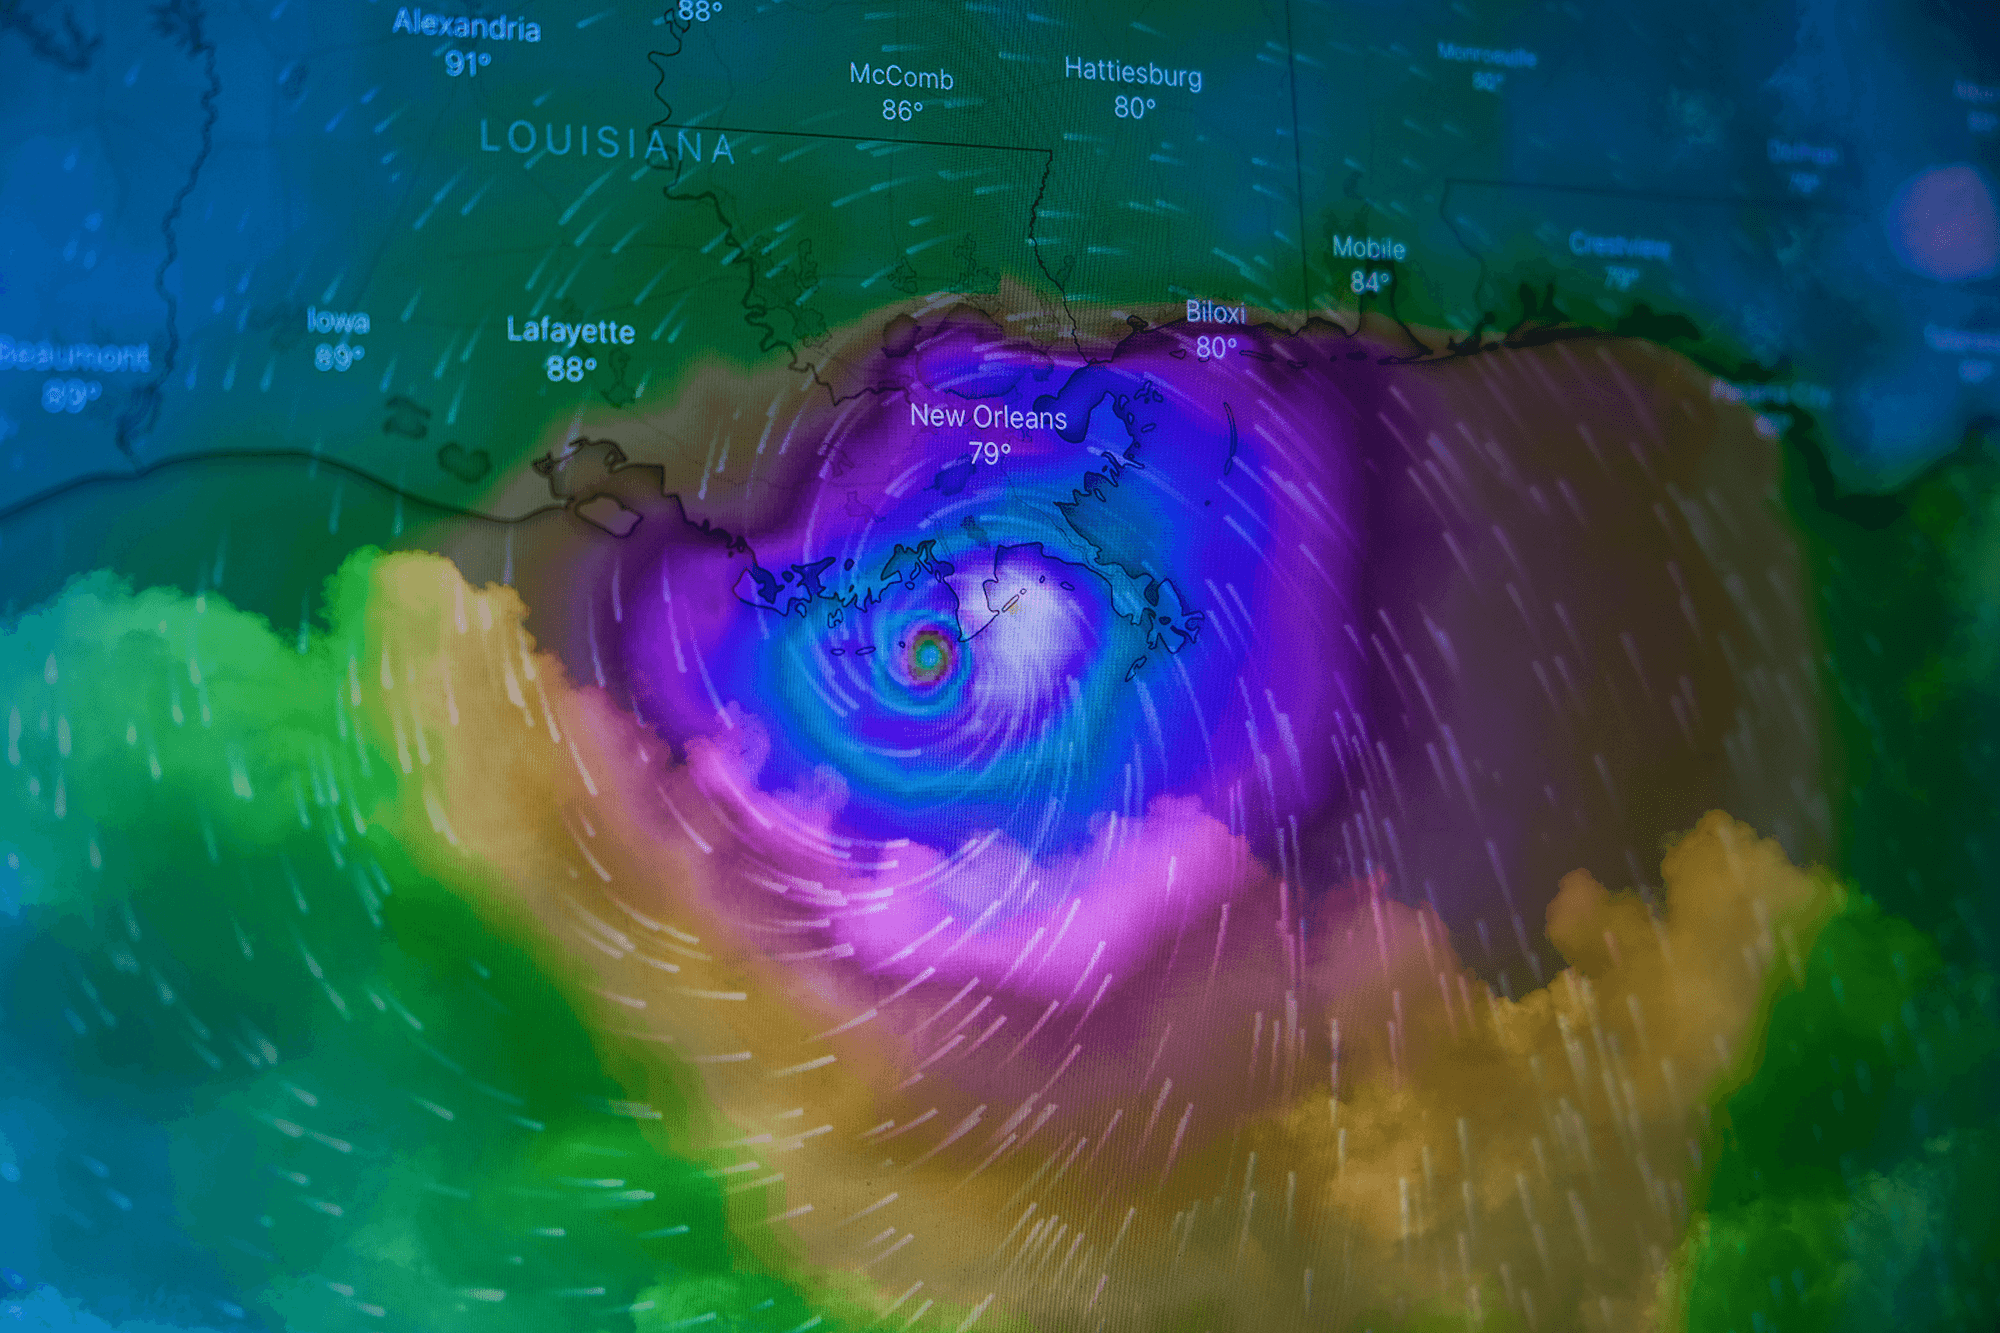
However, these AI models do poorly when predicting extreme weather events, because their training data contain relatively few examples of these events. They show limited ability to extrapolate their predictions to more extreme events. But these events–like the unprecedented 2021 heatwave in the Pacific Northwest or many of the Category 5 hurricanes we’ve seen in the last decade–are happening increasingly often due to climate change. Those events will keep happening, more frequently, as warming continues. Physics-based models can predict and forecast these events in ways that AI-based models fail to because they are limited by their trained experiences.
Researchers are working to find ways to better equip AI-based models with more physical sense, but, as these models proliferate, it’s important for their users (and those of us using their forecasts) to know what their current weaknesses are. (Image credit: B. McGowan; research credit: Y. Sun et al.; see also S. Nath and T. Palmer; via Gizmodo)


 in elevation--fared in the same storm.")