Fluorescent oil sprayed onto a model in the NASA Langley 14 by 22-Foot Subsonic Wind Tunnel glows under ultraviolet light. Airflow over the model pulls the initially even coat of oil into patterns dependent on the air’s path. The air accelerates around the curved leading edge of the model, curling up into a strong lifting vortex similar to that seen on a delta wing. At the joint where the wings separate from the body those lifting vortices appear to form strong recirculation zones, as evidenced by the spiral patterns in the oil. Dark patches, like those downstream of the engines could be caused by an uneven application of oil or by areas of turbulent flow, which has larger shear stress at the wall than laminar flow and thus applies more force to move the oil away. Be sure to check out NASA’s page for high-resolution versions of the photo. (Photo credit: NASA Langley/Preston Martin; via PopSci)
Tag: flow visualization

Fluids Round-up – 21 September 2013
First off, I’d like to give a special shout-out to FYFD’s friends at Pointwise, who were kind enough to invite me for a visit this week. For any readers looking for CFD grid-generation software, check them out; they are a fantastic bunch and very good at what they do.
My thanks again to everyone who donated this week to help get me to the APS conference. The campaign is still open if anyone wants to get in on the FYFD wallpapers and stickers on offer to donors. As a reminder, any funds beyond conference costs will go toward improving FYFD, including getting equipment to make FYFD videos. On to the fluids round-up!
- Wired takes us behind the scenes of the creation of Games of Thrones’ dragons. Believe it or not, the VFX team actually did digital simulations of the dragons flying in a wind tunnel.
- Nature dissects whether a submarine at relativistic speeds sinks or floats. (via io9) Note that Nature article says the submarine is in water but the original paper simply says that the submarine is immersed in a fluid and makes no account for the compressibility (or lack thereof) of that fluid.
- Add some excitement to your day with liquid-nitrogen-induced explosions from Distort (via io9).
- Flow Viz shows off a great picture of condensation-induced flow visualization on an airplane wing.
- Check out this awesome video of vibrating lycopodium powder from Susi Sie. (via io9)
- National Geographic considers whether Hawaii’s molasses spill is more or less environmentally damaging than an oil spill.
- Finally, our lead image shows a natural visualization of flow around a kayaker. The foam atop the water forms when air and water mix with the gas produced by decomposing leaves. The photo by Lucas Gilman appeared in Outside Magazine earlier this summer. (via Flow Visualization)
(Photo credit: L. Gilman)

Wind Tunnel Testing
Wind tunnel testing is an important step in designing new aircraft. This video shows footage of visualization tests of the 21-ft wingspan Boeing X-48C model in NASA Langley’s Full-Scale Tunnel. The X-48C is a blended wing body design capable of higher lift-to-drag ratios than conventional aircraft, which should lead to a higher range and greater fuel economy. The video shows some smoke visualization that illustrates airflow around the airfoil-shaped craft. The long probe sticking forward from the starboard wing is used to measure air pressure, angle of attack, and sideslip angle of the model. Notice how smoke from the wand is pulled from below the leading edge of the wing up and over the top of the wing. This is because there is lower pressure over the top of the wing than the bottom, and, like an electrical charge seeking the path of least resistance, fluids flow preferentially toward lower pressures. (Video credit: NASA Langley)
10 Years of Weather
This timelapse video captures the past 10 years’ worth of weather as seen by the GEOS-12 satellite during its service. It’s a mesmerizing look at the large-scale convective flow of Earth’s atmosphere. The prevailing winds for each region are clear from the motion of the clouds, but short-term effects are visible as well. June through November marks the Atlantic hurricane season, and you can see as storm after storm gets generated near western Africa and shoots westward toward North and Central America. You can also see the pattern tracks of these storms in these maps, which show 170 years’ worth of worldwide hurricane tracks. (Video credit: NOAA; via Scientific American)
Ski Jumping Aerodynamics
Last summer we featured fluid dynamics in the Summer Olympics and there’s more to come for Sochi. Winter athletes like ski jumper Sarah Hendrickson are hard at work preparing, which can include time in wind tunnels, as shown here. There are two main diagnostics in tests like these: drag measurements and smoke visualization. The board Hendrickson stands on is connected to the tunnel’s force balance, which allows engineers to measure the differences in drag on her as she adjusts equipment and positions. This gives a macroscopic measure of drag reduction, and reduced drag makes the skier faster on the snow and lets her fly longer in the jump. The smoke wand provides a way to visualize local flow conditions to ensure flow remains attached around the athlete, which also reduces drag. (Video credit: Red Bull/Outside Magazine; submitted by @YvesDubief)
Rebounding Off Dry Ice
Droplet rebound is frequently associated with superhydrophobic surfaces but can also be generated by very large temperature differences. For very hot substrates, a thin layer of the drop vaporizes on contact via the Leidenfrost effect and helps a drop rebound by preventing it from wetting the surface. This video shows almost the opposite: a water droplet hitting solid carbon dioxide (-79 degrees C). Upon contact, the solid carbon dioxide sublimates, creating a thin layer of gas that separates the droplet from the surface. You can also see the vortex ring that accompanies the drop’s impact. Water vapor near the carbon dioxide surface has condensed into tiny airborne droplets that act as tracer particles that reveal the vortex’s formation and the rebounding droplet’s wake. (Video credit: C. Antonini et al.; Research paper)

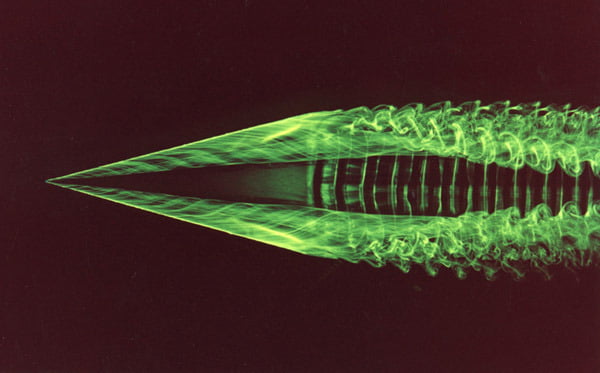
Flow Over a Delta Wing
Fluorescent dye illuminated by laser light shows the formation and structure of vortices on a delta wing. A vortex rolls up along each leading edge, helping to generate lift on the triangular wing. As the vortices leave the wing, their structure becomes even more complicated, full of lacy wisps of vorticity that interact. Note how, by the right side of the photo, the vortices are beginning to draw closer together. This is an early part of the large-wavelength Crow instability. Much further downstream, the two vortices will reconnect and break down into a series of large rings. (Photo credit: G. Miller and C. Williamson)
“Perpetual Puddle Vortex Experiment”
Anthony Hall’s “Perpetual Puddle Vortex Experiment” is an intriguing display of several physical mechanisms. What looks like a puddle is actually a vortex constantly sucking fluid down a hole in the table. The liquid is re-circulated into the puddle so it never disappears. The table itself is treated to be hydrophobic, causing the distinctive curvature and large contact angle of the puddle’s rim. The oils mixed in float on top, creating patterns of foam that visualize the swirling motions of the fluid as the vortex pulls it in. (Video credit and submission by: A. Hall)

Sedimentary Swirls
Local currents swirl sediments and phytoplankton blooms in this satellite image of the Tarut Bay in Saudi Arabia. Such blooms typically occur where nutrients are being washed together, thereby creating a kind of natural flow visualization of currents and matter flow in the ocean. (Photo credit: NASA Earth Observatory)

Flow Around a Complex Airfoil
Flow around an airfoil with a leading-edge slat is visualized above. At this Reynolds number, alternating periodic vortices are shed in its wake. Understanding how multi-element airfoils and control surfaces affect local flow is important in controlling aircraft aerodynamics. When multiple instabilities interact–like those in the wing’s boundary layer interacting with the wake’s–it can generate disturbances that are problematic in flight. Being able to predict and avoid such behavior is important for safe aircraft. (Photo credit: S. Makiya et al.)