Hospital-acquired infections are a serious health problem. One potential source of contamination is through the spread of pathogen-bearing droplets emanating from toilet flushes. The video above includes high-speed flow visualization of the large and small droplets that get atomized during the flush of a standard hospital toilet. Both are problematic for the spread of pathogens; the large droplets settle quickly and contaminate nearby surfaces, but the small droplets can remain suspended in the air for an hour or more. Even more distressing is the finding that conventional cleaning products lower surface tension within the toilet, aggravating the problem by allowing even more small droplets to escape. To learn more, see the Bourouiba research group’s website. (Video credit: Bourouiba research group)
Tag: flow visualization

Pathlines vs. Streaklines
When considering fluid motion, there are many ways to describe trajectories through the flow. One is the pathline, the trajectory followed by an individual fluid particle. Imagine releasing a rubber duck down a stream. Following the duck’s position over time would give you a pathline. Now imagine that instead of releasing a single rubber duck you release lots of them – say one every half-second from the exact same starting spot. You would end up with a line of rubber ducks stretching downstream, each of them sharing the same origin but with a different starting time. This is called a streakline. Would the streakline of rubber ducks follow the same trajectory as the lone duck? Not if the flow is time-varying! In fact, for unsteady flows, pathlines and streaklines can give completely different pictures of a flow, as illustrated in the video above. Knowing and understanding the difference between these types of trajectories is extremely important when it comes interpreting flow visualizations in unsteady flows because some visualization methods produce pathlines and others produce streaklines. (Video credit: V. Miller and M. Mungal)

Flow Behind a Cylinder
Flow over blunt bodies produces a series of alternating vortices that are shed behind an object. The image above shows the turbulent wake of a cylinder, with flow from right to left. Red and blue dyes are used to visualize the flow. This flow structure is known as a von Karman vortex street, named for aerodynamicist Theodore von Karman. The meander of the wake is caused by the shed vortices, each of which has a rotational sense opposite its predecessor. The rapid mixing of the two dyes is a result of the flow’s turbulence. In low Reynolds number laminar cases of this flow the structure of individual vortices is more visible. Similar flow structures are seen behind islands and in the wakes of flapping objects. (Photo credit: K. Manhart et al.)
Liquid Sculptures
[original media no longer available]
Water sculptures–a marriage of liquids, photography, and timing–are spectacular form of fluid dynamics as art. Artist Markus Reugels is a master of the form. This video captures the life and death of such water sculptures at 2,000 fps, beginning with the fall of the initial blue droplet. The droplet’s impact causes a rebounding Worthington jet, which reaches its pinnacle just as a second droplet strikes. The impact spreads into an umbrella-like skirt consisting of a thin, expanding liquid sheet with a thicker rim. The rim itself is unstable, breaking into regularly spaced filaments and tiny satellite droplets that shoot outward before the entire structure collapses into the pool. One especially cool aspect of watching this in video is seeing how the blue dye from each droplet spreads as the water splashes and rebounds. You can see the set-up Reugels uses for his photography here. (Video credit: M. Reugels and L. Lehner)

How Erosion Shapes a Flow
Erosion creates all manner of strange shapes as wind and water cut away at solids. But why does the interaction of the fluid and solid result in the geometries we observe? Above is a collage from an experiment in which a soft clay sphere was immersed in a water tunnel. After 70 minutes, the sphere had worn into a roughly conical body (Image A) reminiscent of a re-entry capsule. Images B and C show instantaneous streaklines around the clay at 10 minutes and 70 minutes, respectively. Images D and E show diagrams of the flowfield seen in B and C. Fast-moving flow above and below the stagnation point (SP) wears the front of the body into a conical shape, whereas the recirculating vortices aft of the separation point (SL) create a sloped shoulder and flattened back in the clay. The results are consistent with a model in which erosion tries to create uniform shear stress at the solid surface – essentially the process is keeping the frictional force between the fluid and air constant along the surface. This makes sense. If a region’s shear stress is higher, it will be worn more quickly than the surrounding solid, causing it to recede and experience decreased shear stress (relative to the surrounding area) as a result. (Image credit: L. Ristroph et al.)

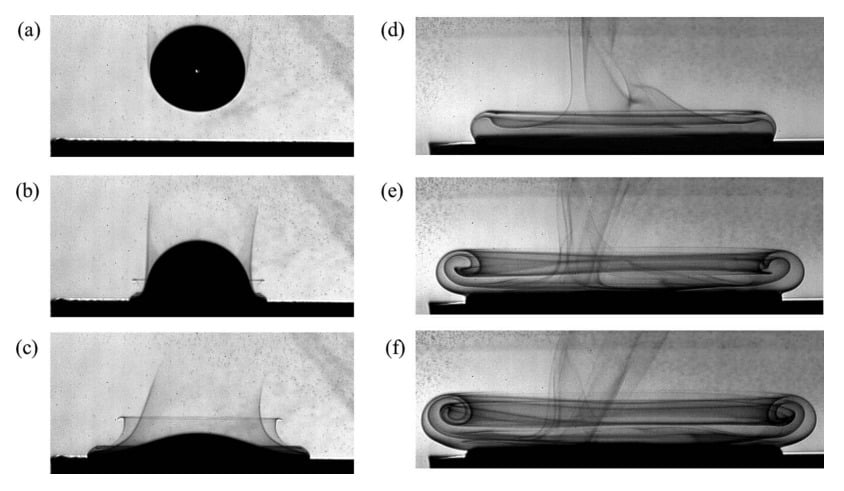
The Vortex Under a Falling Drop
We take for granted that drops which impact a solid surface will splash, but, in fact, drops only splash when the surrounding air pressure is high enough. When the air pressure is low enough, drops simply impact and spread, regardless of the fluid, drop height, or surface roughness. Why this is and what role the surrounding air plays remains unclear. Here researchers visualize the air flow around a droplet impact. In (a) we see the approaching drop and the air it pulls with it. Upon impact in (b) and © the drop spreads and flattens while a crown of air rises in its wake. The drop’s spread initiates a vortex ring that is pinned to the drop’s edge. In later times (d)-(f) the vortex ring detaches from the drop and rolls up. (Photo credit: I. Bischofberger et al.)

Mixing Flows
Turbulence is an excellent mixer. Here two fluorescent dyes are injected into a turbulent water jet. Flow is from the bottom of the image toward the top. The dyes are quickly mixed into the background fluid by momentum convection, their concentration decreasing with increased distance from the source. Large-scale structures like the eddies visible in this image drive this convection of momentum in turbulent flows. In contrast, consider laminar flows, where momentum and molecular diffusion dominate how fluids move. In such laminar flows, it’s even possible to unmix two fluids, a feat that cannot be accomplished in the jet above. (Photo credit: M. Kree et al.; via @AIP_Publishing)
Schlieren in Flight
Schlieren photography is a common method of visualizing shock waves in wind tunnel experiments, but it’s much harder to pull off for aircraft in the sky. This video from NASA shows off some stunning work out of NASA Dryden capturing schlieren video of shock waves from a F-15B aircraft at Mach 1.38. You’ll notice that shock waves extend off the nose, wings, tail, and other parts of the airplane and extend well beyond the camera’s field of view. It’s these shock waves hitting the ground level that causes distinctive sonic booms. These tests are part of NASA’s on-going research into minimizing the effects of sonic boom so that civilian supersonic flight over land is feasible in the future. When the U.S. government shutdown ends, you’ll be able to learn more about this work at NASA Dryden’s GASPS page. (Video credit: NASA Dryden)

Dynamic Stall
In nature, birds and other flying animals often use unsteady flow effects to enhance the lift their wings generate. When a wing sits at a high angle of attack, it stalls; the flow separates from the upper surface, and its lift force is suddenly lost. If, on the other hand, that wing is in motion and pitching upward, lift is maintained to a much higher angle of attack. The reason for this is shown in the flow visualization above. This montage shows a rectangular plate pitching upwards. Flow is left to right. Each row represents a specific angle of attack and each column shows a different spanwise location on the plate. As the plate pitches upward, a vortex forms and grows on the leading edge of the plate. Eventually, the leading-edge vortex separates, but not until a much higher angle of attack than the plate could sustain statically. This effect allows birds to maintain lift during perching maneuvers and is also key to helicopter rotor dynamics. (Image credit: K. Granlund et al.)

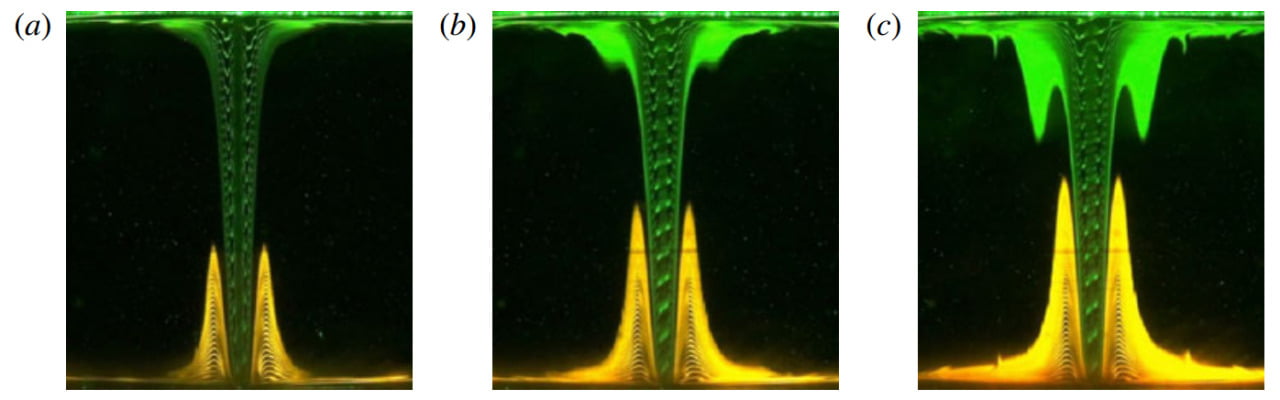
The Bathtub Vortex
If you’ve ever watched a swirling vortex disappear down the drain of your bathtub and wondered what was happening, you’ll appreciate these images. This dye visualization shows a one-celled bathtub vortex, created by rotating a cylindrical tank of water until all points have equal vorticity before opening a drain in the bottom of the tank. A recirculating pump feeds water back in to keep the total fluid mass constant. Once a steady vortex is established, green dye is released from the top plate of the tank and yellow dye from the bottom. The green dye quickly marks the core of the vortex. Ekman layers–similar to the boundary layers of non-rotating flows–form along the top and bottom surfaces, and the yellow dye is drawn upward in a region of upwelling driven by Ekman pumping. (Photo credit: Y. Chen et al.)
Just a reminder for those at Texas A&M University: I will be giving a talk today Wednesday, October 2nd entitled “The Beauty of the Flow” as part of the Applied Mathematics Undergraduate Seminar series at 17:45 in BLOC 164.