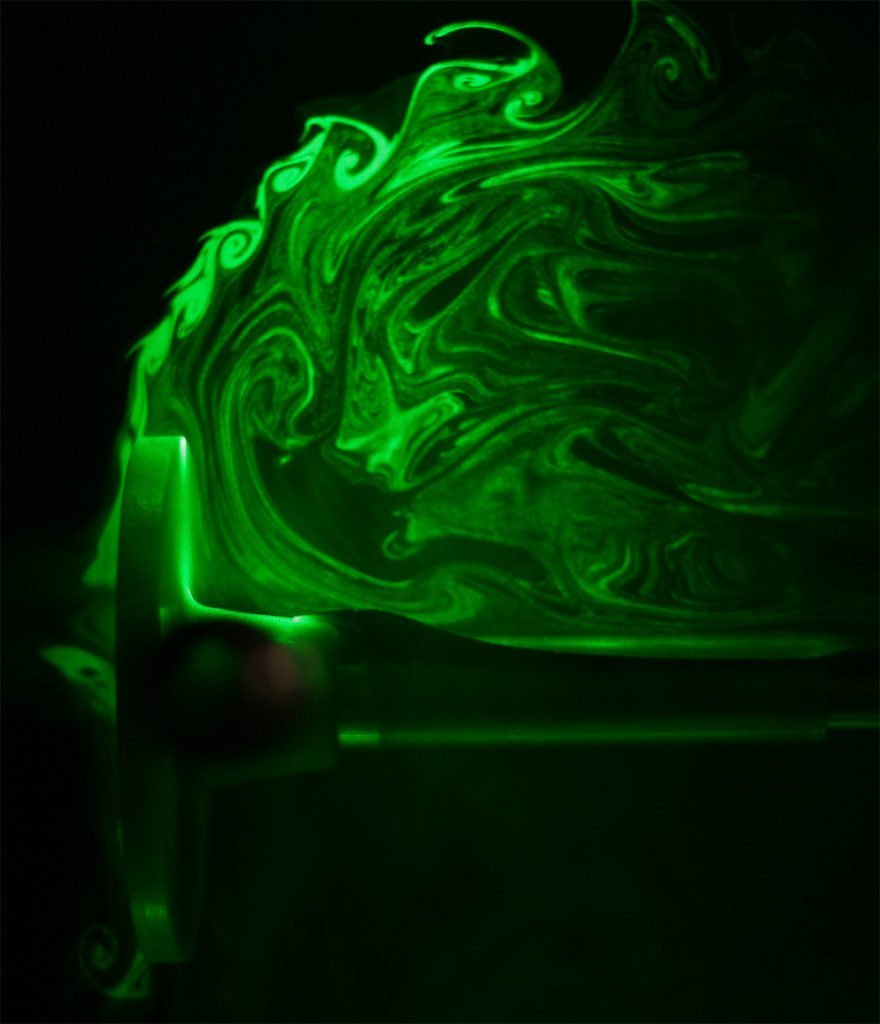
The human eye has a thin tear film over its surface to maintain moisture and provide a smooth optical surface. The film consists of multiple layers: a lipid layer at the air interface to decrease surface tension and delay evaporation; an aqueous middle layer; and an inner layer of hydrophilic mucins that keep the film attached to the eye. The entire film is a few microns thick, with the lipid layer estimated to be only 50-100 nm thick and the mucin layer just a few tenths of a micron. The aqueous portion of the tear film is supplied from the lacrimal gland in the corner of the eye. In the animation above, the fresh aqueous fluid is fluorescent. It gathers in the corner of the eye several seconds after a blink due to reflex tearing. The tear fluid then flows around the outer edges of the eye until the subject blinks and the fresh tear gets distributed throughout the film. (Research credit: L. Li et al.; original video)
Tag: flow visualization

Advantages of Schooling

Many fish swim in close proximity to one another in large schools, causing scientists to wonder if this behavior is motivated primarily by defense against predators or whether fish derive some hydrodynamic advantages from schooling. Examining the fluid dynamics of an entire school of fish is rather impractical, so researchers approximate two neighboring swimmers using flapping hydrofoils. The images above show flow visualizations of the wakes of these two mechanical swimmers. When the two hydrofoils flap in-phase with one another (top image), one oscillation period produces a complicated pattern of many vortices zig-zagging behind the foils. This configuration produces more efficient propulsion than a single hydrofoil, meaning that more of the energy in the wake is used to produce thrust. The cost, however, is reduced thrust overall. The bottom image shows the wake pattern for hydrofoils flapping out-of-phase. This behavior enhanced thrust without reducing propulsive efficiency. The results suggest that schooling fish might choose different swimming strategies depending on the situation. (Image credits: P. Dewey et al.)

Putting Out Wildfires Using Explosives

Wildfires damage millions of acres of land per year in the United States alone. Using explosives to put out an uncontrolled wildfire sounds a bit crazy, but it’s actually not that far-fetched. The animations above are taken from high-speed footage of a propane fire interacting with a blast wave. The first animation shows what the human eye would see, and the second is a shadowgraph video, a technique which highlights differences in density and makes the flame’s convection and the blast wave itself visible. At close range, the shock wave from the explosion and the high-speed gas behind it push the flames away from their fuel source, stopping combustion almost immediately. For a flame farther away from the blast, the shock wave introduces turbulent disturbances that can destabilize the flame. Much work remains to be done before the technique could be scaled from the laboratory to the field, but it is an exciting concept. You can read more about the work here. (Research credit: G. Doig/UNSW Australia; original videos: here and here; submitted by @CraigOverend)

Separating Flow
Flow separation occurs when a fluid is unable to flow smoothly around an object. In the case of the photo above, fog is being used to visualize flow around an airfoil at a large negative angle of attack. The incoming flow stagnates at a point on top of the airfoil, and streamlines on either side of that point split to move around the airfoil. Those on top are accelerated to high velocity, generating smooth, low-pressure flow over the aft section of the upper surface. On the other side of the stagnation point, however, the fog is trying to flow around the curve of the leading edge but the local pressure gradient is increasing, which slows the flow. Ultimately, it separates from the airfoil, creating a large region of recirculating, turbulent flow. When this effect occurs on the upper surface of a wing at a high (positive) angle of attack, it is called stall and causes a dramatic loss in lift. (Photo credit: Wikimedia/Smart Blade GmbH)

May the Fourth Be With You
It only seems appropriate to share this little bit of schlieren photography today. May the Fourth be with you all. (Video credit: M. Hargather and J. Miller)

Growing Turbulence

Flow patterns can change dramatically as fluid speed and Reynolds number increase. These visualizations show flow moving from left to right around a circular plunger. The lower Reynolds number flow is on the left, with a large, well-formed, singular vortex spinning off the plunger’s shoulder. The image on the right is from a higher Reynolds number and higher freestream speed. Now the instantaneous flow field is more complicated, with a string of small vortices extending from the plunger and a larger and messier area of recirculation behind the plunger. In general, increasing the Reynolds number of a flow makes it more turbulent, generating a larger range of length scales in the flow and increasing its complexity. (Image credit: S. O’Halloran)
What Sound Looks Like
NPR’s Skunk Bear Tumblr has a great new video on the schlieren visualization technique. The schlieren optical set-up is relatively simple but very powerful, as shown in the video. The technique is sensitive to variations in the refractive index of air; this bends light passing through the test area so that changes in fluid density appear as light and dark regions in the final image. Since air’s density changes with temperature and with compressibility, the technique gets used extensively to visualize buoyancy-driven flows and supersonic flows. Since sound waves are compression waves which change the air’s density as they travel, schlieren can capture them, too. (Video credit: A. Cole/NPR’s Skunk Bear)

Wingtip Vortices
Newton’s third law says that forces come in equal and opposite pairs. This means that when air exerts lift on an airplane, the airplane also exerts a downward force on the air. This is clear in the image above, which shows a an A380 prototype launched through a wall of smoke. When the model passes, air is pushed downward. The finite size of the wings also generates dramatic wingtip vortices. The high pressure air on the underside of the wings tries to slip around the wingtip to the upper surface, where the local pressure is low. This generates the spiraling vortices, which can be a significant hazard to other nearby aircraft. They are also detrimental to the airplane’s lift because they reduce the downwash of air. Most commercial aircraft today mitigate these effects using winglets which weaken the vortices’ effects. (Image credit: Nat. Geo./BBC2)
Greening the River
Every year Chicago dyes its river green in honor of St. Patrick’s Day. This timelapse video shows this year’s dyeing, including several passes from a boat distributing the green dye. The color is remarkably slow to diffuse. The boat’s passage does little to affect the motion of the dye already in the river. This is because the boat mainly disturbs the surface and most of the color comes from dye spread throughout the water. It’s like if you tried to stir milk into your coffee just by tapping the surface with your spoon. Instead, the slower, large-scale turbulent motion of the river distributes the dye. For more St. Patrick’s Day physics, be sure to check out Guinness physics and why tapping a beer makes it foam. (Video credit: P. Tsai; submitted by Bobby E.)
When Turbulence Is Desirable
One of the common themes in aerodynamics, especially in sports applications, is that tripping the flow to turbulence can decrease drag compared to maintaining laminar flow. This seems counterintuitive, but only because part of the story is missing. When a fluid flows around a complex shape, there are actually three options: laminar, turbulent, or separated flow. An object’s shape creates pressure forces on the surrounding fluid flow, in some cases causing an increasing, or unfavorable, pressure gradient. When this occurs, fluid, especially the slower-moving fluid near a surface, can struggle to continue flowing in the streamwise flow direction. Consider the video above, in which the flow moves from left to right. Near the surface a turbulent boundary layer is visible, where fluid motion is significantly slower and more random. Occasionally the flow even reverses direction and billows up off the surface. This is separation. Unlike laminar boundary layers, turbulent boundary layers can better resist and recover from flow separation. This is ultimately what makes them preferable when dealing with the aerodynamics of complex objects. (Video credit: A. Hoque)