When a droplet falls through an air/water interface, a vortex ring can form and fall through the liquid. In this video, the researchers investigate the effects of a stratified fluid interface on this falling vortex ring. In this case, a less dense fluid sits atop a denser one. Depending on the density of the initial falling droplet and the distance it travels through the first fluid, the behavior and break-up of the vortex ring when it hits the denser fluid differs. Here four different behaviors are demonstrated, including bouncing and trapping of the vortex ring. (Video credit: R. Camassa et al.)
Tag: science

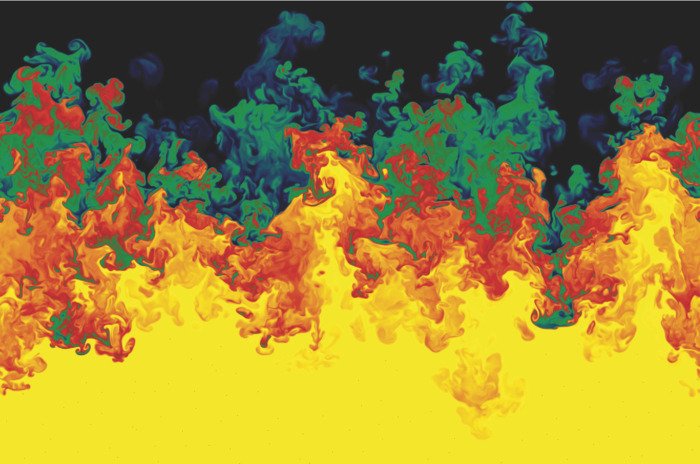
Mixing Physics
When a dense fluid sits above a lighter fluid in a gravitational field, the interface between the two fluids is unstable. It breaks down via a Rayleigh-Taylor instability, with mushroom-like protrusions of the lighter fluid into the heavier one. The image above comes from a numerical simulation of this effect well after the initial instability; the darker colors represent denser fluids and lighter colors are less dense fluids. The flow here has progressed to turbulence, and the authors of the simulation are exploring the statistical nature of this flow breakdown relative to the classical case of isotropic, homogeneous turbulence. (Photo credit: W. Cabot and Y. Zhou)

Spitting Droplets
Any phenomenon in fluid dynamics typically involves the interaction and competition of many different forces. Sometimes these forces are of very different magnitudes, and it can be difficult to determine their effects. This video focuses on capillary force, which is responsible for a liquid’s ability to climb up the walls of its container, creating a meniscus and allowing plants and trees to passively draw water up from their roots. Being intermolecular in nature, capillary forces can be quite slight in comparison to gravitational forces, and thus it’s beneficial to study them in the absence of gravity.
In the 1950s, drop tower experiments simulating microgravity studied the capillary-driven motion of fluids up a glass tube that was partially submerged in a pool of fluid. Without gravity acting against it, capillary action would draw the fluid up to the top of the glass tube, but no droplets would be ejected. In the current research, a nozzle has been added to the tubes, which accelerates the capillary flow. In this case, both in terrestrial labs and aboard the International Space Station, the momentum of the flow is sufficient to invert the meniscus from concave to convex, allowing a jet of fluid out of the tube. At this point, surface tension instabilities take over, breaking the fluid into droplets. (Video credit: A. Wollman et al.)

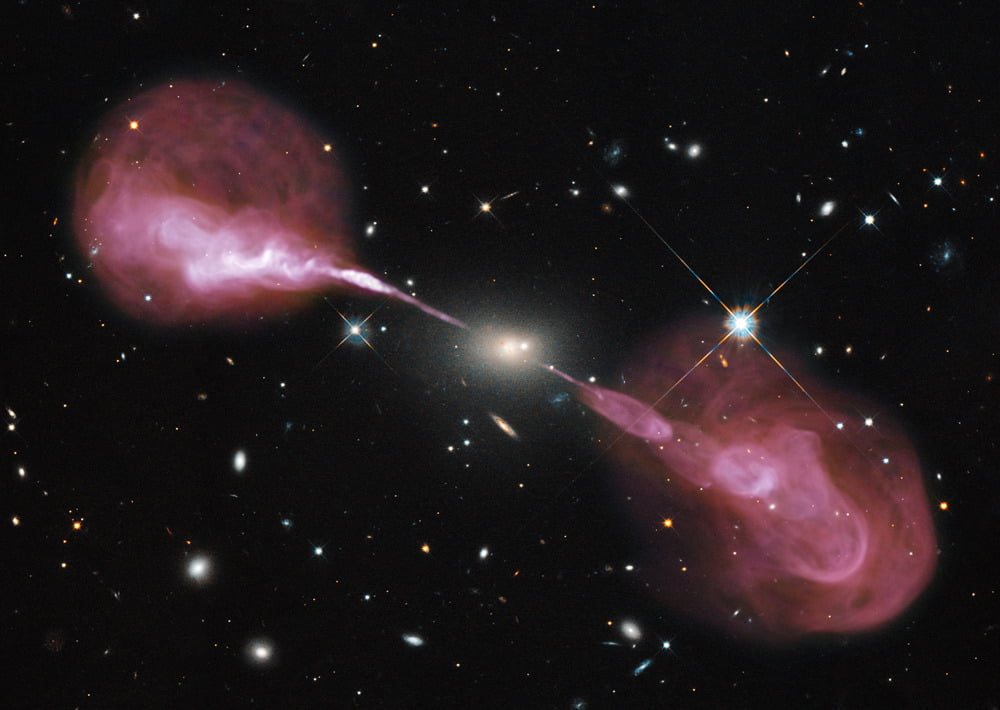
Plasma Jets
Jets of high-energy plasma and sub-atomic particles explode outward from the Hercules A elliptical galaxy at the center of this photo. The jets are driven to speeds close to that of light due to the gravitation of the supermassive black hole at the center of the elliptical galaxy. Relativistic effects mask the innermost portions of the jets from our view, but, as the jets slow, they become unstable, billowing out into rings and wisps whose turbulent shapes suggest multiple outbursts originating from Hercules A. (Photo credit:NASA, ESA, S. Baum and C. O’Dea (RIT), R. Perley and W. Cotton (NRAO/AUI/NSF), and the Hubble HeritageTeam (STScI/AURA); via Discovery)
Surface Explosions
Underwater explosions often behave non-intuitively. Here researchers explore the effects of surface explosions by setting off charges at the air/water interface. Initially, an unconfined explosion’s blast wave expands a cavity radially into the water. This cavity collapses back toward the surface from the bottom up, ultimately resulting in a free jet that rebounds above the water level. Confined explosions behave very differently, expanding down the glass tube containing them in a one-dimensional fashion. The cavity never extends beyond the end of the glass tube, likely due to hydrostatic pressure. (Video credit: Adrien Benusiglio, David Quéré, Christophe Clanet)

Phytoplankton and Sediments
Pale sediments are carried out to sea by the rivers of the Mergui Archipelago of Myanmar. Dark blue ocean waters mix with the sediment, creating turbulent swirls in this natural color satellite image. With the sediment comes valuable nutrients for plant life in the ocean, which can prompt the formation of phytoplankton blooms. (Photo credit: Michael Taylor/Landsat/NASA)
Flapping Elastic Straws
One of the interesting challenges in fluid dynamics is the coupling of aerodynamic forces with structural forces. This could be the result of external flow, as with aeroelastic flutter on aircraft or architecture, or internal flow, as with the video above. Here researchers blow air through compliant cylindrical shells–think of a straw made of an elastic solid like latex–and observe the vibrations that result. Depending on the flow rate and material properties, different vibrational modes can be activated. The first mode behaves much like a garden hose that’s not being held; it vibrates wildly back-and-forth. The second mode wobbles the mouth of the shell open and closed, whereas the third mode forms three “flaps” that vibrate inward and outward. Each of these modes behaves very differently, and, for practical applications, it’s important for engineers to be able to predict, control, and account for these kinds of structural behaviors under aerodynamic loading. (Video credit: P. Zimoch et al.)

Slapping Sheets
Here fluid is ejected as two flat plates collide, creating a sheet of silicone oil. The initially smooth sheet forms a thicker ligament about the edge. Gravity causes the sheet to bend downward like a curtain, and growing instabilities along the ligament cause the development of a wavy edge. The points of the waves develop droplets that eject outward. Not long after this photograph, the entire liquid sheet will collapse into ligaments and flying droplets. (Photo credit: B. Chang, B. Slama, and S. Jung)
The Evolution of Icicles
The time-lapse video above shows the growth of icicles of various compositions under laboratory conditions. Many icicles in nature exhibit a rippling effect in their shape, which some theories attribute to an effect of lower surface tension in some liquids. Here researchers show the icicle growth of three liquids: pure distilled water, and water with two concentrations of dissolved salt. They found that lowering the surface tension of the freezing liquid with non-ionic surfactants (i.e. not salt) did not produce ripples, but that dissolved ionic impurities like salt strongly affected the growth of ripples. They posit that this may be due to constitutional supercooling, in which growth of the solid-liquid interface is destabilized by the preferential concentration of impurities near the interface. (Video credit: A. S. Chen and S. Morris)
Hot Items Sink Faster
This combined video shows the fall of a heated centimeter-sized steel sphere through water. From left to right, the sphere is at 25 degrees C (left), 110 degrees C (middle), and 180 degrees C, demonstrating how the Leidenfrost effect–which vaporizes the water in immediate contact with the sphere–can substantially reduce the drag on a submerged object. In the middle video, the vaporization of the water around the sphere is sporadic and incomplete, only slightly reducing the sphere’s drag relative to the room temperature case. The much hotter sphere on the right, however, has a complete layer of vapor surrounding it, allowing it to travel through a gas rather than the denser liquid. (Video credit: I. Vakarelski and S. Thoroddsen; from a review by D. Quere)