Tag: density

  • Featured Video Play Icon

    Toying With Density and Miscibility

    Steve Mould opens this video with a classic physics toy that uses materials of different densities as a brainteaser. Two transparent, immiscible liquids fill the container, along with beads of a couple different densities. When you shake the toy, the liquids emulsify, creating a layer with an intermediate density. As the two liquids separate, the emulsified middle layer disappears, causing the beads (which have densities between that of the two original liquids) to come together.

    The rest of the video describes the challenges of expanding this set-up into three immiscible liquids and four sets of beads. Along the way, Steve had to contend with issues of miscibility, refractive index, and even chemical solvents. It’s amazing, sometimes, what it takes to make a seemingly simple idea into reality. (Video and image credit: S. Mould)

  • Mixing in a Winter Lake

    Mixing in a Winter Lake

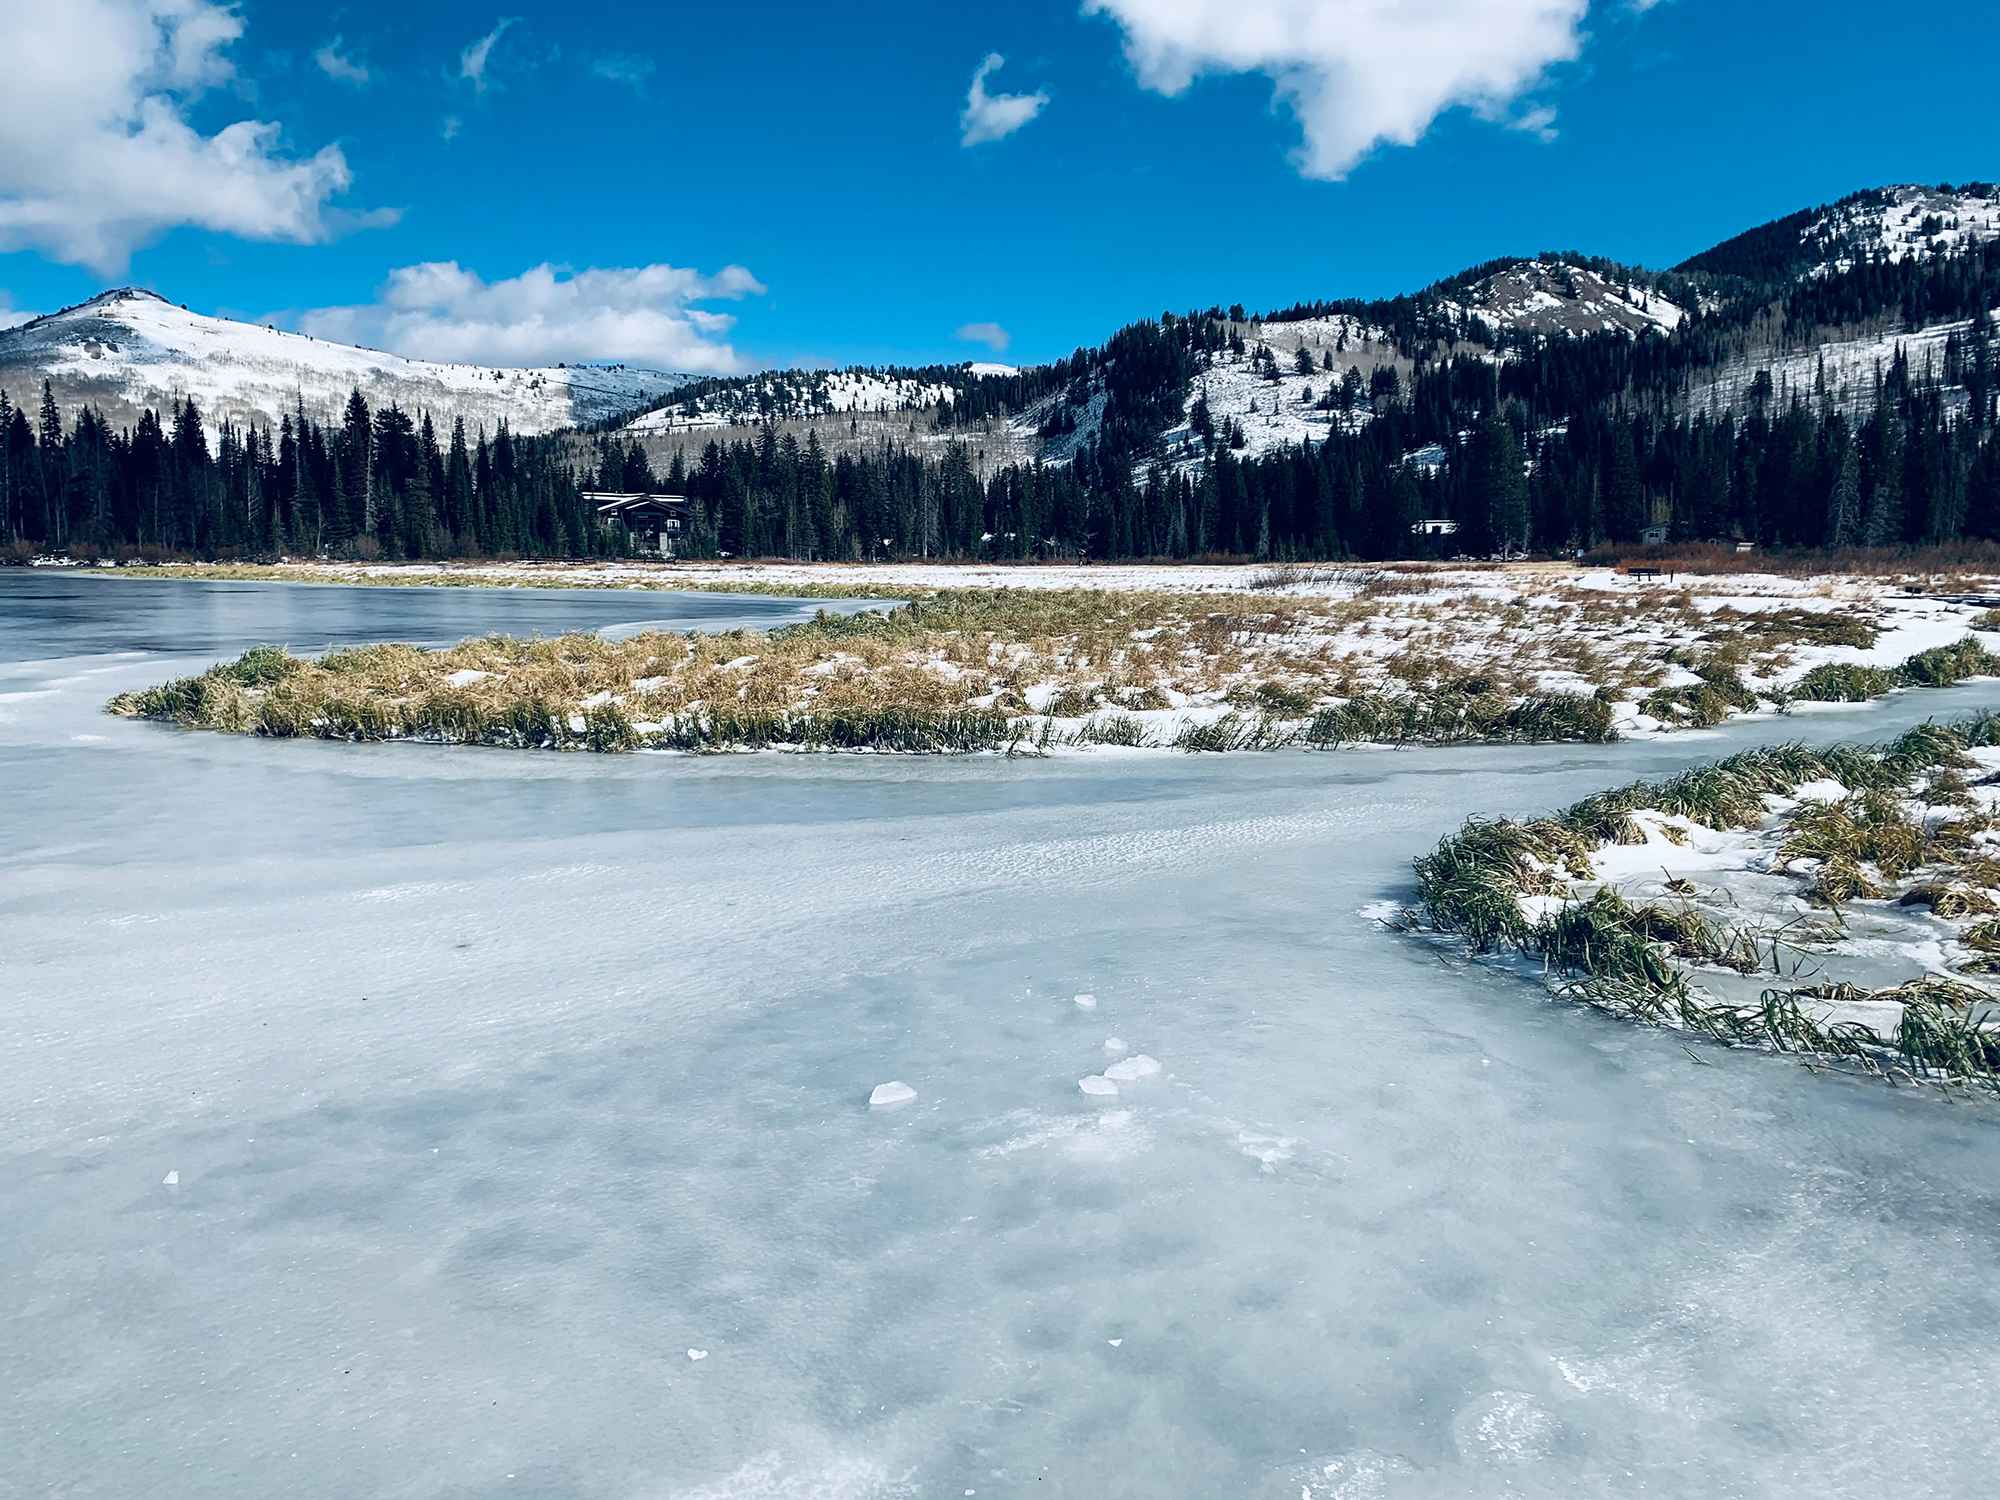
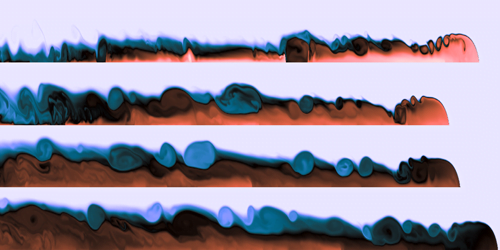
    A frozen winter lake can hide surprisingly complex flows beneath its placid surface. Since water is densest at 4 degrees Celsius — just above the freezing point — mixing two water sources can lead to counterintuitive effects. A cold lake, for example, may contain water below 4 degrees Celsius, while a stream running into the lake is a bit warmer than 4 degrees Celsius. When the two parcels of water meet, they mix to form water at an intermediate temperature. But because of water’s density anomaly, that mixed water can wind up denser than the average of its parents. This is known as cabbeling.

    Mixing patterns within a cold lake with a slightly warmer inflow. Image from A. Grace et al.
    Mixing patterns within a cold lake with a slightly warmer inflow. Image from A. Grace et al.

    As shown in a recent study, this newly mixed water sinks to the bottom of the lake, forming a warm current that heats the lake from below. The researchers were able to model this current and its behavior over a range of conditions. Understanding these winter circulation patterns is key to tracking both nutrient transport and how pollutants spread in the ecosystem. (Image credit: lake – G. Murry, simulation – A. Grace et al.; research credit: A. Grace et al.; via APS Physics)

  • Bubbles in Turbulence

    Bubbles in Turbulence

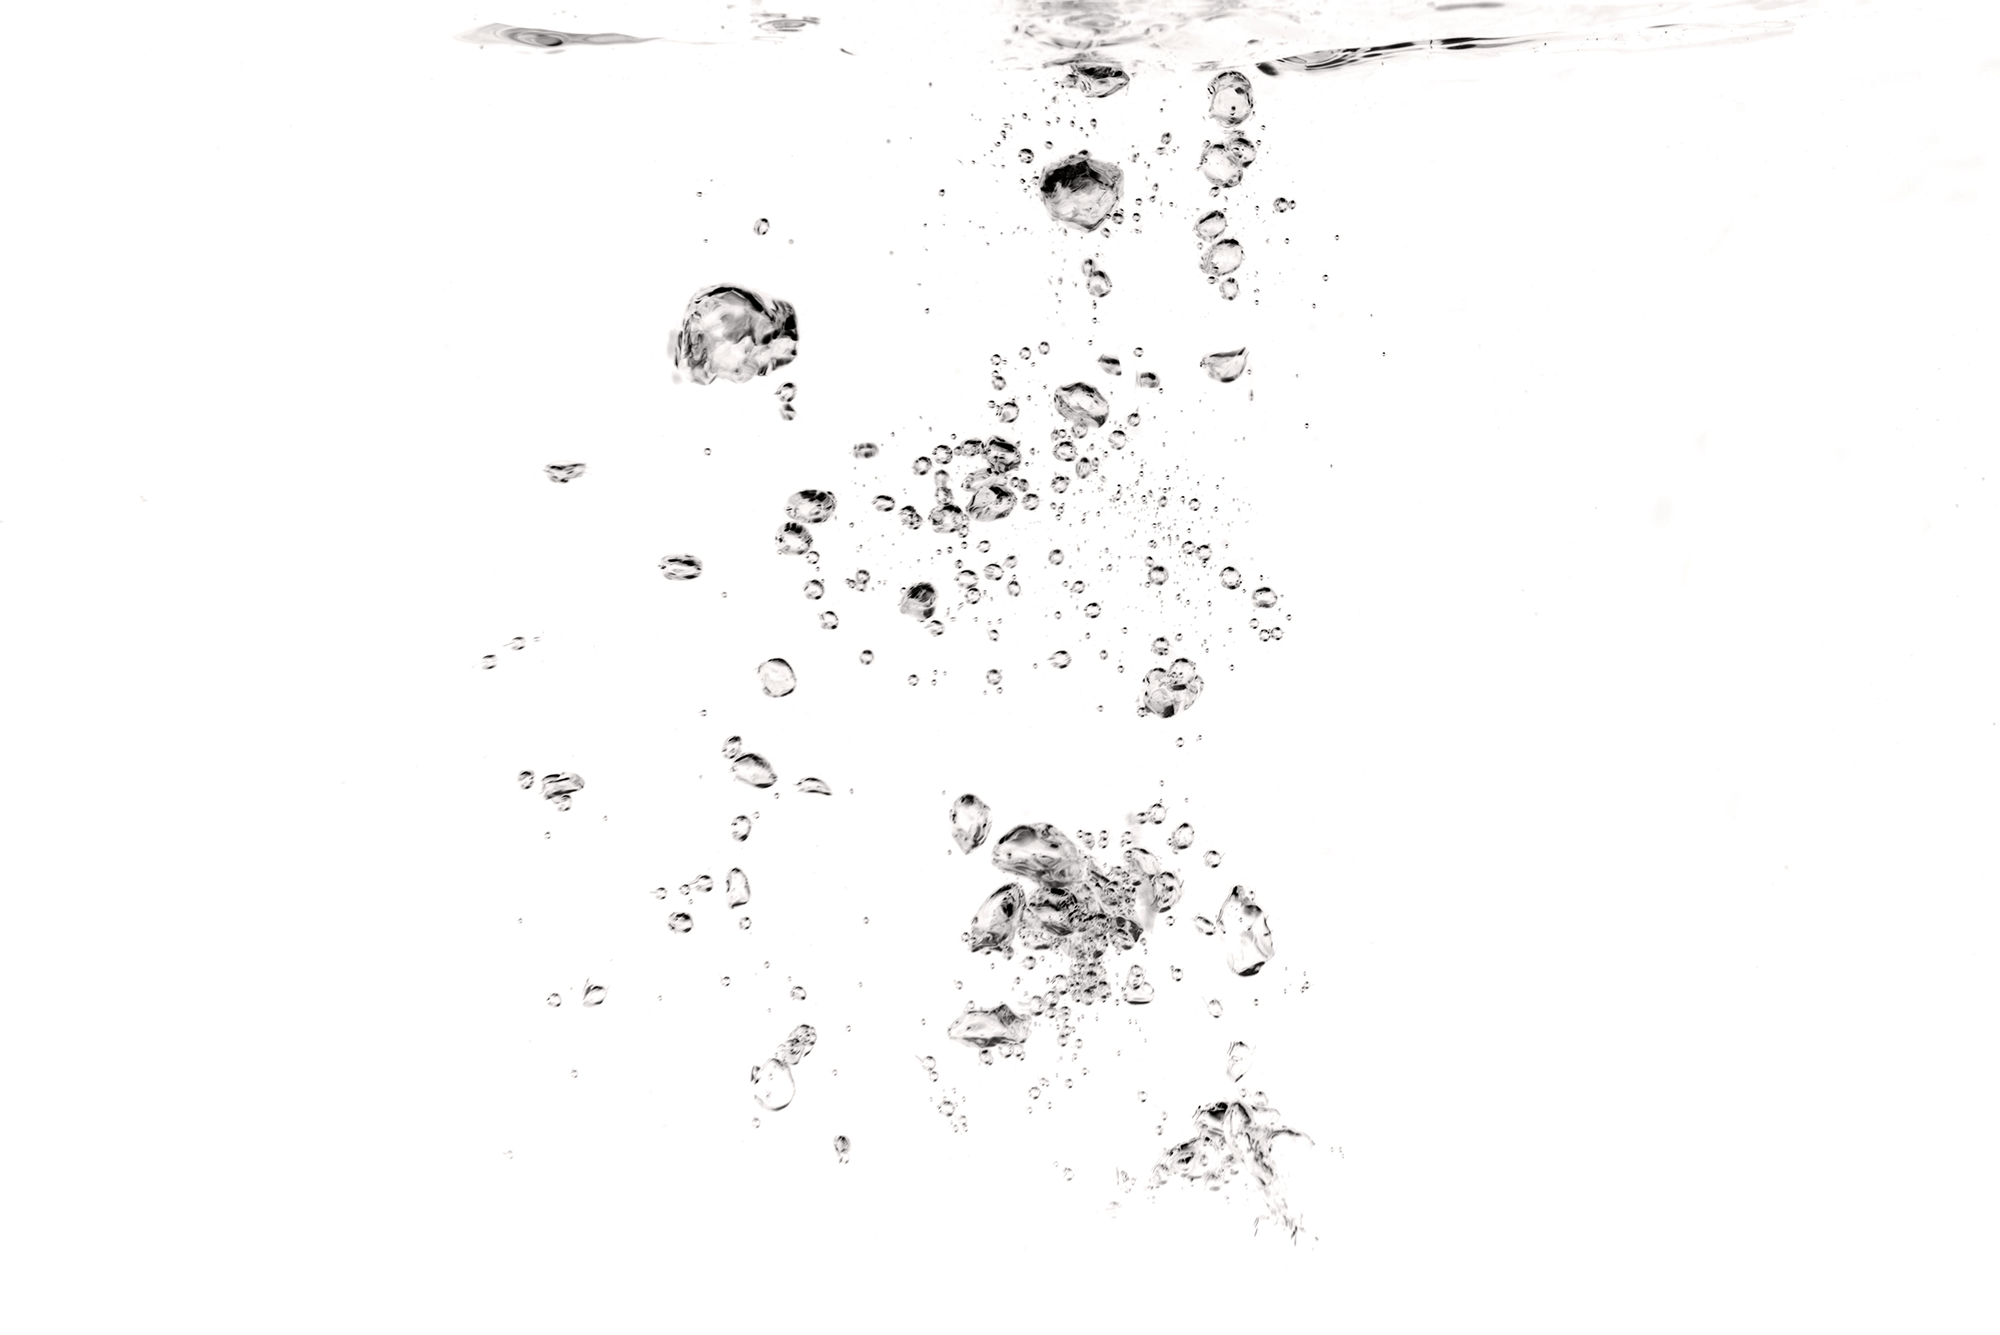
    In nature and industry, swarms of bubbles* often encounter turbulence in their surrounding fluid. To study this situation, researchers used numerical simulation to observe bubbles across a range of density, viscosity, and surface tension values relative to their surroundings. They found that density differences between the two fluids made negligible changes to the way bubbles broke or coalesced.

    In contrast, viscosity played a much larger role. More viscous bubbles were less likely to deform and break, thanks to their increased rigidity. When looking at small deformations along the bubble interface, both density and viscosity had noticeable effects. With increasing bubble density, they observed more dimples on the interface; increasing the viscosity had the opposite effect, making the bubbles smoother. (Image credit: Z. Borojevic; research credit: F. Mangani et al.)

    *We usually think of bubbles as air or another gas contained within a liquid. But this study’s authors use the term “bubble” more broadly to mean any coherent bits of fluid in a different surrounding fluid. Colloquially, this means their results apply to both bubbles and drops.

  • Featured Video Play Icon

    Breaking Ocean Currents

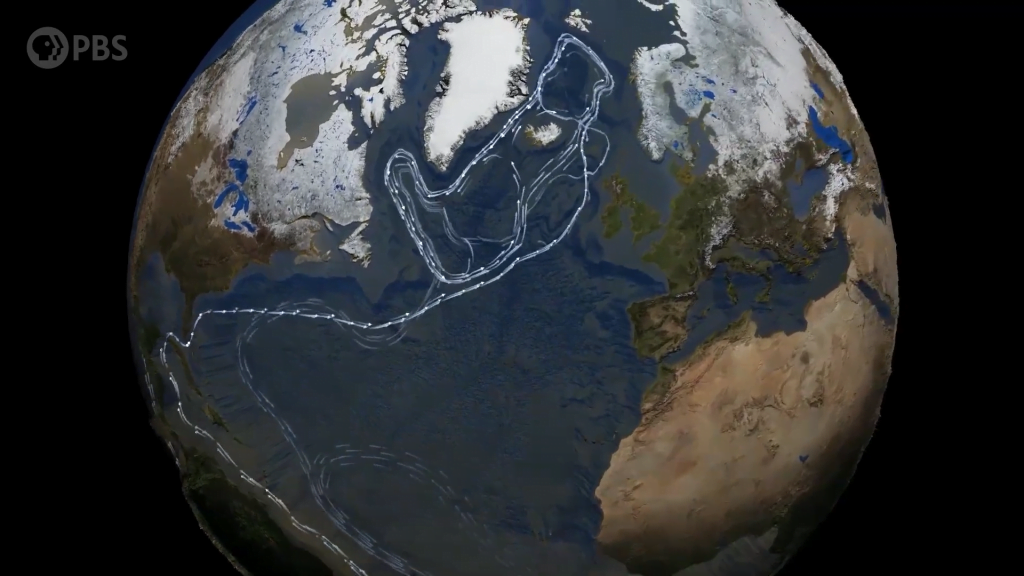
    Our global ocean currents move enough water to dwarf the flow of all Earth’s rivers. This worldwide circulation is driven largely by density and the movements of cold, salty water versus warmer, fresher water. The pump behind this action lies in the North Atlantic, where cold, salty water sinks down in the Atlantic Meridional Overturning Circulation, or AMOC. Among other things, AMOC is responsible for Western Europe’s relatively mild climate compared to similarly northern lands.

    Unfortunately, as our world warms, AMOC gets weaker. That means less cold water sinking in the North Atlantic and a smaller driving force behind global oceanic circulation. There is even a small but real chance that global warming breaks our ocean current system entirely and drastically changes climates around the world in ways that cannot be easily fixed. Watch the full video to learn more. (Video and image credit: It’s Okay To Be Smart)

  • Meeting Without Mixing

    Meeting Without Mixing

    When bodies of water meet, they don’t always mix right away. Here we see the confluence of the Back and Hayes Rivers in the Canadian Arctic. The Back River appears as a darker blue-green color compared to the light turquoise Hayes River. The different colors reflect the levels of algae and sediment carried in their waters. As seen in both the aerial and satellite photos here, there’s a distinct line where the two waters meet without mixing, and that line persists for kilometers beyond their initial confluence. Typically, this lack of mixing between bodies of water is caused by differences in temperature, salinity, and turbidity (amount of sediment) that make the density of each river’s water different. (Image credit: top – R. Macdonald/Univ. of Manitoba, bottom – J. Stevens/USGS; via NASA Earth Observatory)

    A satellite photo of the Back and Hayes Rivers shows their distinctly different colors persisting for 10+ kilometers after their confluence.
  • Dual Structure of Water

    Dual Structure of Water

    Water is so ubiquitous in our lives that we rarely recognize just how strange it is. For example, when pure liquid water is supercooled well below its freezing temperature, it takes on not one but two molecular arrangements, one of which is high-density and one of which is low-density. Theory had posited this configuration for some time, but only recently has experimental evidence supported it.

    The experimental challenge was water’s rapid crystallization in the temperature region of interest. Any time water was held at those temperatures in order to study it, it would crystallize before researchers could make their observations. To get around this, a team studied extremely thin layers of water which they heated with a laser before rapidly cooling. By repeating this heating-and-cooling cycle many times, they were able to measure water properties that only make sense if it conforms to the two-density theory. (Image credit: T. Holland/Pacific Northwest National Laboratory; research credit: L. Kringle et al.; via Science News; submitted by Kam-Yung Soh)

  • Convection Without Heat

    Convection Without Heat

    We typically think of convection in terms of temperature differences, but the real driver is density. In the animations above, cream sitting atop a liqueur is undergoing solutal convection – no temperature difference needed! The alcohol in the liqueur mixes with the cream to form a lighter mixture that rises to the surface. The lower surface tension of the alcohol is also good at breaking up the cream, forming little cells. As the alcohol in those cells evaporates, the cream gets heavier and sinks down into the liqueur, where it can pick up more alcohol, rise back to the surface, and begin the cycle again. (Image credit: J. Monahan et al., source)

  • Convection

    Convection

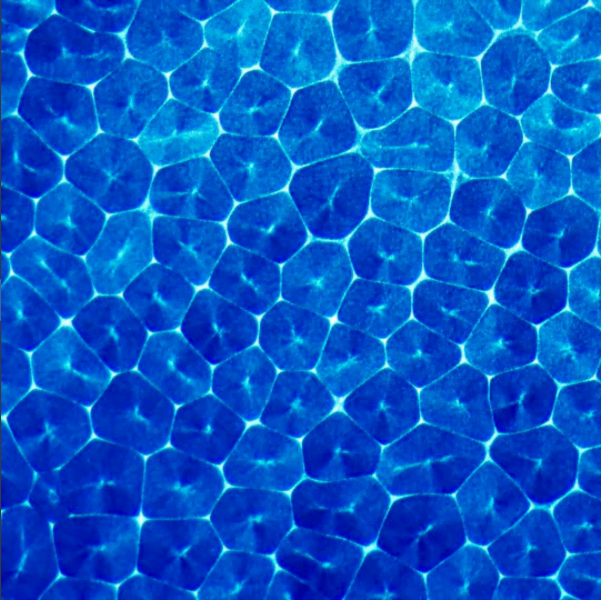
    Blue paint in alcohol forms an array of polygonal convection cells. We’re accustomed to associating convection with temperature differences; patterns like the one above are seen in hot cooking oil, cocoa, and even on Pluto. In all of those cases, temperature differences are a defining feature, but they are not the fundamental driver of the fluid behavior. The most important factors – both in those cases and the present one – are density and surface tension variations. Changing temperature affects both of these factors, which is why its so often seen in Benard-Marangoni convection.

    For the paint-in-alcohol, density and surface tension differences are inherent to the two fluids. Because alcohol is volatile and evaporates quickly, its concentration is constantly changing, which in turn changes the local surface tension. Areas of higher surface tension pull on those of lower surface tension; this draws fluid from the center of each cell toward the perimeter. At the same time, alcohol evaporating at the surface changes the density of the fluid. As it loses alcohol and becomes denser, it sinks at the edges of the cell. Below the surface, it will absorb more alcohol, become lighter, and eventually rise at the cell center, continuing the convective process. (Image credit: Beauty of Science, source)

  • Featured Video Play Icon

    “Ink in Motion”

    In this short film, the Macro Room team plays with the diffusion of ink in water and its interaction with various shapes. Injecting ink with a syringe results in a beautiful, billowing turbulent plume. By fiddling with the playback time, the video really highlights some of the neat instabilities the ink goes through before it mixes. Note how the yellow ink at 1:12 breaks into jellyfish-like shapes with tentacles that sprout more ink; that’s a classic form of the Rayleigh-Taylor instability, driven by the higher density ink sinking through the lower density water. Ink’s higher density is what drives the ink-falls flowing down the flowers in the final segment, too. Definitely take a couple minutes to watch the full video. (Image and video credit: Macro Room; via James H./Flow Vis)

  • Accidental Painting

    Accidental Painting

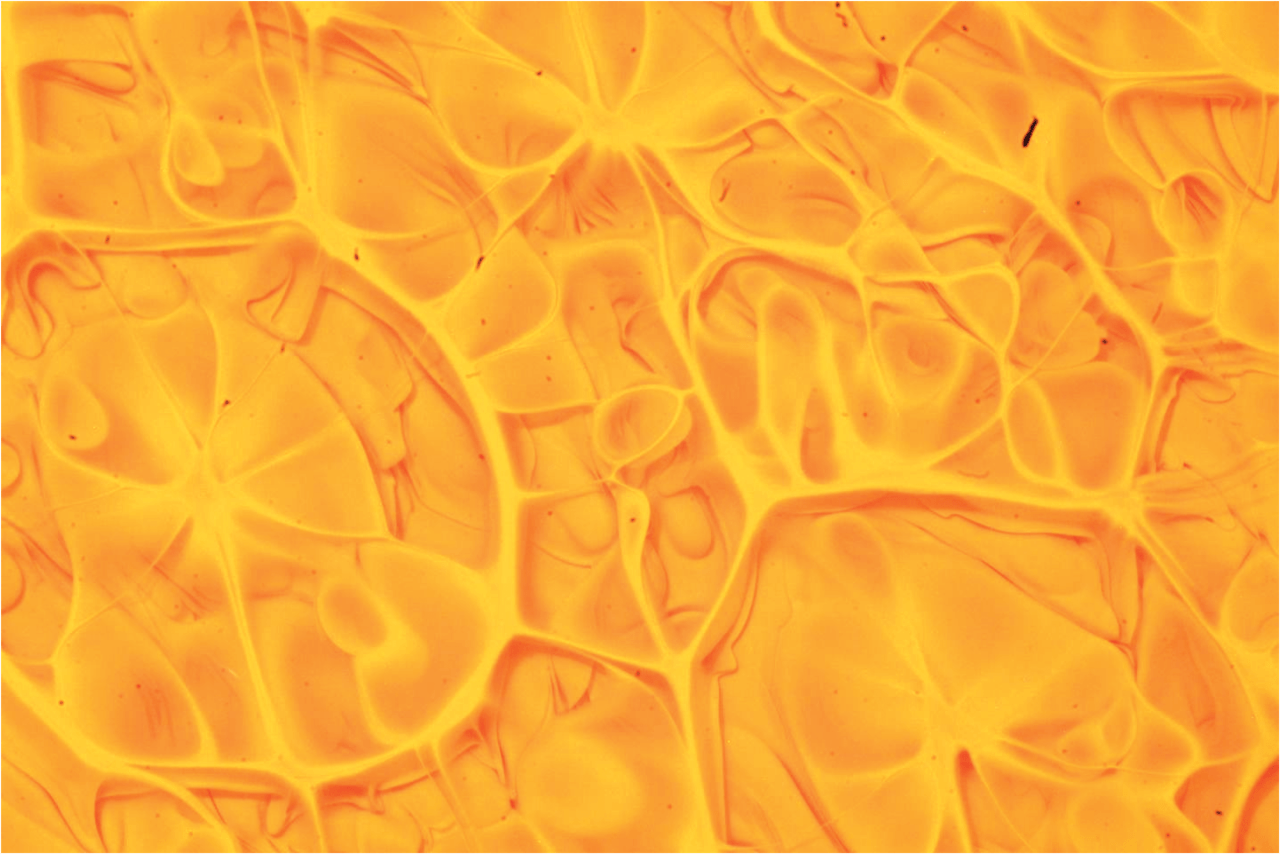
    Some paintings of Mexican artist David Alfaro Siqueiros feature patchy, spotted areas of contrasting color formed by what Siqueiros described as “accidental painting”. Many modern artists use this technique as well. By pouring thin layers of two different colors atop one other, Siqueiros was able to generate seemingly spontaneous patterns like those shown above. In fact, what Siqueiros was using was a density-driven fluid instability! These patterns will only appear when a denser paint is poured atop a lighter one. They’re the result of a Rayleigh-Taylor instability – the same behavior that makes beautiful swirls of cream in coffee and the finger-like protrusions seen in supernovae.

    Although a density difference is necessary to generate accidental painting, other factors like the paint layer’s thickness and viscosity affect the final pattern. For those who are mathematically-inclined, this paper has a linear stability analysis that shows how density difference, viscosity, and other factors affect the cell sizes in the pattern. (Image and research credits: S. Zetina et al.; GIF source)