
The cultural heritage of a site is made up of more than its appearance; its soundscape is vital, as well. Acousticians and historians work together to preserve and recreate the auditory landscape of important sites through acoustical measurements and digital reconstructions based on architecture and building materials. Thanks to projects like these, researchers can achieve feats like recreating a concert within the Notre Dame Cathedral as it was before the 2019 fire. To learn more about the technologies behind these feats, check out this Physics Today article. (Image and video credit: Ghost Orchestra; for more, see Physics Today)
Tag: numerical simulation

Hammerhead Hydrodynamics
Hammerhead sharks have some of the most distinctive craniums in the ocean, which begs the question: how do they swim with that head? New computational fluid dynamics studies suggest that their long foil-shaped heads help the sharks maneuver swiftly, but they come at the cost of substantially higher drag. The researchers found that drag on the hammerhead’s cranium required energy expenditures more than 10 times higher than other sharks, but since the study looked at heads only, it’s possible that the rest of the shark’s positioning helps mitigate that cost. (Image credit: shark – J. Allert, CFD – M. Gaylord et al.; research credit: M. Gaylord et al.; via NYTimes; submitted by Kam-Yung Soh)


The Structure of the Blue Whirl
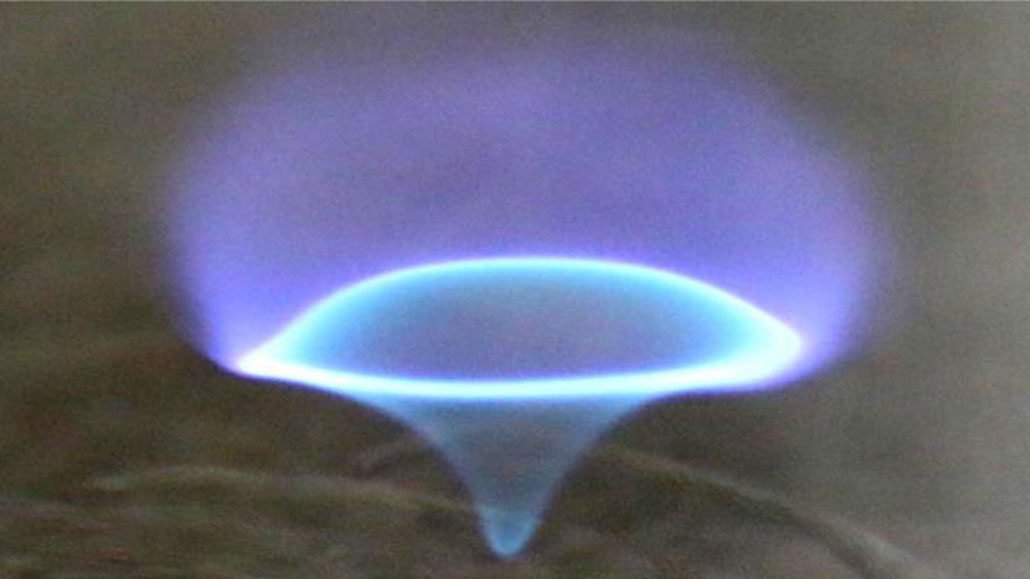
Several years ago, researchers discovered a new type of flame, the blue whirl. Now computational simulations have helped them untangle the complex structure of this clean-burning flame. Their work shows that the blue whirl is made up of three types of flames, which meet to form a fourth.
The conical base of the whirl is a fuel-rich flame in which the fuel and oxygen are initially well-mixed. Above that is a diffusion flame, where the fuel and oxygen are initially separate and the flame’s ability to burn is limited by how readily the two mix. Along the sides of the blue whirl is a third flame type, visible only as a faint wisp. Like the first flame, this one is premixed, but it contains much less fuel than oxygen. Finally, those three flames meet in the bright blue ring of the whirl, where the ratio of fuel and oxygen is just right to burn the fuel completely. (Image and research credit: J. Chung et al.; via Science News; submitted by Kam-Yung Soh)

Shear and Convection in Turbulence
")


In nature, we often find turbulence mixed with convection, meaning that part of the flow is driven by temperature variation. Think thunderstorms, wildfires, or even the hot, desiccating winds of a desert. To better understand the physics of these phenomena, researchers simulated turbulence between two moving boundaries: one hot and one cold. This provides a combination of shear (from the opposing motion of the two boundaries) and convection (from the temperature-driven density differences).
Please note that, despite the visual similarity, these simulations are not showing fire. There’s no actual combustion or chemistry here. Instead, the meandering orange streaks you see are simply warmer areas of turbulent flow, just as the blue ones are cooler areas. The shape and number of streaks are important, though, because they help researchers understand similar structures that occur in our planet’s atmosphere — and which might, under the wrong circumstances, help drive wildfires and other convective flows. (Image, research, and video credit: A. Blass et al.)
Landings Beyond Earth


With planning for manned and unmanned missions to the Moon, Mars, and many asteroids underway, engineers are using numerical simulations to understand how spacecraft thrusters interact with planetary surfaces. Most practical data for this problem comes from the Apollo program and is of limited use for current missions. Recreating a Martian landing on Earth isn’t straightforward, either, given our higher gravity. Thus, supercomputers and numerical simulation are the best available tool for understanding and predicting how the plumes from a spacecraft’s thrusters will interact with a surface and what kind of blowback the spacecraft will need to withstand. (Video credit: U. Michigan Engineering; research credit: Y. Yao et al.; submission by Jesse C.)
Simulating Better Breaking Waves


In the ocean, breaking waves trap air into bubbles that then cluster into foam, but conventional simulations don’t capture this foaminess. For bubbles to cluster into foam, there has to be a force preventing — or at least delaying — their coalescence. Typically, this is caused by impurities in the water that help lower the surface tension and thereby lengthen the bubbles’ lifespans. When these features get added to simulation models, bubbles begin to cluster and breaking waves become foamy. (Image and video credit: P. Karnakov et al.)

Contrails From 4 Engines


The wingtip vortices of aircraft provide a veritable cornucopia of gorgeous imagery. There’s something inherently fascinating about these vortices that stretch behind moving aircraft. But four-engine aircraft add an extra twist to the imagery, as seen here.
With four engines, these aircraft produce four separate contrails, each of which acts like a streakline for the flow behind the wing. So what we see in these images is not the wingtip vortices themselves, but what their effect is on flow moving across different parts of the wing.
Nearby vortices influence one another, and one of the earliest models of aircraft physics takes advantage of this by modeling the wing itself as a series of vortices. Odd as it sounds, such models are quite good for capturing the basic flow physics behind a finite wing.
Using one of these models, Joseph Straccia explored the physics of a 4-engine aircraft’s wake (Image 4), predicting that the outboard engine contrails should initially move outward before getting rolled up and inward by the wingtip vortices. That’s exactly what we see in these images, particularly Image 1. The inboard contrails undergo less deflection, as expected since they are further from the wingtips. (Image credits: aircraft and contrails – JPC Van Heijst, J. Willems, and E. Karakas; modeling and submission – J. Straccia)

Undulating Keeps Flying Snakes Steady


Flying snakes undulate through the air as they glide. But, unlike on land, these wiggles aren’t for propulsion. A new study shows instead that they are key to the snake staying stable in flight.
Upon take-off, a flying snake flattens its body, forming a wing-like shape that helps them generate lift and control drag. But while they glide, they also slither and pitch their tail.
Researchers recorded more than 150 flights by live snakes, then used that data to construct their own digital snake. The model could fly like a real snake or be tested without undulations to see what would happen. The researchers discovered that, without that mid-air slithering, the snake quickly lost control and rolled to the side. (Image and research credit: I. Yeaton et al.; via NYTimes; submitted by Kam-Yung Soh)

Shedding Light on Martian Dust Storms


In 2018, Mars was enveloped by a global dust storm that lasted for months. Although such storms had been seen before, the 2018 storm offered an unprecedented opportunity for observation from five orbiting spacecraft and two operating landers. As researchers comb through that data, they’re gaining new insights into the mechanisms that drive these extreme events.
At NASA Ames, a team of researchers used observations of dust columns as input to a simulation of Mars’ global climate, then watched as the digital storm unfolded. Simulations like these have an important advantage over observations: the simulations allow scientists to track the transport of dust from one region to another.
That dust tracking is critical for some of the team’s results. They found feedback patterns between dust lifting and deposition in different regions. For example, early in the storm dust was largely supplied from the Arabia/Sabaea regions, but once that dust was deposited in the Tharsis region, it kicked off a massive lifting event from Tharsis that put twice as much dust into the atmosphere as had landed there. Later, dust deposited back in Arabia by the Tharsis lofting generated new dust uplifts. As long as more dust got lifted than deposited, the intense storms continued. (Image credits: NASA, T. Bertrand/A. Kling/NASA Ames; research credit: T. Bertrand et al.; see also JGR Planets and AGU; submitted by Kam-Yung Soh)

When Shear Meets Slip
One of the classic concepts students learn early in their fluids education is the no-slip condition. In essence, this idea says that friction between a solid object — say, a wall — and the fluid immediately next to it is such that no movement is possible where they meet. The fluid cannot “slip” along the surface, hence “no-slip”. It’s a simple concept, but one that can create a lot of complexity in practice.
Imagine, for example, a fluid sandwiched between two surfaces: one stationary and one moving at a constant speed. This movement creates a shear flow, in which the velocity of the fluid varies from the speed of the moving plate all the way down to zero, the speed of the stationary plate. If we placed a little platelet in the middle of this flow, we’d expect it to rotate because of the faster flow on one side.
But a new paper finds something rather different, at least when considering an extremely small nanoplatelet. With a tiny enough plate, individual molecules can slip along the surface, and when that happens, instead of rotating, the nanoplatelet aligns itself with the flow. That alignment means the added particle would disturb the flow less, creating a lower viscosity and better flowability. (Image and research credit: C. Kamal et al.; submitted by Simon G.)


