Tag: numerical simulation

  • Unifying Sediment Transport Theory

    Unifying Sediment Transport Theory

    On windy days, streaks of snowflakes snake in the air above a mountaintop snowfield. And when snorkeling in the surf, you can watch the inbound waves sculpt underwater ripples in the sand. Both are examples of sediment transport, and scientists have struggled to understand why the physics of these grains seems to differ between air and water. We observe certain behaviors, like saltation, in air and very different behaviors for grains underwater.

    One of the key differences is how much erosion occurs for a given amount of shear. In air, the relationship is linear; double the shear stress and you double the sediment transport rate. But in water, the relationship is nonlinear, meaning a small change in the shear stress can have a much larger effect on the rate of transport.

    A new study suggests that these differences are really only skin deep. Through detailed simulations, the researchers showed that what really matters is the energy dissipation caused by collisions between grains. Whether the medium is air or water, there are two important regions in the flow: the bed region where particles experience little movement, and the overlying region where grains are energized and lifted by the flow. In this framework, the researchers found no difference in how energy is dissipated, regardless of the medium.

    So why do measured sediment transport rates vary between air and water? The authors concluded that the relationship between shear and transport rate is, indeed, nonlinear. It’s just that the wind here on Earth is too weak to reach that nonlinearity. (Image credit: snow – wisconsinpictures, sand – J. Chavez; research credit: T. Pähtz and O. Durán; via APS Physics; submitted by Kam-Yung Soh)

  • COVID-19 and Outdoor Exercise

    COVID-19 and Outdoor Exercise

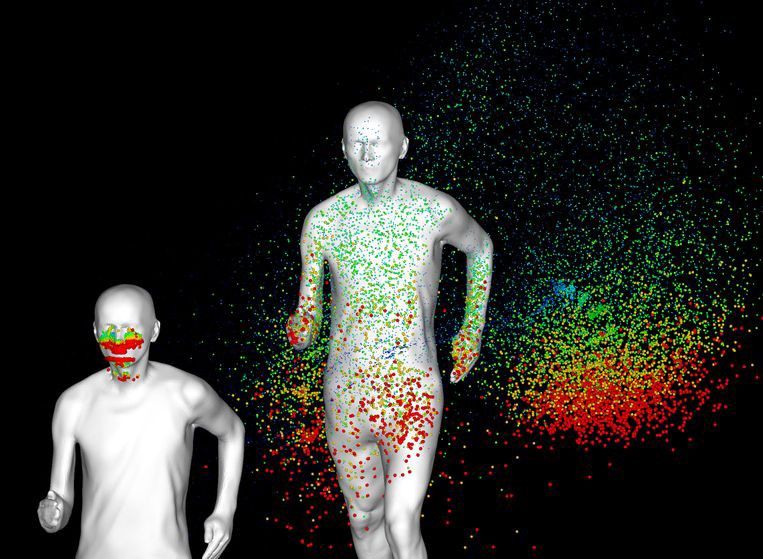
    By now you’ve probably come across some blog posts and news articles about a new pre-print study looking at the aerodynamics of running and the potential exposure to exhaled droplets. And you may also have seen articles questioning the accuracy and validity of such simulations. I’ve had several readers submit questions about this, so I dug into both the research and the criticisms, and here are my thoughts:

    Is this study scientifically valid?

    I’ve seen a number of complaints that since this paper hasn’t been peer-reviewed, we shouldn’t trust anything about it. That seems like an unreasonable overreaction to me considering how many studies receive press attention prior to their actual peer-reviewed publication. This is not a random CFD simulation produced by someone who just downloaded a copy of ANSYS Fluent. This work comes from a well-established group of engineers specializing in sports aerodynamics, and long-time readers will no doubt recognize some of their previous publications. Over the past decade, Blocken and his colleagues have become well-known for detailed experimental and simulation work that indicates larger aerodynamic effects in slipstreams than what we generally recognize.

    In this paper, they lay out previous (biological) studies related to SARS and droplet exhalation; they use those papers and several wind tunnel studies to validate computational models of droplet evaporation and runner aerodynamics; and then they use those inputs to simulate how a cloud of exhaled droplets from one runner affects someone running alongside, behind, or in a staggered position relative to the first runner.

    In other words, their work includes all the components one would expect of a scientific study, and it makes scientifically justifiable assumptions with regard to its methods. (That’s not, mind you, to say that no one can disagree with some of those choices, but that’s true of plenty of peer-reviewed work as well.) All in all, yes, this is a scientifically valid study, even if it has not yet undergone formal peer-review*.

    Can simulations actually tell us anything about virus transmission?

    One complaint I’ve seen from both biologists and engineers is that simulations like these don’t actually capture the full physics and biology involved in virus transmission. While I agree with that general sentiment, I would point out two important facts:

    1) Blocken et al. acknowledge that this is not a virology study and confine their scientific results to looking at what happens physically to droplets when two people are moving relative to one another. Whether those droplets can transmit disease or not is a question left to biological researchers.

    2) Most medical and biological research also does not account for the physics of droplet transmission and transport. For the past century, this research has focused almost exclusively on droplet sizes, with the assumption that large droplets fall quickly and small droplets persist a little longer. To my knowledge, some of the only work done on the actual physics of the turbulent cloud produced by coughing or sneezing comes from Lydia Bourouiba’s lab at MIT. And, to me, one of the fundamental conclusions from her work is that droplets (especially small ones) can persist a lot longer and farther than previously assumed. Can those droplets facilitate transmission of COVID-19? The general consensus I’ve seen expressed by medical experts is no, but, to my knowledge, that is based on opinion and assumption, not on an actual scientific study.

    The bottom line

    In my opinion, there’s a big disconnect right now between the medical/biological community and the engineering community. To truly capture the physics and biology of COVID-19 transmission requires the expertise and cooperation of both. Right now both sides are making potentially dangerous assertions.

    Honestly, based on what I know about aerodynamics, I am personally skeptical as to whether 6 ft of physical separation is truly enough; whether it is or not seems to depend on how transmissible the novel coronavirus is through small droplets, which, again, to my knowledge, is unestablished.

    Should we leave more distance than 6ft between us when exercising outdoors? Absolutely. Aerodynamically, it makes perfect sense that following in someone’s slipstream would put you inside their droplet cloud, which needs time and space to disperse. Personally, I’ve sidestepped the question entirely by doing all my cycling indoors while quarantined.

    tl;dr: There are a lot of open questions right now about COVID-19 transmission and what qualifies as safe distancing, but it’s smarter to err on the side of more distancing. Don’t hang close to others when running or cycling outdoors.

    (Image and research credit: B. Blocken et al.; submitted by Corky W. and Wendy H.)

    *I will add that, with my training, I have and do occasionally peer-review studies such as this one, and I read the full paper with the same sort of critical eye I would turn to a paper I was asked to review.

  • Using Electric Fields to Avoid Dripping

    Using Electric Fields to Avoid Dripping

    Anyone who’s painted a room at home is familiar with the frustration of drips. At certain inclinations, practically every viscous liquid develops these gravity-driven instabilities. They’re troublesome in manufacturing as well, where viscous films are often used to coat components and unexpected drips can ruin the process.

    To avoid this, researchers are adding electric fields into the mix. For dielectric fluids — liquids sensitive to electric fields — this addition acts like extra surface tension, stabilizing the film and preventing drips from forming. The researchers’ mathematical models predict the electric field strength necessary for a given fluid layer depending on its inclination. (Image credit: stux; research credit: R. Tomlin et al.; via APS Physics)

  • Inferring Flows with Neural Networks

    Inferring Flows with Neural Networks

    Fluid dynamicists have long used flow visualization methods to get a qualitative sense for flows, but it’s rare to derive much quantitative data from this imagery. But that may soon change thanks to a new computational technique, called Hidden Fluid Mechanics, that uses data from flow visualizations combined with physics-informed neural networks to derive the underlying velocities and pressures in a flow.

    The technique relies on two important ideas. One is that the dye, smoke, or other method of visualizing the flow does not alter the underlying flow; it’s just something carried along by the fluid. In other words, the flow behaves exactly the same whether or not you inserted dye or smoke.

    The second key idea is that the Navier-Stokes equations — which are derived from conservation of mass, momentum, and energy — accurately describe the physics of a flow. That assumption is critical to the technique since it uses those equations to constrain the flow fields the algorithm reconstructs.

    So here, roughly speaking, is what the algorithm actually does: researchers feed it concentration data from a flow visualization — essentially how much smoke or dye is present at every point in space and time — and the neural network reconstructs, based on the Navier-Stokes equations, what velocity and pressure field would produce that concentration data.

    The researchers demonstrate the capabilities of their algorithm by comparing its results to flows where all the information is known. The first image in the gallery above shows concentration data for the flow in an aneurysm. The full flow field is known already from a numerical simulation, but the researchers gave their new algorithm only the concentration data. From that, it reconstructed the streamlines for the aneurysm’s flow, shown in the second image as “Learned”. The “Exact” streamlines on the left are taken from the original numerical simulation data. As you can see, the results are remarkably similar. (Image credit: drawings – L. da Vinci, others – M. Raissi et al.; research credit: M. Raissi et al.; submitted by Stuart H.)

  • Kneading Dough

    Kneading Dough

    Kneading bread dough is something of an art. The process binds flour, water, salt, and yeast into a network that is both elastic and viscous. It also traps pockets of air that will determine the texture of the final loaf. Underknead and the bubbles won’t form; overknead and the result will be a dense loaf that doesn’t rise in the oven.

    Capturing all of that physics in a realistic model is tough, but researchers have done so and validated their digital dough against experiments. The group focused on simulating industrial mixers, which knead dough with a moving, spiral-shaped rod rotating around a stationary vertical one. They found the industrial set-up did not mix as well as kneading by hand, but that could be improved by swapping the stationary rod for a second spiral one. (Image credit: G. Perricone; research credit: L. Abu-Farah et al.; via Physics World; submitted by Kam-Yung Soh)

  • Adapting to the Flow

    Adapting to the Flow

    Simulating fluid dynamics computationally is no simple task. One of the major challenges is that flows typically consist of many different lengthscales, from the very large to the extremely tiny. In theory, correctly capturing the physics of the flow requires computing all of those scales, and that means having a very close, dense grid of points at which the physics must be calculated during every time step of a simulation. Even for a relatively simple flow, this quickly balloons into a prohibitively expensive problem. It simply takes a computer far too long to calculate solutions for so many points.

    One technique that’s been developed to save time is Adaptive Mesh Refinement. You can see an example of it above. The background is a grid of points that are far from one another in places where the flow isn’t changing and are tightly spaced in areas where the rising flames are most changeable. Adaptive Mesh Refinement algorithms automatically change these grid points on the fly, adding more where they’re needed and subtracting them where they aren’t. The end result is a much faster computational result that doesn’t sacrifice accuracy. Check out the videos below for some examples of this technique in action. (Video and image credit: N. Wimer et al.)

  • Featured Video Play Icon

    Creating Biofuel

    One production technique for biofuel converts agricultural waste through pyrolysis. These systems heat biomass particles in a mixture of sand and nitrogen gas until the biomass particles release tar and syngas, a key ingredient of biofuel. All this heating and mixing takes place in a fluidized bed, where the injected nitrogen gas helps the particle mixture move like a fluid.

    Building prototypes of these systems can be costly, so industry has largely relied on computational studies to predict performance. But capturing the complicated physics behind turbulent gas and particle interactions is tough, and some models discard key information in favor of faster and cheaper simulations. In this study, the authors found that clustering between particles has a major effect on syngas production, something that industrial studies must account for. 

    This is one of the challenges of computational fluid dynamics; although the codes have become more and more accessible over time, getting reliable results still requires a solid understanding of the strengths and limitations of each model used. (Image, video, and research credit: S. Beetham and J. Capecelatrosource; submitted by Jesse C.)

  • Featured Video Play Icon

    Modeling Oobleck

    Oobleck – that peculiarly behaved mixture of cornstarch and water – continues to be a favorite of children and researchers both. Oobleck flows like a liquid when deformed slowly, but try to move it quickly and it will seize up like a solid. This sudden change depends on the tiny particles of cornstarch suspended in the liquid. When they’re given time, electrostatic forces between the particles help them repel one another and keep the liquid flowing. But under sudden impacts, the particles get jammed together and the friction between neighboring grains makes the viscosity of the fluid increase by orders of magnitude. 

    Researchers are now able to model these particle interactions numerically, which will help them predict how oobleck and similar substances will behave in applications like body armor or pothole repair. (Video credit: MIT; via MIT News; research credit: A. Baumgarten and K. Kamrin)

  • Bay of Fundy Tides

    Bay of Fundy Tides

    Canada’s Bay of Fundy has some of the wildest tidal flows in the world. Every six hours, the flow direction through the strait shifts and tidal currents rise to several meters per second. This creates distinct jets a couple kilometers long that pour from one side of the strait to the other. 

    What you see here is a numerical simulation of the flow using a technique called Large Eddy Simulation (or LES, for short). It’s one method used by fluid dynamicists to model turbulent flows without taking on the complexity of the full Navier-Stokes equations. At large lengthscales, like those of the jets and eddies we see above, LES uses the exact physics. But when it comes to the smaller scales – like the flow nearest the shores or the bottom of the strait – the simulation will approximate the physics in order to make calculations quicker and easier. Models like these make large-scale problems – including modeling our daily weather patterns – possible. (Image credit: A. Creech, source)

  • Anak Krakatoa Landslide

    Anak Krakatoa Landslide

    Last December, the collapsing flank of the Anak Krakatoa volcano caused a deadly tsunami in Indonesia. Using satellite imagery, scientists have now constructed a timeline of the island’s dramatic restructuring. In the process, they found that the landslide that triggered the tsunami was likely much smaller than originally estimated.

    Their evidence shows that the landslide and tsunami (Image B) occurred before the eruption that destroyed the volcano’s cone. In fact, the landslide seems to have created a vent that opened directly underwater, which explains the increased violence of the eruption in late December and the eventual destruction of the volcano’s cone (Image C). After that, the underwater vent closed off and the eruption returned to its quieter state as the volcano began rebuilding its cone (Image D).

    The key finding here is that the initial landslide contained roughly a third of the material originally estimated. That means our tsunami models have been seriously underestimating the catastrophic potential of smaller volcanic landslides. Hopefully the lessons we learn from Anak Krakatoa will help us avoid future tragedies. (Image and research credit: R. Williams et al.; via BBC; submitted by Kam-Yung Soh)