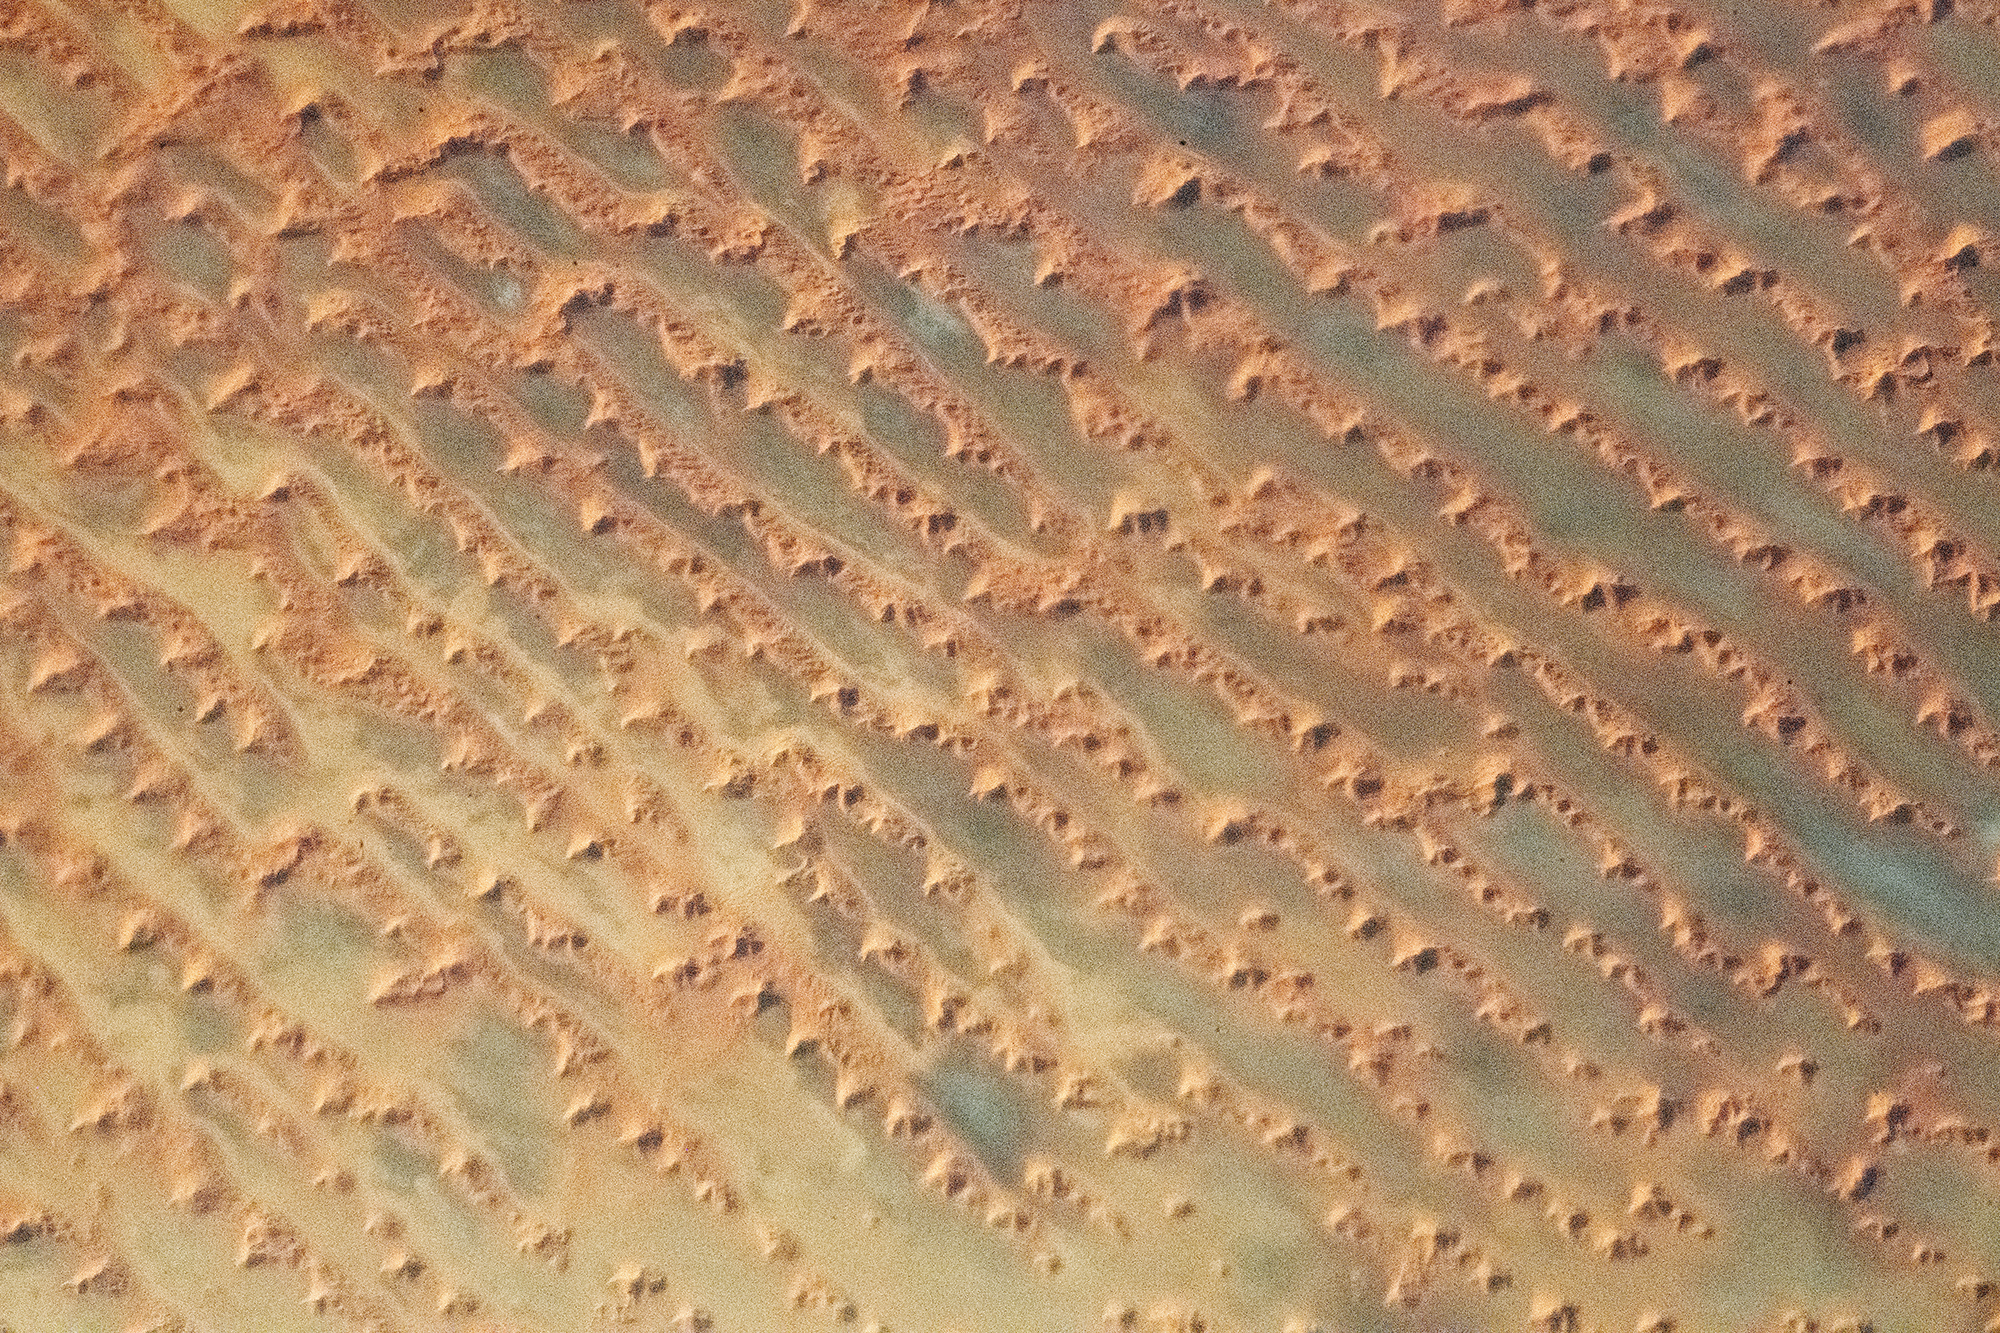
Sometimes landscapes have a beauty that’s hard to see from the ground. This astronaut’s photo shows a dune field in the sand seas of Saudi Arabia. Vast linear dunes line up along the direction of prevailing winds. Atop these dunes are more complex formations, star dunes, that are built up in the wake of changing winds. Built from three or more intersecting arms, the star dunes are steeper than the linear dunes they sit atop. Such complex dune fields — with multiple types of dunes — form in areas with especially abundant sands. (Image credit: NASA; via NASA Earth Observatory)
Tag: fluid dynamics

“Emerald and Stone”


“Emerald and Stone” is filmmaker Thomas Blanchard’s tribute to the music of Brian Eno. The short film is made, as Blanchard puts it, with “inks and painting,” but I suspect there’s some oil in there, too, to coat the droplets we see. Much of the movement is likely driven by surface tension variations in the background fluid. I love the effect this has on the droplets. If you watch closely, some of them appear to rotate like a miniature planet; others have counter-rotating sections within the drop. The difference, I suspect, is one of scale: I think the smaller drops rotate altogether while larger ones develop more complex internal flows. (Video and image credit: T. Blanchard)

Modeling Wildfires With Water
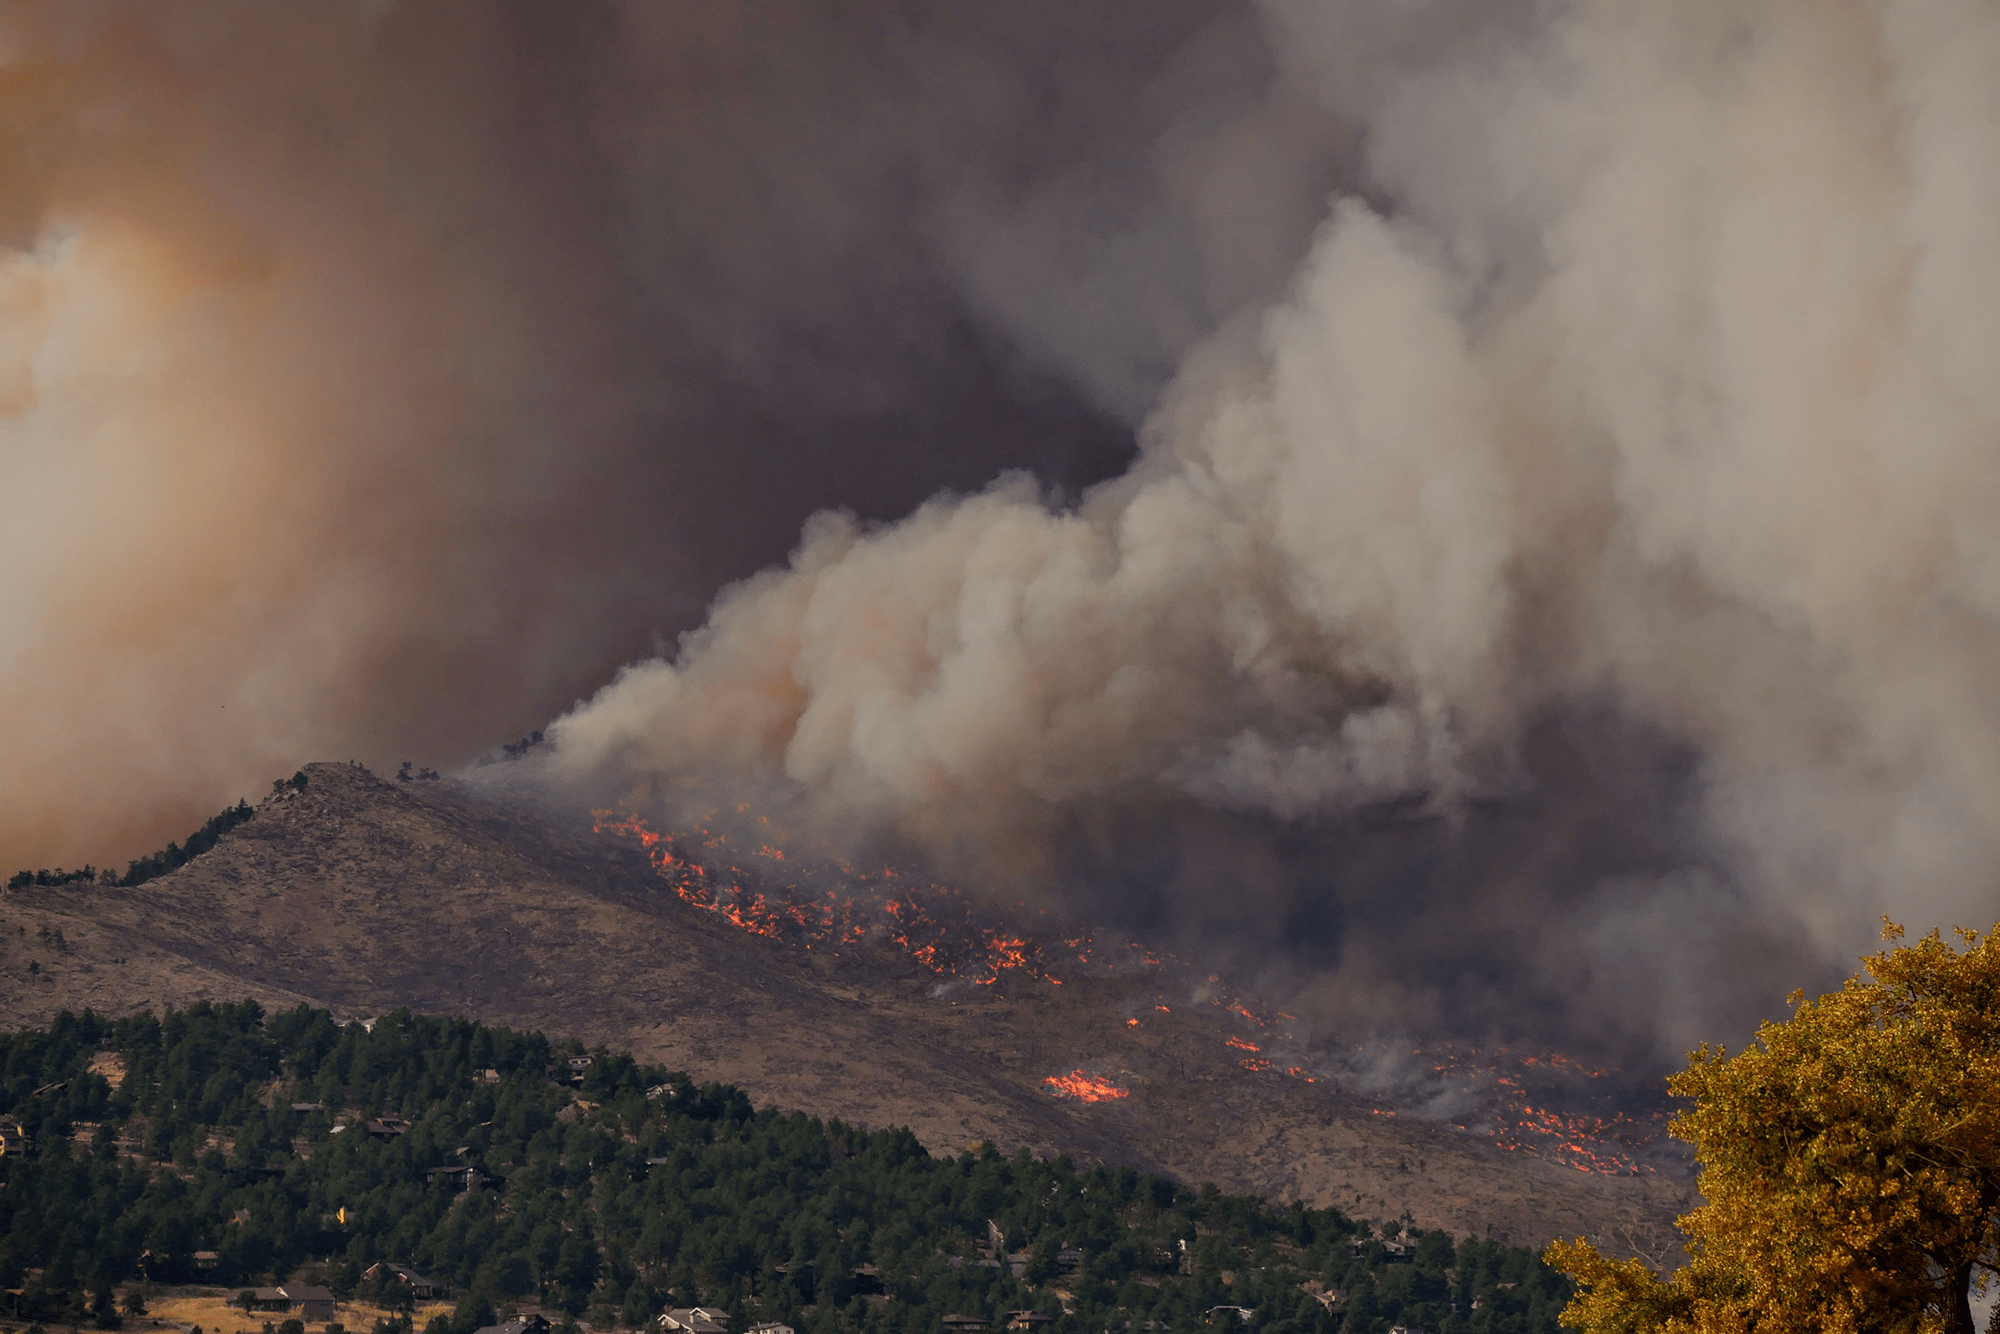
Turbulence over a burning forest can carry embers that spread the wildfire. To understand how wildfire plumes interact with the natural turbulence found above the forest canopy, researchers modeled the situation in a water flume. Dowel rods acted as a forest, with turbulence developing naturally from the water flowing past. For a wildfire, the researchers used a plume of warmer water, which buoyancy lofted into the turbulence over their model forest.

The experiment used to model wildfire flows. Dowel rods represent the forest and a plume of warm water (right side; distorting the background) represents the wildfire. The dark device in the foreground is a probe used to measure turbulence. The flow over the forest canopy naturally forms side-by-side rolls of air rotating around a horizontal axis. As the buoyant plume rises, it can be torn apart by these rollers, as well as carried downstream. Varying the turbulence, they found, did not affect the average trajectory of the plume. But the more intense the turbulence, the greater the vertical fluctuations in the plume. Those large variations, they concluded, could lift more embers into stronger winds that distribute them further and spread a fire faster. (Image credit: wildfire – M. Brooks, experiment – H. Chung and J. Koseff; research credit: H. Chung and J. Koseff; via APS Physics)

Clouds Down Under
This large and unusual cloud formation was captured one July morning over western Australia. Stretching over 1,000 kilometers, the clouds have interesting features at both the large and small scale. The small-scale ripples within the clouds are gravity waves triggered by the terrain below. The larger, arced features are tougher to explain, though they may also be related to gravity waves and terrain, just on a much larger scale. They also resemble fallstreak clouds where supercooled droplets evaporate from the inside of the cloud out. (Image credit: W. Liang; via NASA Earth Observatory)

Predicting Landslides
Landslides can cause catastrophic damage, but historically it’s been difficult to monitor susceptible slopes and predict when they’ll fail. But a recent study looking at the 2017 Mud Creek landslide in California shows that new methods could provide a heads up.
The researchers used satellite data from the months preceding the landslide to study how areas on the slope moved relative to one another. Within their survey region, they found sub-regions where ground locations largely moved together. These sub-regions, called communities in the researchers’ parlance, were remarkably persistent, showing little variation over long periods. But 56 days before the landslide, the researchers saw a sudden change between the communities on the slope. They believe their methodology could help identify slopes in danger of imminent slides.
So far, though, they’ve only applied this method to the Mud Creek landslide. It’s a promising start, but they’ll need to show that the technique works for other slides as well. If so, it will be a major step forward in landslide prediction. (Image credit: USGS; research credit: V. Desai et al.; via APS Physics)
To Clog or Not to Clog?


The clear plastic disks use to study clogging appear rather plain — at least until you look at them through polarizers. Then the disks light up with a web of lines that reveal the unseen forces between the particles. In this video, researchers use this trick to explore how spontaneous clogs occur. If particles jam together into an arch, that bridge can be strong enough to hold the weight of all the particles above it, bringing the flow to a halt. Some arches aren’t strong enough to hold for long; they can break in moments. Other more stable arches persist. By watching the flow through polarizers and carefully tracking the ebb and flow of the forces between particles, researchers can predict which clogs will have staying power. (Video credit: B. McMillan et al.)
“Vorticity 5”


Photographer and stormchaser extraordinaire Mike Olbinski is back with the fifth volume in his “Vorticity” series. Shot over the 2022 and 2023 tornado seasons in the U.S. Central Plains, this edition has virtually everything: supercells, microbursts, lightning, tornadoes, and haboobs. There’s towering convection and churning, swirling turbulence. It’s a spectacular look at the power and grandeur of our atmosphere. (Video and image credit: M. Olbinski)

Forming Zigzags
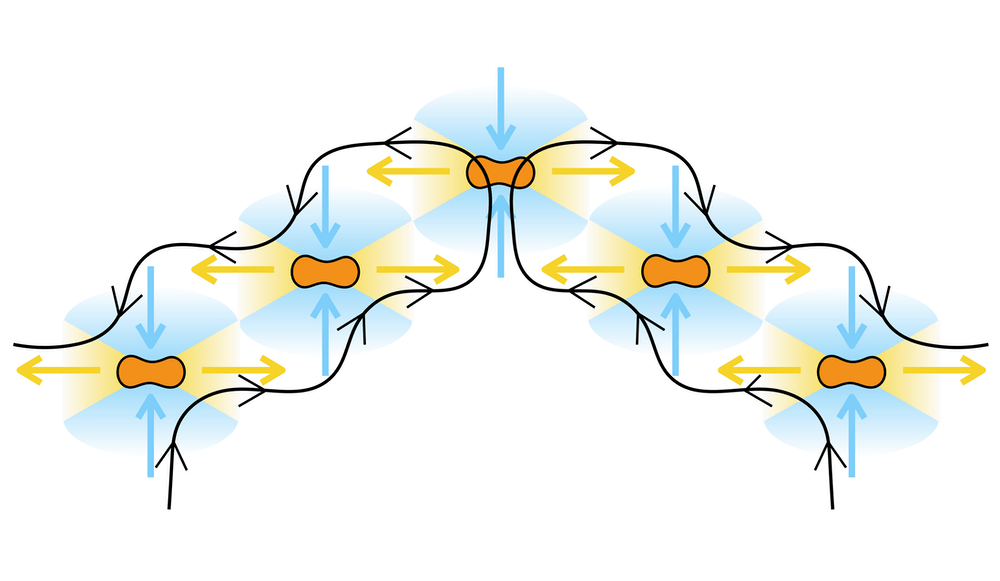
Scientists are fascinated by the organized patterns that can emerge from non-living systems. Here, researchers study micron-sized magnetic particles, immersed in a viscoelastic fluid and subjected to an oscillating magnetic field. The peanut-shaped particles roll around their long axis and assemble to form millimeter-sized bands of zigzags. These patterns, the researchers found, do not depend on the particles’ specific shape or on the details of the applied magnetic field. Instead, the zigzags depend only on the symmetry of the flow generated around each particle. In their system, illustrated above, each particle pushed fluid away along their long axis and drew in fluid toward their waist; as a result, particle pairs would attract or repel, depending on their relative orientation. That interparticle force ultimately caused the particles to self-organize into zigzags. (Image, video, and research credit: G. Junot et al.; via APS Physics)

This sped-up animation shows the zigzag pattern that the particles self-organization into. 
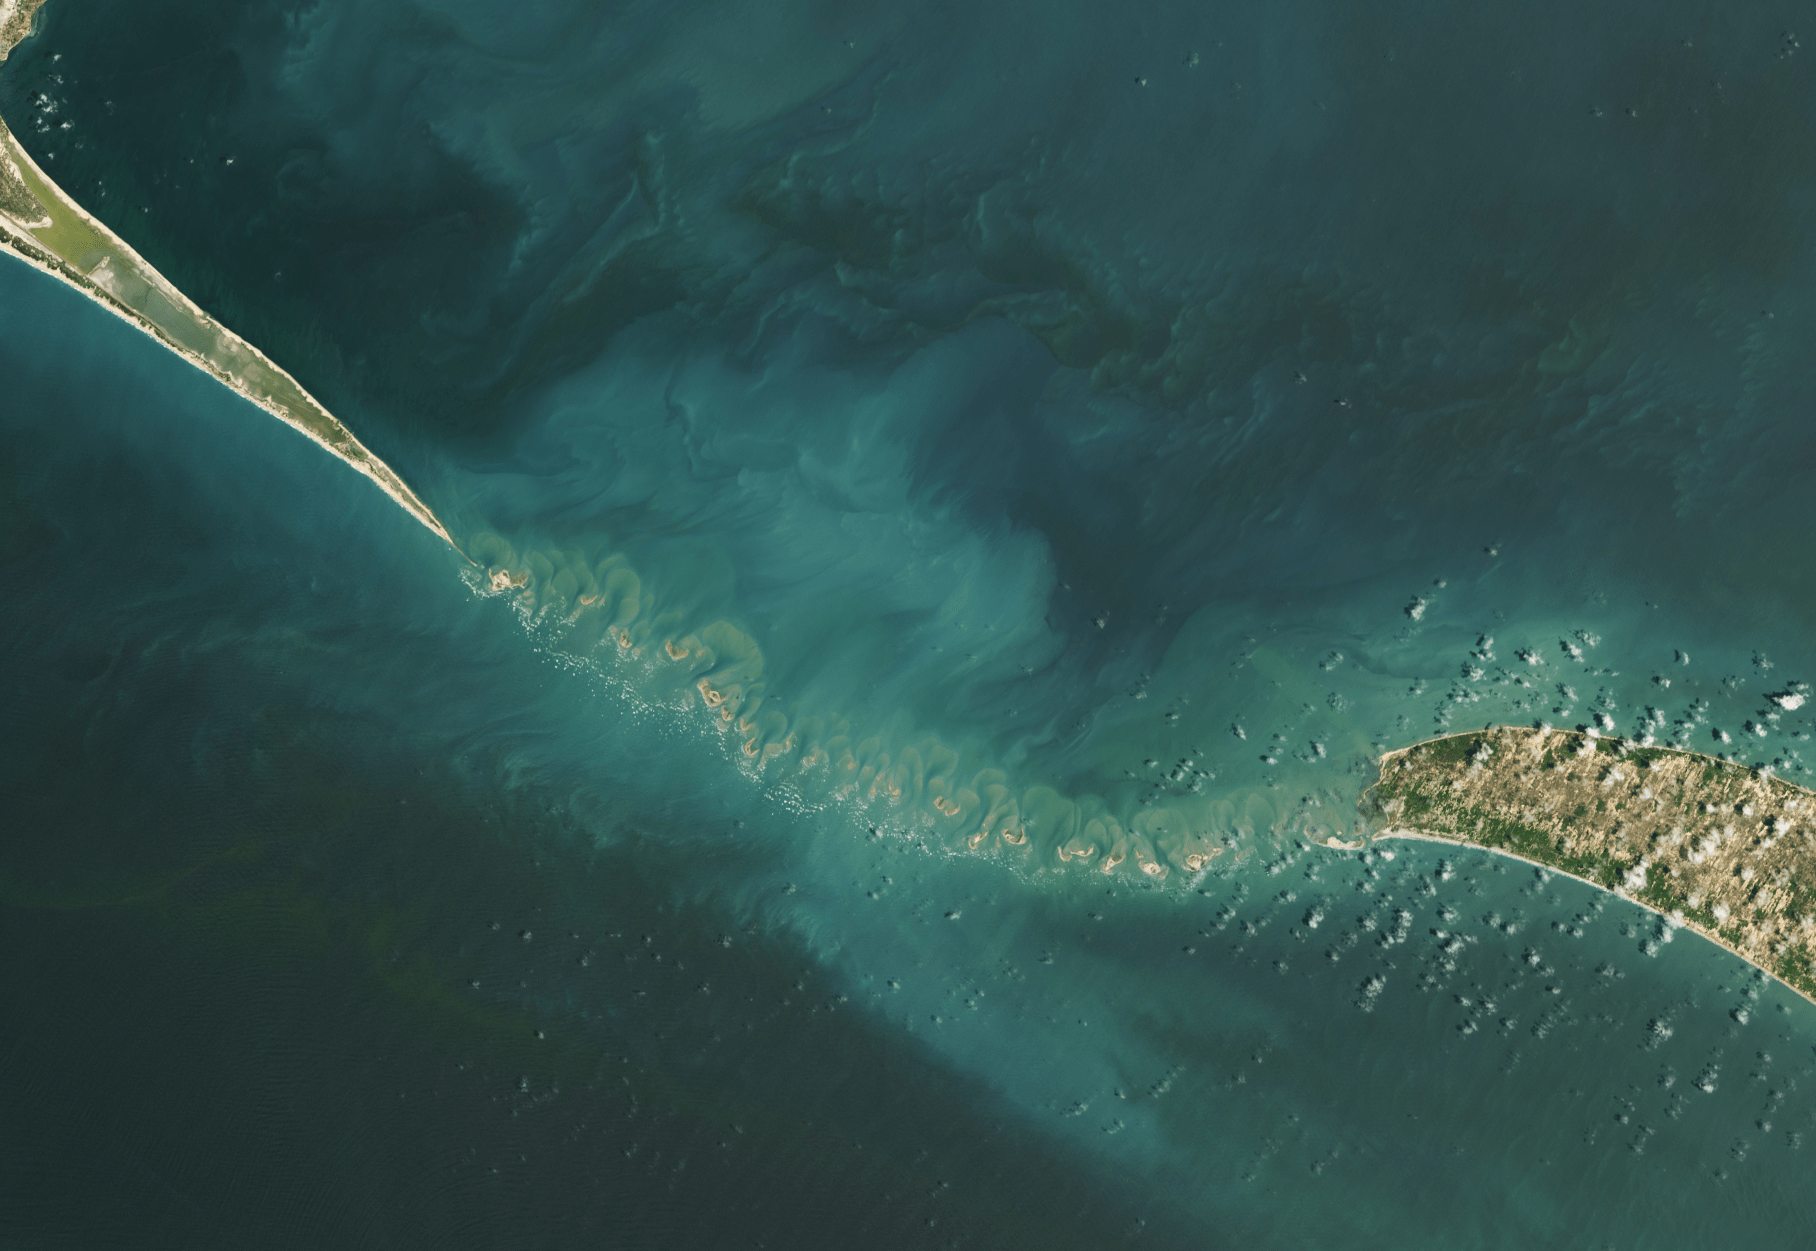
Painting in Sediment
Pale plumes of sediment flow off these islands in the Gulf of Mannar between India and Sri Lanka. As waves erode the land, currents and tides carry the sediment outward, shaping it into swirls and eddies. I rarely tire of satellite images like these because there are always subtle new details of flow to notice. The photos are much like paintings, with layer after layer to decipher the closer you look. (Image credit: A. Nussbaum; via NASA Earth Observatory)

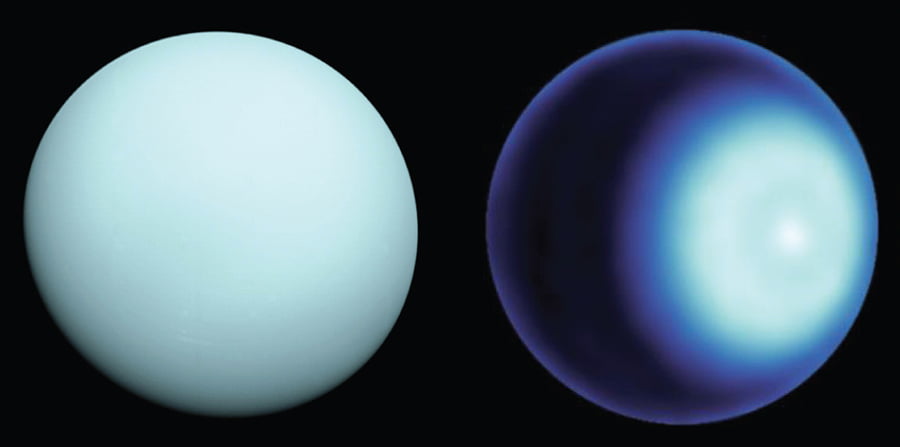
Uranus’s Polar Cyclone
Uranus is an oddity among the planets of our solar system. Where other planets spin around an axis roughly in line with their orbital axis, Uranus spins on its side, placing its poles in line with the sun. On Earth, the polar regions are naturally colder the equator, but that doesn’t hold true for Uranus. Yet new observations of the ice giant show that it, like the other planets with atmospheres in our solar system, has a polar cyclone.
Those observations are thanks to improvements in radio astronomy over the past couple decades. Uranus’s odd orbital geometry means that each of its poles are hidden from Earth for 42 years at a time; the current northern-hemisphere spring marks our first view of Uranus’s northern pole since 1965. In the recent observations, researchers saw a bright spot on the pole, surrounded by a faint darker ring. The team modeled the temperature and gas composition necessary to match their observations and found that those patterns were consistent with a cyclone sitting at the northern pole. (Image credit: NASA/JPL-Caltech/VLA; research credit: A. Akins et al.; via Physics Today)