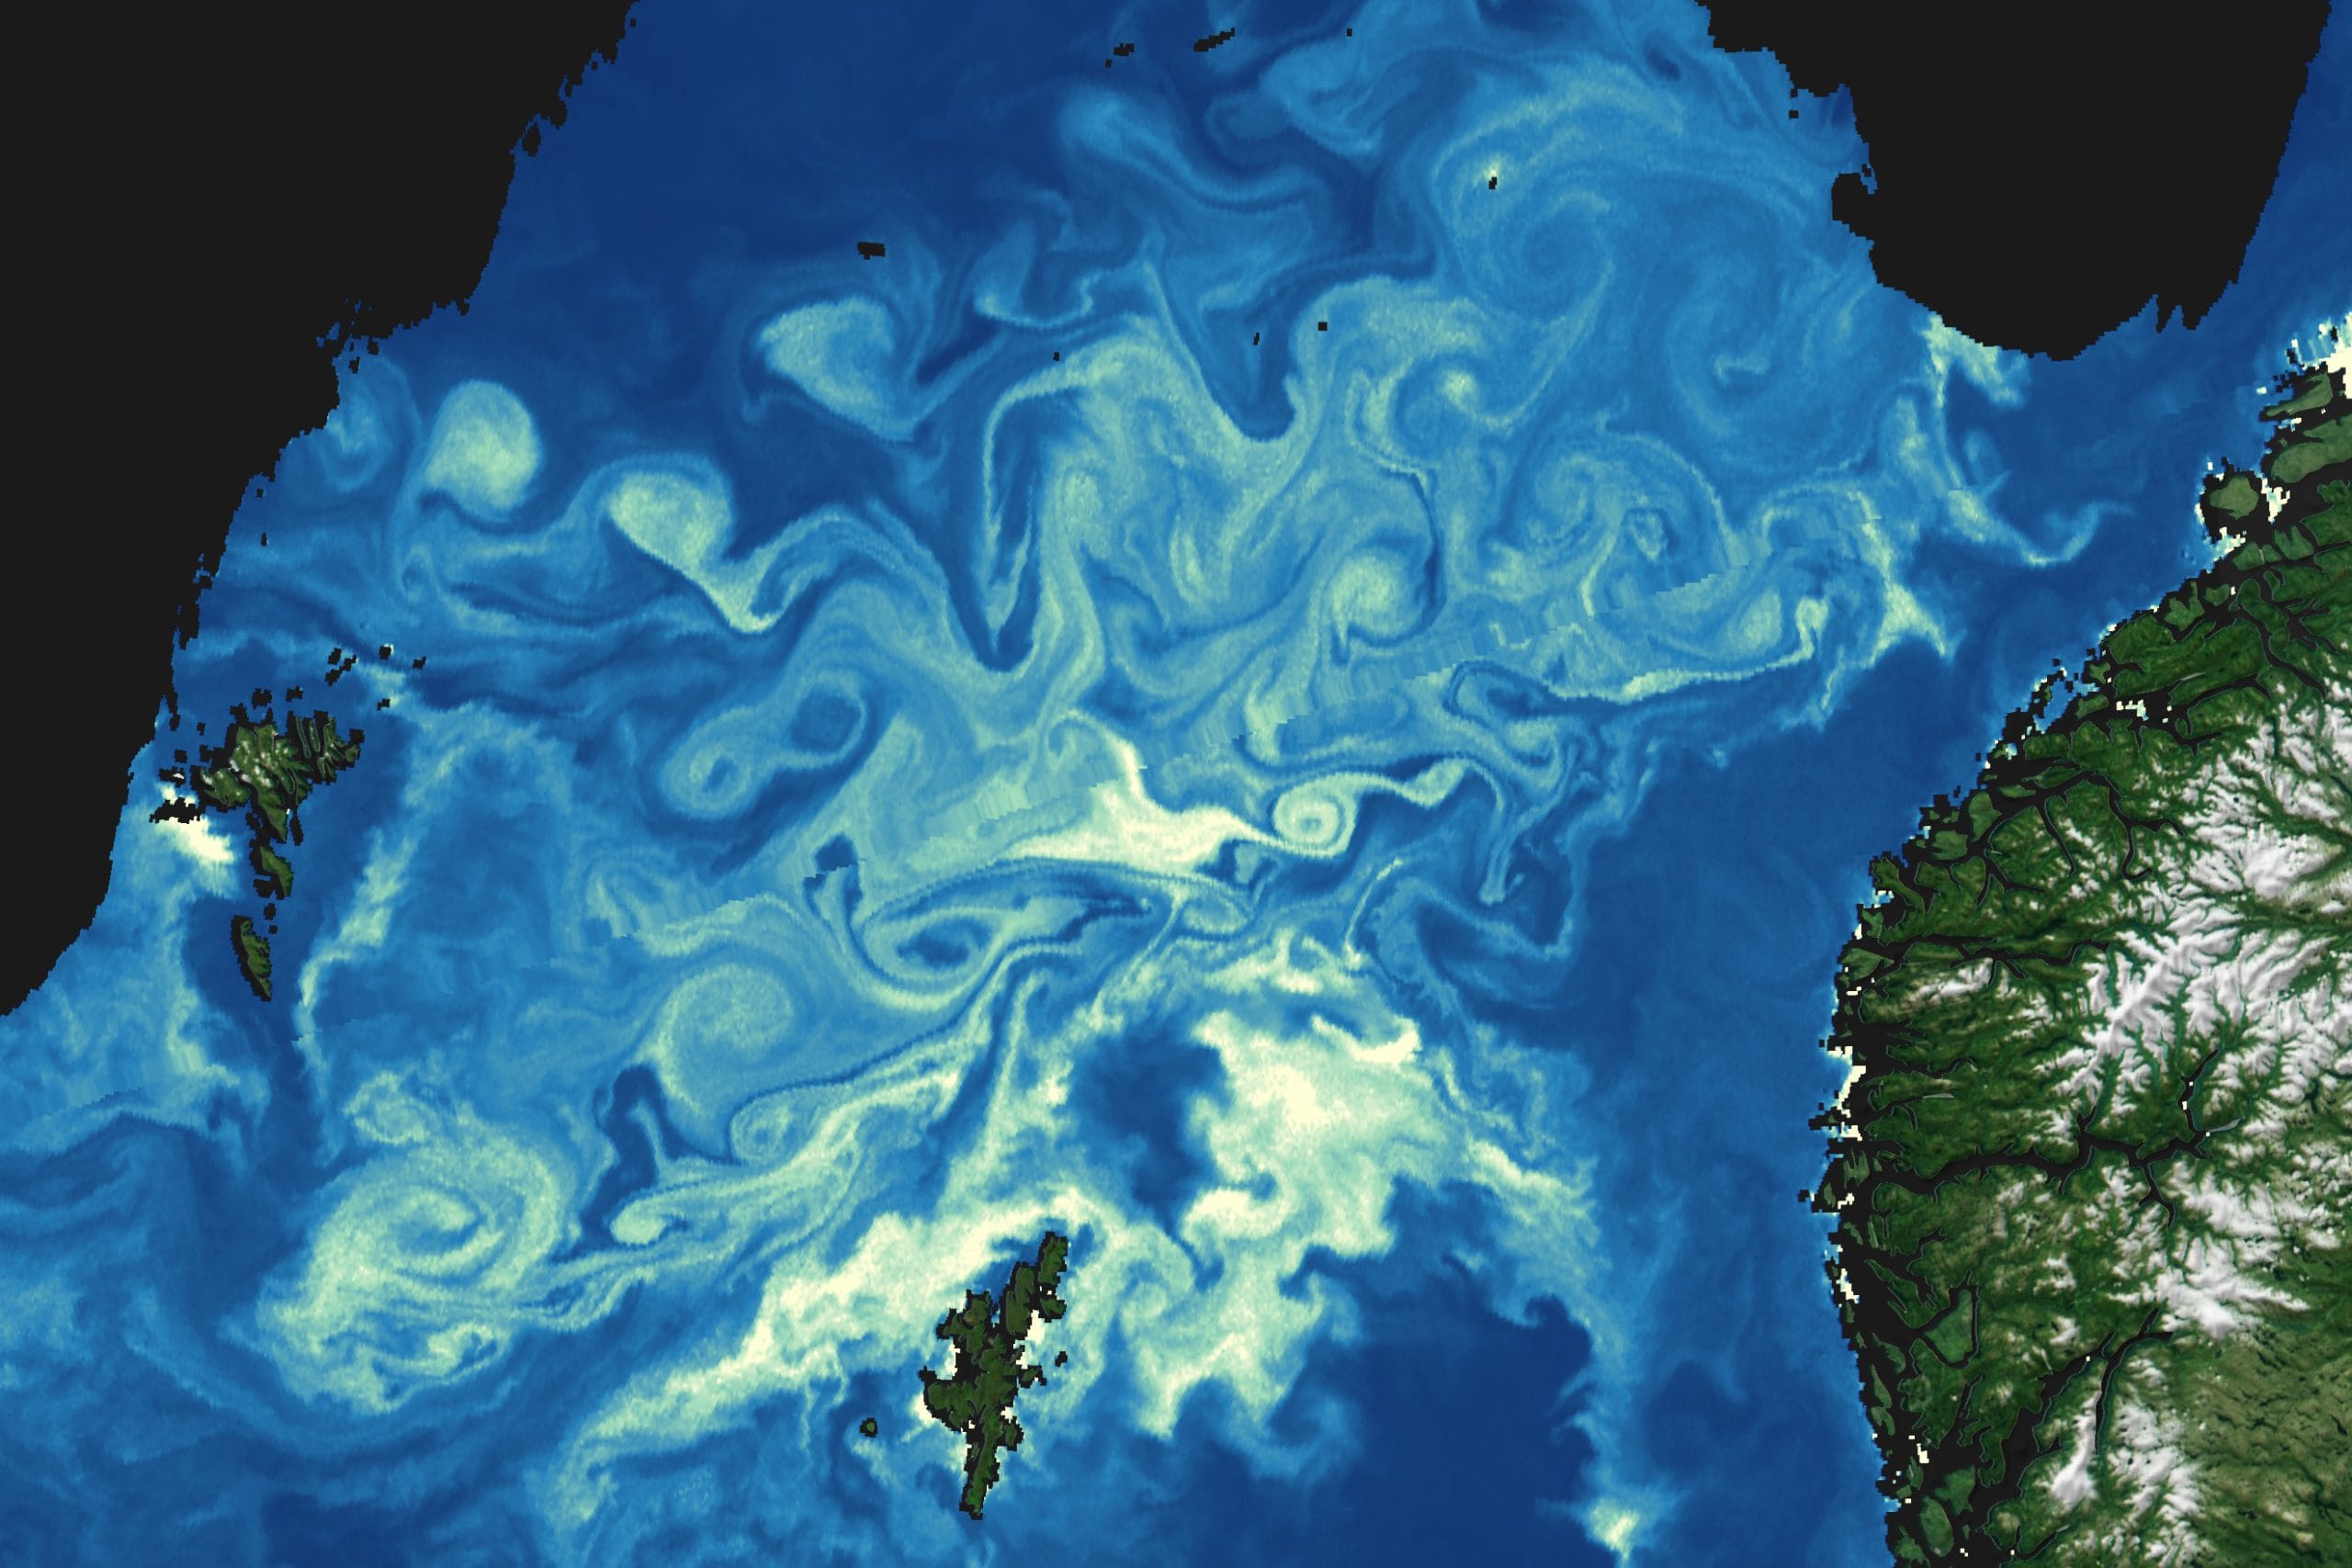
Tag: eddies

  • Baltic Bloom

    Baltic Bloom

    June and July brings blooming phytoplankton to the Baltic Sea, seen here in late July 2025. On-the-water measurements show that much of this bloom was cyanobacteria, an ancient type of organism among the first to process carbon dioxide into oxygen. These organisms thrive in nutrient- and nitrogen-rich waters. Here, they mark out the tides and currents that mix the Baltic. Zoom in on the full image, and you’ll see dark, nearly-straight lines across the swirls; these are the wakes of boats. (Image credit: M. Garrison; via NASA Earth Observatory)

    Fediverse Reactions
  • Lines of Ice Eddies

    Lines of Ice Eddies

    In February 2024, the North Atlantic’s sea ice reached its furthest extent of the season, limning the coastline with tens of kilometers of ice. These images — both capturing the Labrador coast on the same day — show the swirling patterns marking the wispy edges of ice field. In this region, the ice is likely following an eddy in the ocean below. Eddies like these can form along the edges where warm and cold currents meet. An ice eddy is particularly special, though, as the water must be warm enough to fragment the sea ice, but not so warm that it melts the smaller ice pieces. (Image credit: top – NASA, lower – M. Garrison; via NASA Earth Observatory)

    This satellite image shows sea ice off the Labrador coast, on the same day in February 2024.
    This satellite image shows sea ice off the Labrador coast, on the same day in February 2024.
  • Swirls of Green and Teal

    Swirls of Green and Teal

    Captured in March 2024, this satellite image of the Gulf of Oman comes from an instrument aboard the PACE spacecraft. The picture of a phytoplankton bloom is not quite natural-color, at least not as our eyes would see it. Instead, engineers combined data taken from multiple wavelengths and adjusted it to bring out the fine details. It’s not what we’d see by eye, but every feature you see here is real.

    Traditionally, the only way to identify the species of a phytoplankton bloom like this one is by taking a sample directly. But PACE’s instruments can detect hundreds of wavelengths of light, offering enough color detail that scientists may soon be able to identify and track phytoplankton species by satellite image alone. I wonder if distinguishing species could also provide some quantitative flow visualization from a series of these images. In the meantime, at least we can enjoy the view! (Image credit: J. Knuble; via NASA Earth Observatory)

  • Sediment Swirls

    Sediment Swirls

    Turbulent flows feature swirling eddies over a range of sizes — the larger the size range, the higher the Reynolds number. In this satellite image, sediment highlights these eddies in shades of turquoise, showing off the complexity of the flows created where rivers, ocean, and tides meet. The eddies we see here stretch from kilometers in width down to a handful of meters, but the flow’s turbulence persists down to millimeter-scales before viscosity damps it out. (Image credit: L. Dauphin; via NASA Earth Observatory)

    Fediverse Reactions
  • Atlantic Blooms

    Atlantic Blooms

    In April 2023, swirls of green and turquoise burst into vivid color in the Atlantic. Much of the color comes from a phytoplankton bloom. Although phytoplankton are individually microscopic, they form eddies a hundred kilometers across that are visible from space. In detailed images like the one above (available here in full resolution) these swirls have amazing turbulent details. Some of the brightest sections almost look like a field of sea ice! (Image credit: L. Dauphin; via NASA Earth Observatory)

    This wider view shows the bloom's location off of the northeastern U.S.
  • Blooms in the Black Sea

    Blooms in the Black Sea

    The Black Sea gains its name from its dark waters, but those waters don’t stay dark year-round. In this natural color satellite image, streaks of milky blue bloom through the summer waters, thanks to the presence of a species of phytoplankton armored with white calcium carbonate. Despite their microscopic size, the phytoplankton’s presence is visible from space. During other parts of the year, like the spring, another species of phytoplankton dominates the Black Sea, turning its waters darker. (Image credit: J. Stevens; via NASA Earth Observatory)

  • Watery Salt Flats

    Watery Salt Flats

    Unusually high rainfall in Bolivia’s Salar de Uyuni turned the world’s largest salt flat into a shallow salt lake. These natural-color satellite images show the area in late January 2022. If you zoom in on the full resolution image, there are incredible detailed swirls in the water. It’s like peering at an abstract or Impressionist painting. The many colors are attributable to several sources, including volcanic sediments, runoff, and a variety of microbes and algae thriving in the mineral-filled waters. (Image credit: L. Dauphin; via NASA Earth Observatory)

  • “Phoenix Rising”

    “Phoenix Rising”

    This aerial photo of Lake Owens by Paul Hoelen won a 2020 Drone Photo Award in the Abstract category. As Hoelen notes, “The phoenix rising is a symbol of re-emergence from the ashes of fire.” Lake Owens was used for years in mining and other industries, which left the lake desiccated and depleted. But nature is beginning to recover; migratory birds have returned to the lake, and life is beginning anew. (Image credit: P. Hoelen; via Colossal)

  • Two Views of Ocean Eddies

    Two Views of Ocean Eddies

    Colorful, sediment-laden eddies swirl off the Italian coast in this satellite image. These small-scale eddies — less than 10 km in diameter — can be short-lived and are often difficult to capture in numerical models, but remote sensing can help scientists better understand their impact on oceanic mixing, especially when we capture more than one view of the same event.

    The image below shows the same eddies in an infrared (thermal) view. The resolution on this instrument is not as fine as the natural color one, but we can still make out some of the same swirling motions. It’s also worth comparing the features we don’t see in both images. For example, the Cornia River discharges in infrared as a bright, white plume of cooler water, but it’s barely visible in the color-image, suggesting that the river is not contributing much sediment to the bay. (Image credit: USGS; via NASA Earth Observatory)

    Infrared satellite image of waters off the coast of Italy.
  • Icy Swirls

    Icy Swirls

    Rafts of sea ice follow swirling eddies in this satellite image of the Gulf of St. Lawrence. Just as with phytoplankton blooms and sediment, this thin sea ice can be moved by wind and currents to reveal hidden flow patterns. Experimentalists use many similar diagnostics that introduce bubbles, particles, smoke, and other tracers into flows to visualize motion that’s otherwise invisible. (Image credit: J. Stevens/NOAA/NASA; via NASA Earth Observatory)