Tag: flow visualization

  • Swirls of Green and Teal

    Swirls of Green and Teal

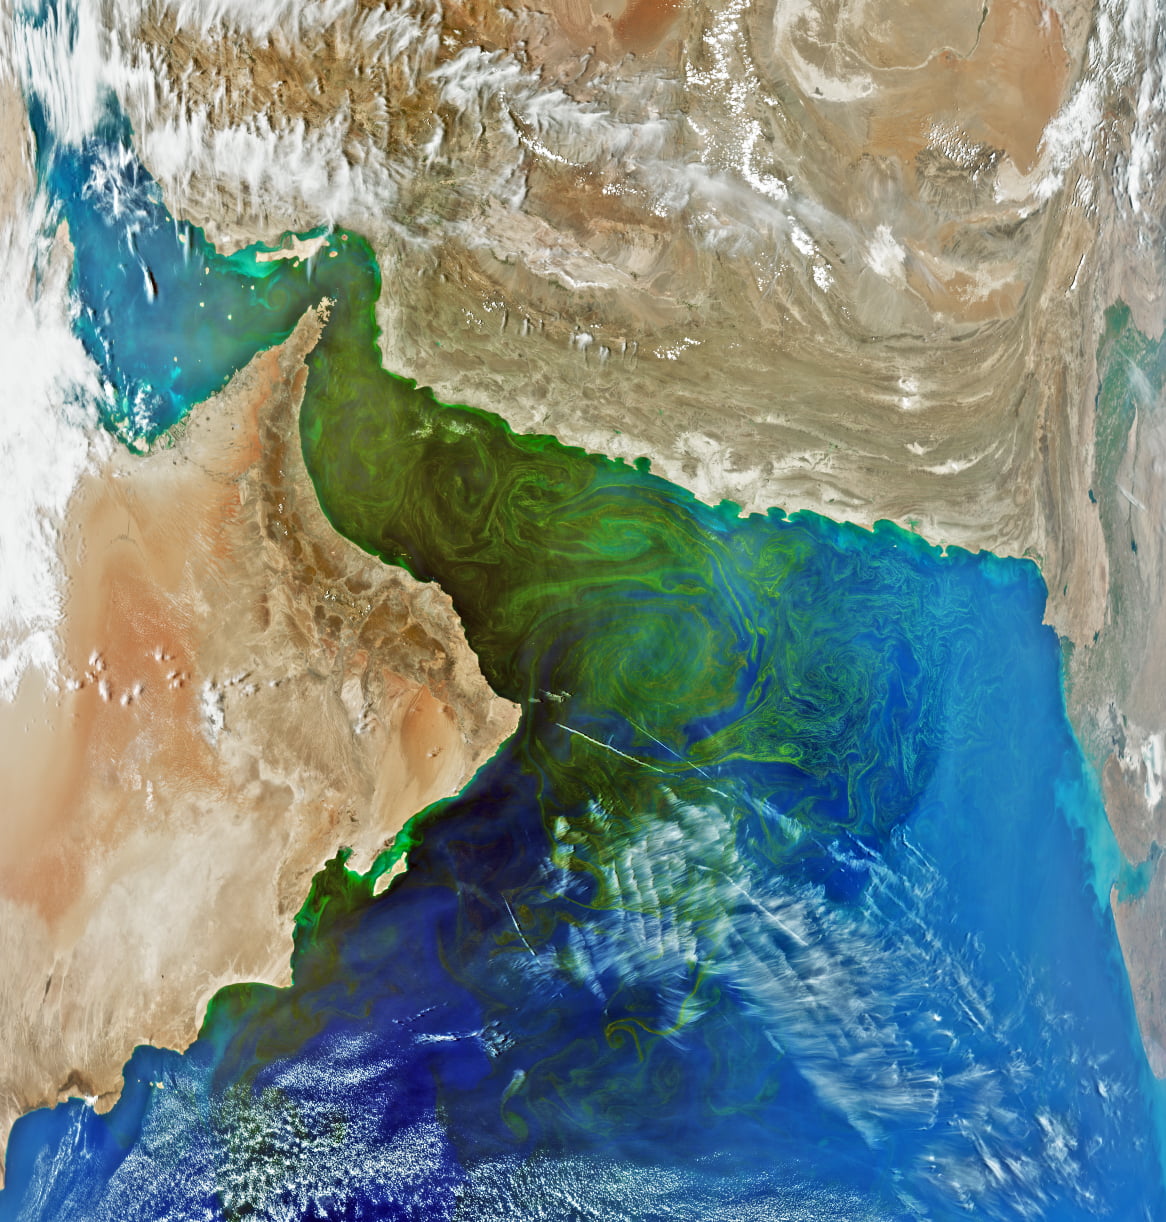
    Captured in March 2024, this satellite image of the Gulf of Oman comes from an instrument aboard the PACE spacecraft. The picture of a phytoplankton bloom is not quite natural-color, at least not as our eyes would see it. Instead, engineers combined data taken from multiple wavelengths and adjusted it to bring out the fine details. It’s not what we’d see by eye, but every feature you see here is real.

    Traditionally, the only way to identify the species of a phytoplankton bloom like this one is by taking a sample directly. But PACE’s instruments can detect hundreds of wavelengths of light, offering enough color detail that scientists may soon be able to identify and track phytoplankton species by satellite image alone. I wonder if distinguishing species could also provide some quantitative flow visualization from a series of these images. In the meantime, at least we can enjoy the view! (Image credit: J. Knuble; via NASA Earth Observatory)

  • Measuring Ocean Upwelling

    Measuring Ocean Upwelling

    Large-scale ocean circulation is critical to our planet’s health and climate. In this process, seawater near the poles cools and sinks into the deep ocean, carrying dissolved carbon and nutrients with it. Later, that cold water gets pushed back up to the surface elsewhere, where it warms, and the cycle repeats. Although the theory behind this circulation has been around for decades, it’s been difficult to observe the rise, or upwelling, of water from the depths. But a recent study used a fluorescent, non-toxic dye to measure upwelling directly.

    Researchers deployed 200 liters of dye just above the floor of a marine canyon near Ireland, then monitored the dye’s movement for several days at a depth of 2200. They found that turbulence along the slope of the canyon drove upwelling at speeds of about 100 meters per day, much faster than global rates. The authors suggest that this kind of topographically-enhanced upwelling could be a major factor in setting overall ocean circulation. (Image credit: visualization – NASA, ship – S. Nguyen; research credit: B. Wynne-Cattanach et al.; via Physics World)

  • Resolution Effects on Ocean Circulation

    Resolution Effects on Ocean Circulation

    The Gulf Stream current carries warm, salty water from the Gulf of Mexico northeastward. In the North Atlantic, this water cools and sinks and drifts southwestward, emerging centuries later in the Southern Ocean. Known as the Atlantic Meridional Overturning Circulation (AMOC), this circulation is critical, among other things, to Europe’s temperate climate. Since 1995, scientists have been warning that human-driven climate change is weakening the AMOC and may cause it to shut down entirely — which would have catastrophic consequences for our society.

    Comparison of ocean current speeds in the low-resolution (left) and high-resolution (right) simulations.
    Comparison of ocean current speeds in the low-resolution (left) and high-resolution (right) simulations.

    A recent study re-examined the AMOC using both low- and high-resolution numerical simulations, combined with direct observations. Both simulations covered 1950 – 2100 and found the AMOC’s strength has declined since 1950. But the high-resolution simulation found significant regional variations in the AMOC’s behavior. Some regions saw localized strengthening, while other areas showed abrupt collapse. These sensitive shifts underscore the importance of driving toward higher resolutions in our next-generation climate models, if we want to better understand — and perhaps predict — what lies ahead as our climate changes. (Image credit: illustration – Atlantic Oceanographic and Meteorological Laboratory, simulations – R. Gou et al.; research credit: R. Gou et al.; via APS Physics)

  • The Solar Corona in Detail

    The Solar Corona in Detail

    The sun’s corona — its outer atmosphere — is usually impossible to see, since it’s far outshone by the rest of the sun. But during a total solar eclipse, the moon blocks out all but the vibrant, wispy corona. Getting a detailed image of the corona is tough; it’s constantly shifting. For this image, engineer Phil Hart used 5 main cameras, 4 refractors, 2 laptops, and plenty of digital image processing to capture some incredible details of the plasma and hot gases dancing along the sun’s magnetic field lines. You can learn about the awesome effort behind this image — and see more awesome photos from the eclipse — at his site. (Image credit: P. Hart; via APOD)

  • Sediment Swirls

    Sediment Swirls

    Turbulent flows feature swirling eddies over a range of sizes — the larger the size range, the higher the Reynolds number. In this satellite image, sediment highlights these eddies in shades of turquoise, showing off the complexity of the flows created where rivers, ocean, and tides meet. The eddies we see here stretch from kilometers in width down to a handful of meters, but the flow’s turbulence persists down to millimeter-scales before viscosity damps it out. (Image credit: L. Dauphin; via NASA Earth Observatory)

    Fediverse Reactions
  • Featured Video Play Icon

    Playing With Water in 2D Containers

    Once again Steve Mould is putting his prototyping skills to use to work out what goes on inside tricky containers. Here he looks at a “magic” wizard’s cup where — like the assassin’s teapot — cleverly placed holes in the side of the cup can block or allow air’s escape. In the wizard’s cup this lets the wizard refill the cup at will.

    He also takes a look at how draining works, using tracer particles and a video editing effect that “echoes” previous frames in a video. For the tracer particles, this algorithm effectively visualizes pathlines in the flow. Areas with faster-moving fluid have longer pathlines that are closer together, whereas slow-moving regions have short pathlines. (Video credit: S. Mould)

  • Featured Video Play Icon

    “Emitter”

    For this latest experimental film, artist Roman De Giuli provides a glimpse of the unique fluid art machine he’s built over the last 3.5 years. With 10 channels driven by peristasltic tube pumps and stepper motors, his “printer” drips up to 10 colors on a paint-covered, tilted canvas to create these beautiful images. As he says in his description of the invention, the set-up produces paint layering that’s almost impossible to create by hand. Fluid dynamically speaking, we’re seeing gravity currents like a lava flow or avalanche that are mixing together viscously. There’s also some added effects from density differences between different layered paint colors. Artistically, this machine offers an infinite palette of visual opportunities; financially, though, De Giuli admits its an absolute beast at consuming paint! (Image and video credit: R. De Giuli)

  • Viscous Fireworks

    Viscous Fireworks

    Inject a less viscous fluid into a gap filled with a more viscous fluid, and you’ll get finger-like patterns spreading radially. Here, researchers put a twist on this viscous fingering by taking turns injecting different liquids. Each injection cycle disrupts what came before, layering fingering patterns on fingering patterns. The results resemble fireworks. Happy 4th of July! (Image credit: C. Chou et al.)

  • Star-Birthing Shock Waves

    Star-Birthing Shock Waves

    Although the space between stars is empty by terrestrial standards, it’s not devoid of matter. There’s a scattering of cold gas and dust, pocked by areas known as prestellar cores with densities of a few thousand particles per cubic centimeter. This is just enough matter to help gravity eventually win its tug of war with the forces that would drive molecules apart.

    When shock waves pass through these regions — whether thrown off a dying star or a newly birthed one — they compress the material, kickstarting the process of stellar formation. Passing shock waves can also shake loose molecules stuck to the dust, providing key tracer elements that astronomers can use to visualize shock waves and the areas they affect. To learn more, see this article over at Physics Today. (Image credit: NASA/ESA/CSA/STSCI/K. Pontoppidan/A. Pagan; see also Physics Today)

  • Dripping Viscoelastics

    Dripping Viscoelastics

    An ultrasoft viscoelastic fluid drips in this research poster from the Gallery of Soft Matter. Complex materials like this one have stretchy, elastic behaviors typical of a solid along with the flowing, viscous properties of a fluid. Here, gravity overcomes the material’s elasticity, leaving it to sag and flow. As that happens, the fluid must slide past air, and the density difference between the two fluids creates the small distortions seen on the liquid sheet. This is an example of a Rayleigh-Taylor instability. (Image credit: J. Hwang et al.)