The colors of a soap film are directly related to their thickness. If a film becomes thin enough (~10 nanometers), it appears black. (Here’s why.) This video shows the thinning of a vertical soap film. Normally, this is a linear process, with gravity pulling the fluid downward and progressively thinning the film from top to bottom at a constant rate. At 0:20 a cold rod slowly contacts the film, adding a thermal driver for the film’s thinning. Two large counter-rotating convection cells form underneath the rod, with weaker secondary vortices in the lower corners of the film. This drastically increases mixing in the film. Gradually small black spots, indicating very thin areas of the film, form and advect. Eventually these spots stretch, forming long tails. The thinning of the film kicks up to an exponential rate until the film becomes uniformly thin. (Video credit: M. Winkler et al.)
Tag: convection

Mushrooms Make Their Own Breeze
Mushrooms don’t rely on a stray breeze to spread their spores; they generate their own air currents instead. The key is evaporation. The mushroom cap contains large amounts of water, and, as this water evaporates, it cools the mushroom and the air next to it. This cool air is denser than the surrounding air, and so tends to spread out and convect. At the same time, though, the water vapor that evaporated from the mushroom is less dense than nearby air, which helps it rise. This combination of spreading and rising air carries spores away from the mushroom cap and, as seen in the video above, can combine to form beautiful and complex currents that spread the spores. (Video credit: E. Dressaire et al.)
Liquid Crystal Films
Smectic liquid crystals can form extremely thin films, similar to a soap bubble, that are sensitive to electrically-induced convection. Here an annular smectic film lies between two electrodes. When a voltage is applied across it, positive and negative charges build up on the surface of the film near their respective electrodes. The electrical field surrounding the fluid pushes on the surface charges, causing flow inside the film. Above a threshold voltage, an instability forms and the film develops into a series of counter-rotating vortices, which spin faster as the voltage increases. The color variations in the video above are due to differences in the film’s thickness, much like iridescence of a soap bubble. (Video credit: P. Kruse and S. Morris)
10 Years of Weather
This timelapse video captures the past 10 years’ worth of weather as seen by the GEOS-12 satellite during its service. It’s a mesmerizing look at the large-scale convective flow of Earth’s atmosphere. The prevailing winds for each region are clear from the motion of the clouds, but short-term effects are visible as well. June through November marks the Atlantic hurricane season, and you can see as storm after storm gets generated near western Africa and shoots westward toward North and Central America. You can also see the pattern tracks of these storms in these maps, which show 170 years’ worth of worldwide hurricane tracks. (Video credit: NOAA; via Scientific American)

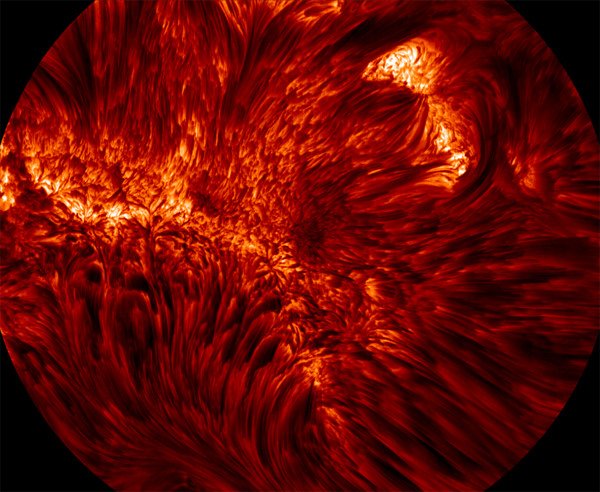
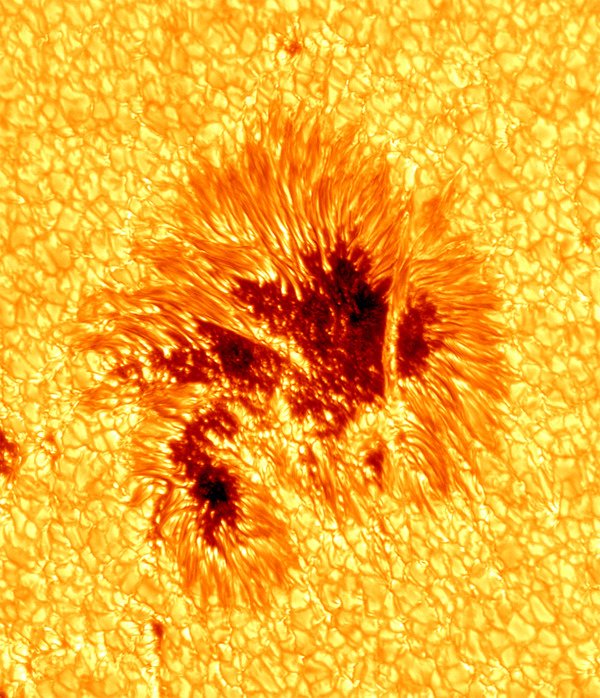
Convection on the Sun

New photographs showing ultra-fine structure in the sun’s chromosphere and photosphere have been released. They offer a fascinating view into the magnetohydrodynamics of the sun, where the fluid behaviors of plasma are constantly modified by the sun’s magnetic field. The left image shows fine-scale magnetic loops rooted in the photosphere, while the right image shows our clearest photo yet of a sunspot. The dark central portion is the umbra, where magnetic field lines are almost vertical; it’s surrounded by the penumbra, where field lines are more inclined. Further out, we see the regular convective cell structure of the sun. (Photo credit: Big Bear Solar Observatory/NJIT; via io9 and cnet)
Super-Highway Convection
In the ocean, many forces compete in driving convection, including the temperature and salinity of the water. In the laboratory, it’s possible to mimic these characteristics of oceanic circulation using two different fluids driven by temperature and concentration differences. Recently, researchers were exploring this problem–with the added twist of tilting the fluids ~1 degree–when they discovered a surprising result. After an extended time, the convection self-organized into alternating parallel columns of ascending (dark) and descending (light) fluid. The researchers nicknamed this behavior super-highway convection. Read more about it here or in their paper. (Video credit: F. Croccolo et al; submitted by A. Vailati)
Peering Inside the Kettle
Here natural convection is explored experimentally in a quasi-2D environment. The researchers demonstrate how this phenomenon, which is much like that seen in a boiling pot, can be investigated by measuring the refractive distortions caused by the thin heated fluid layer. They also demonstrate types of boiling that can occur. Typically, bubbles nucleate at the heated surface and then rise to pull hot fluid with them. At high enough temperatures above the liquid’s boiling point, however, an unstable layer of vapor can form over the heated surface. This “boiling crisis” or critical heat flux produces a marked reduction in heat transfer due to the insulation provided by the vapor layer. (Video credit: S. Wildeman et al.)
Atmospheric Dynamics in the Lab
One way to explore some of the large-scale atmospheric dynamics we observe here on earth is through table-top demonstrations such as this one. Here a platform with a water tank is rotating at a constant velocity. The camera rotates with the tank; this is why the hand in the video seems to spin. At the center of the tank, ice in a can cools the water, while the warmer air along the periphery provides heating. The green dye marks initially cooler fluid while the red dye marks the warmer fluid from the outside of the tank. The dense cooler fluid sinks and moves outward while warmer water moves in to replace it. This creates radial circulation; the thermal gradients and rotation cause the eddies and jets seen from this top view, in much the same way that they form in the mid-latitudes of earth’s atmosphere. (Video credit: Marshall Lab, MIT)

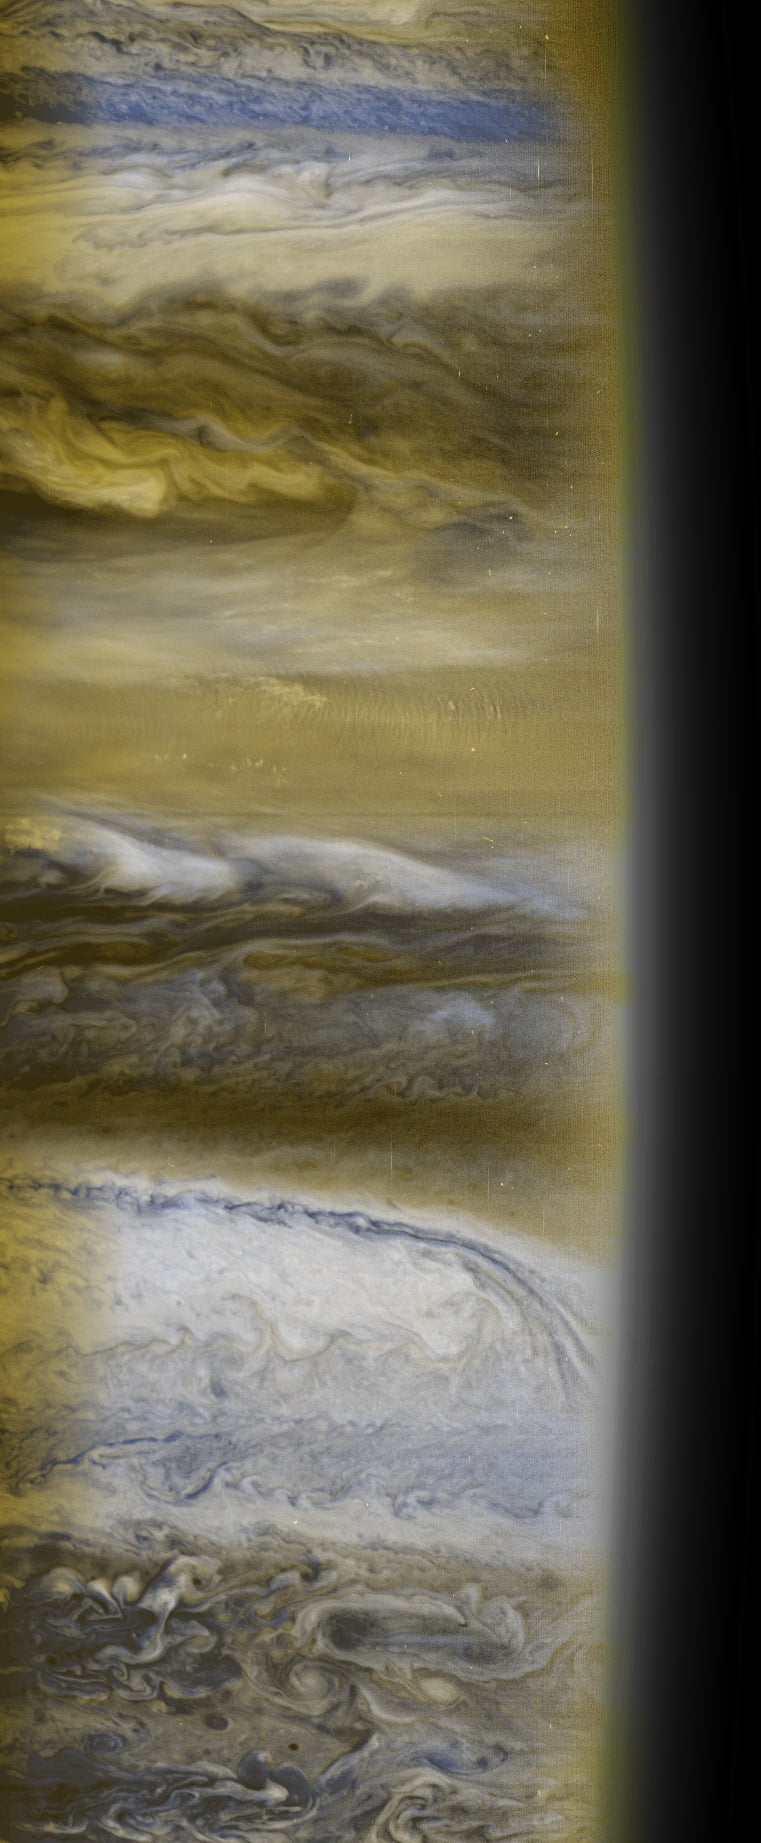
The Cloud Bands of Jupiter
The cloud bands of Jupiter stripe the planet with turbulence. Throughout its upper atmosphere, Jupiter shows signs of gravity waves and complicated wave patterns. Near the equator, the cloud bands are driven by planetary winds that reach speeds of 500 kph, whereas near the poles, the clouds show greater evidence of mottling and convection. At present, the reasons for this patterning are undetermined. (Image Credit: NASA; via APOD)
How the Sun Drives the Earth
This video describes how the sun’s energy drives wind and ocean currents on earth. As solar winds stream forth from the sun, our magnetosphere deflects the brunt of the impact (creating auroras at the poles) while the atmosphere, land masses, and oceans absorb thermal energy from the sun’s light. Because of our cycles of day and night and the differences in how land, water, and ice absorb heat, temperature differentials around the earth drive a massive heat engine, causing the circulation of water and wind all around our world. Numerical simulations like the ones underlying this video are vital for the prediction of climate and weather, as well as for developing models and techniques that can be applied to other problems in science and engineering. (Video credit: NASA; via Gizmodo)