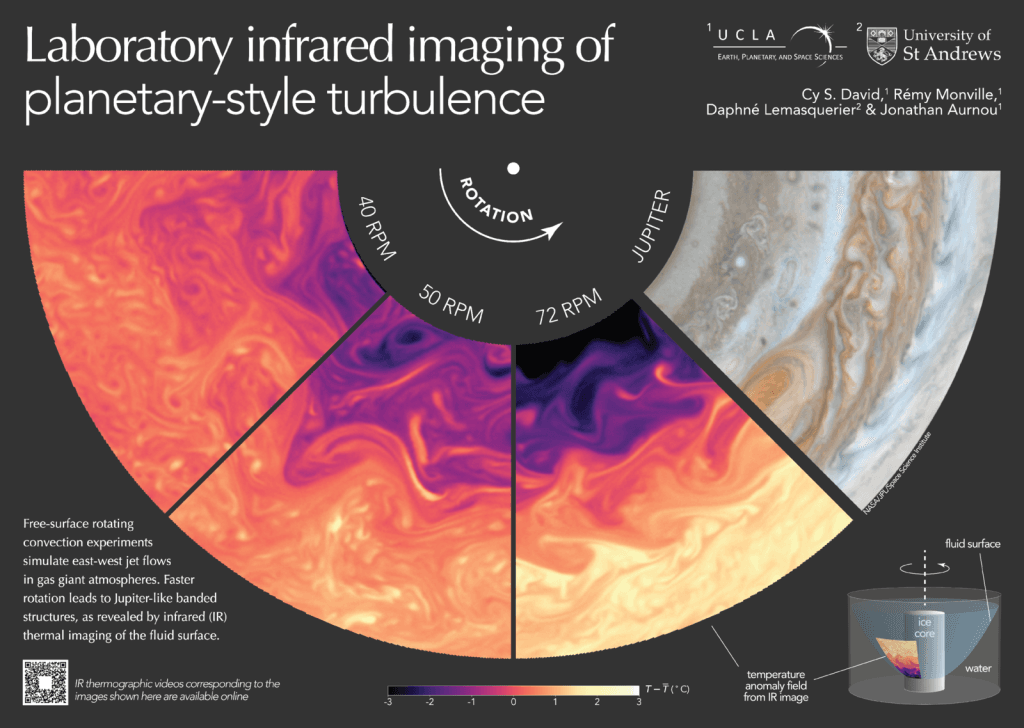
Tag: Jupiter

  • Compressing Jupiter’s Magnetosphere

    Compressing Jupiter’s Magnetosphere

    Shaped by its strong internal magnetic field and the incoming solar wind, Jupiter has the largest magnetosphere in the solar system. It also has highly active aurorae at its poles, though they are most visible in ultraviolet wavelengths. A new analysis of Juno’s data shows that on 6-7 December 2022, Jupiter’s magnetosphere got compressed, coinciding with aurorae six times brighter than usual. The compression itself came from a shock wave in the incoming solar wind. (Image credit: NASA/JPL; research credit: R. Giles et al.; via Eos)

    Fediverse Reactions
  • A New Plasma Wave for Jupiter

    A New Plasma Wave for Jupiter

    Jupiter‘s North Pole has a powerful magnetic field combined with plasma that has unusually low electron densities. This combination, researchers found, gives rise to a new type of plasma wave.

    Ions in a magnetic field typically move parallel to magnetic field lines in Langmuir waves and perpendicularly to the field lines in Alfvén waves — with each wave carrying a distinctive frequency signature. But in Jupiter’s strong magnetosphere, low-density plasma does something quite different: it creates what the team is calling an Alfvén-Langmuir wave — a wave that transitions from Alfvén-like to Langmuir-like, depending on wave number and excitation from local beams of electrons.

    Although this is the first time such plasma behavior has been observed, the team suggests that other strongly-magnetized giant planets — or even stars — could also form these waves near their poles. (Image credit: NASA / JPL-Caltech / SwR I/ MSSS/G. Eason; research credit: R. Lysak et al.; via APS)

    Fediverse Reactions
  • The Great Red Spot’s Cycle

    The Great Red Spot’s Cycle

    First spotted by humanity in 1664, Jupiter‘s Great Red Spot is a seemingly endless storm. Strictly speaking, there is debate as to whether observations prior to 1831 were of the same storm, but there’s no denying that the storm has raged unabated since regular observations began in the first half of the nineteenth century. Despite its longevity, the Great Red Spot is not unchanging. Overall, its major axis is shrinking, making the storm more circular over time. The storm also has a 90-day cycle in which its size, shape, and brightness vary, as seen below. Researchers note that the changes are relatively subtle — at least to the eye — but now that they’ve been identified, it may be possible to use amateur astronomers’ data to track these variations more closely. (Image credits: GRS – K. Gill/NASA, snapshots – A. Simon et al.; research credit: A. Simon et al.; via Gizmodo)

    Over a 90 day cycle, Jupiter's Great Red Spot oscillates in size, shape, and other characteristics.
    Over a 90 day cycle, Jupiter’s Great Red Spot oscillates in size, shape, and other characteristics.
  • Red Sprites

    Red Sprites

    Sprites, or red sprites, are high-altitude electrical discharges in the atmosphere. Although sometimes called upper-atmospheric lightning, sprites are a cold plasma phenomenon. They often occur in clusters, as in this photo by Angel An, which won in the Skyscapes category of the 2023 Astronomy Photographer of the Year competition. Sprites, which last only a millisecond or so, take place during intense thunderstorms, but, unlike our more familiar lightning, sprites move upward from the storm toward the ionosphere. They can occur on Venus, Saturn, and Jupiter as well, although sprites have only been observed directly on Earth and Jupiter. (Image credit: A. An; via Colossal)

  • Jovian Swirls

    Jovian Swirls

    Jupiter, our solar system’s stormiest planet, shares many similarities with Earth. But where Earth’s strongest storms are cyclones centered on low-pressure regions, Jupiter’s longest and strongest storms are anti-cyclones, driven by areas of high pressure. They’re often massive — larger than the entire Earth — and persist for weeks, months, or years. This processed image comes from the JunoCam instrument and shows some of the incredible cloud structure in Jupiter’s atmosphere. Jupiter’s highest altitude clouds tend to be the lightest, while darker clouds remain lower. (Image credit: NASA/JPL-Caltech/SwRI/MSSS/K. Gill; via APOD)

  • Stabilizing Jupiter’s Polar Storms

    Stabilizing Jupiter’s Polar Storms

    Four years ago, Juno discovered an octagon of eight cyclones at Jupiter’s northern pole and a similar five cyclone structure at its southern pole. Since then, both polygons have remained intact. What keeps the storm systems so stable is still an open question, but a recent observational study using Juno measurements found that an anticyclonic ring sits between the central and outer cyclones. In line with a previous theoretical study, this ring structure helps shield and stabilize the storm system.

    The underlying convective mechanisms of the storm remain a mystery, though, as the current study is limited in resolution to a scale of about 200 kilometers. (Image credit: NASA/JPL-Caltech/SwRI/ASI/INAF/JIRAM; research credit: A. Ingersoll et al.; via Gizmodo)

  • Jupiter’s Frosted Clouds

    Jupiter’s Frosted Clouds

    This 3D rendering of Jupiter's cloud tops is based on flyby data from the JunoCam instrument. It's not a true physical image of the cloud tops, though scientists are working on a calibration for that. Instead, the elevations shown here are based on the intensity of visible light registered by the instrument. This measure correlates with cloud height, but there are exceptions.
    This 3D rendering of Jupiter’s cloud tops is based on flyby data from the JunoCam instrument. It’s not a true physical image of the cloud tops, though scientists are working on a calibration for that. Instead, the elevations shown here are based on the intensity of visible light registered by the instrument. This measure correlates with cloud height, but there are exceptions.

    New 3D renderings of Jovian clouds show textured swirls akin to a cupcake’s sculpted frosting. The images are based on flyby data from the JunoCam instrument. Because illumination of the clouds is generally brightest for the highest clouds, the team has rendered elevation based on brightest. While this is somewhat physical, it’s not exactly what Jupiter looks like. For that, Juno scientists are working on a calibration that will translate these initial renderings into a truer physical model. Nevertheless, the results are stunning, especially the flyover video embedded over here! (Image credit: 3D renders – NASA / JPL-Caltech / SwRI / MSSS / G. Eichstädt, image pair – G. Eichstädt et al.; via phys.org; submitted by Kam-Yung Soh)

    Cross your eyes to see this image pair as a 3D image of Jupiter's cloud tops.
    Cross your eyes to see this image pair as a 3D image of Jupiter’s cloud tops. The brighter regions will appear closer than the darker ones.
  • Jupiter in Infrared

    Jupiter in Infrared

    These recent composite images from the James Webb Space Telescope show Jupiter in stunning infrared detail. They’re the result of several images taken in different infrared bands, then combined and rendered in visible light. In general, the redder colors show longer wavelengths and the bluer ones show shorter wavelengths.

    Jupiter’s cloud bands appear in beautiful detail. The Great Red Spot looks white in infrared. And the planet’s polar auroras shine bright in both images. The wide-angle shot additionally shows two of Jupiter’s moons and the planet’s rings, which are a million times fainter than the planet itself. If you look carefully, you may also see faint points of light in the lower half of the image. These are likely distant galaxies “photobombing” Jupiter’s close-up. (Image credit: NASA/ESA/Jupiter ERS Team 1, 2; via Colossal)

    This composite image of Jupiter was taken in infrared bands and rendered into visible light. In general, the redder colors represent longer wavelengths and bluer ones shorter wavelengths.
    This composite image of Jupiter was taken in infrared bands and rendered into visible light. In general, the redder colors represent longer wavelengths and bluer ones shorter wavelengths.
  • Jovian Circulation

    Jovian Circulation

    Jupiter‘s atmosphere remains quite mysterious, due to our limited ability to measure the depths of the gas giant’s clouds. But measurements from the Juno spacecraft are continuing to shape researchers’ understanding of our massive neighbor. By tracking ammonia distributions in Jupiter’s belts and zones, a team has found a series of circulation cells similar to the Ferrel cells of Earth’s midlatitudes.

    Unlike the stronger Hadley cells and polar cells, Earth’s Ferrel cells are relatively weak. They’re driven by turbulence and the motion of the circulation cells to the north and south. The Northern and Southern hemispheres each have one Ferrel cell. In contrast, Jupiter — with its larger size and higher rotation rate — boasts eight Ferrel-like cells in each hemisphere! (Image and research credit: K. Duer et al.; via Universe Today; submitted by Kam-Yung Soh)

  • Jupiter in Many Lights

    Jupiter in Many Lights

    Sometimes the key to unraveling a mystery is to observe the phenomenon in different ways. That’s why researchers are increasingly taking advantage of multiple instruments simultaneously observing targets like Jupiter. Here we see the gas giant in three different types of light: infrared, visible, and ultraviolet. Infrared bands reveal the hot and cold regions of Jupiter’s clouds, allowing scientists to identify convective areas. Ultraviolet observations can reveal high-energy processes, like Jupiter’s auroras. And the colors revealed in visible light can give hints about chemical make-up in different regions. But to get a fuller picture, scientists compare all three modes — along with radio signal data from Juno — to understand topics like the planet’s lightning-filled storms. (Image credits: International Gemini Observatory/NOIRLab/NSF/AURA/NASA/ESA, M.H. Wong and I. de Pater (UC Berkeley) et al.; via Gizmodo)