There are few flows more violent than planetary re-entry. Crossing a shock wave is always violent; it forces a sudden jump in density, temperature, and pressure. But at re-entry speeds this shock wave is so strong the density can jump by a factor of 13 or more, and the temperature increase is high enough that it literally rips air molecules apart into plasma.
Here, researchers show a numerical simulation of flow around a space capsule moving at Mach 28. The transition through the capsule’s bow shock is so violent that within a few milliseconds, all of the flow behind the shock wave is turbulent. Because turbulence is so good at mixing, this carries hot plasma closer to the capsule’s surface, causing the high temperatures visible in reds and yellows in the image. Also shown — in shades of gray — is the vorticity magnitude of flow around the capsule. (Image credit: A. Álvarez and A. Lozano-Duran)
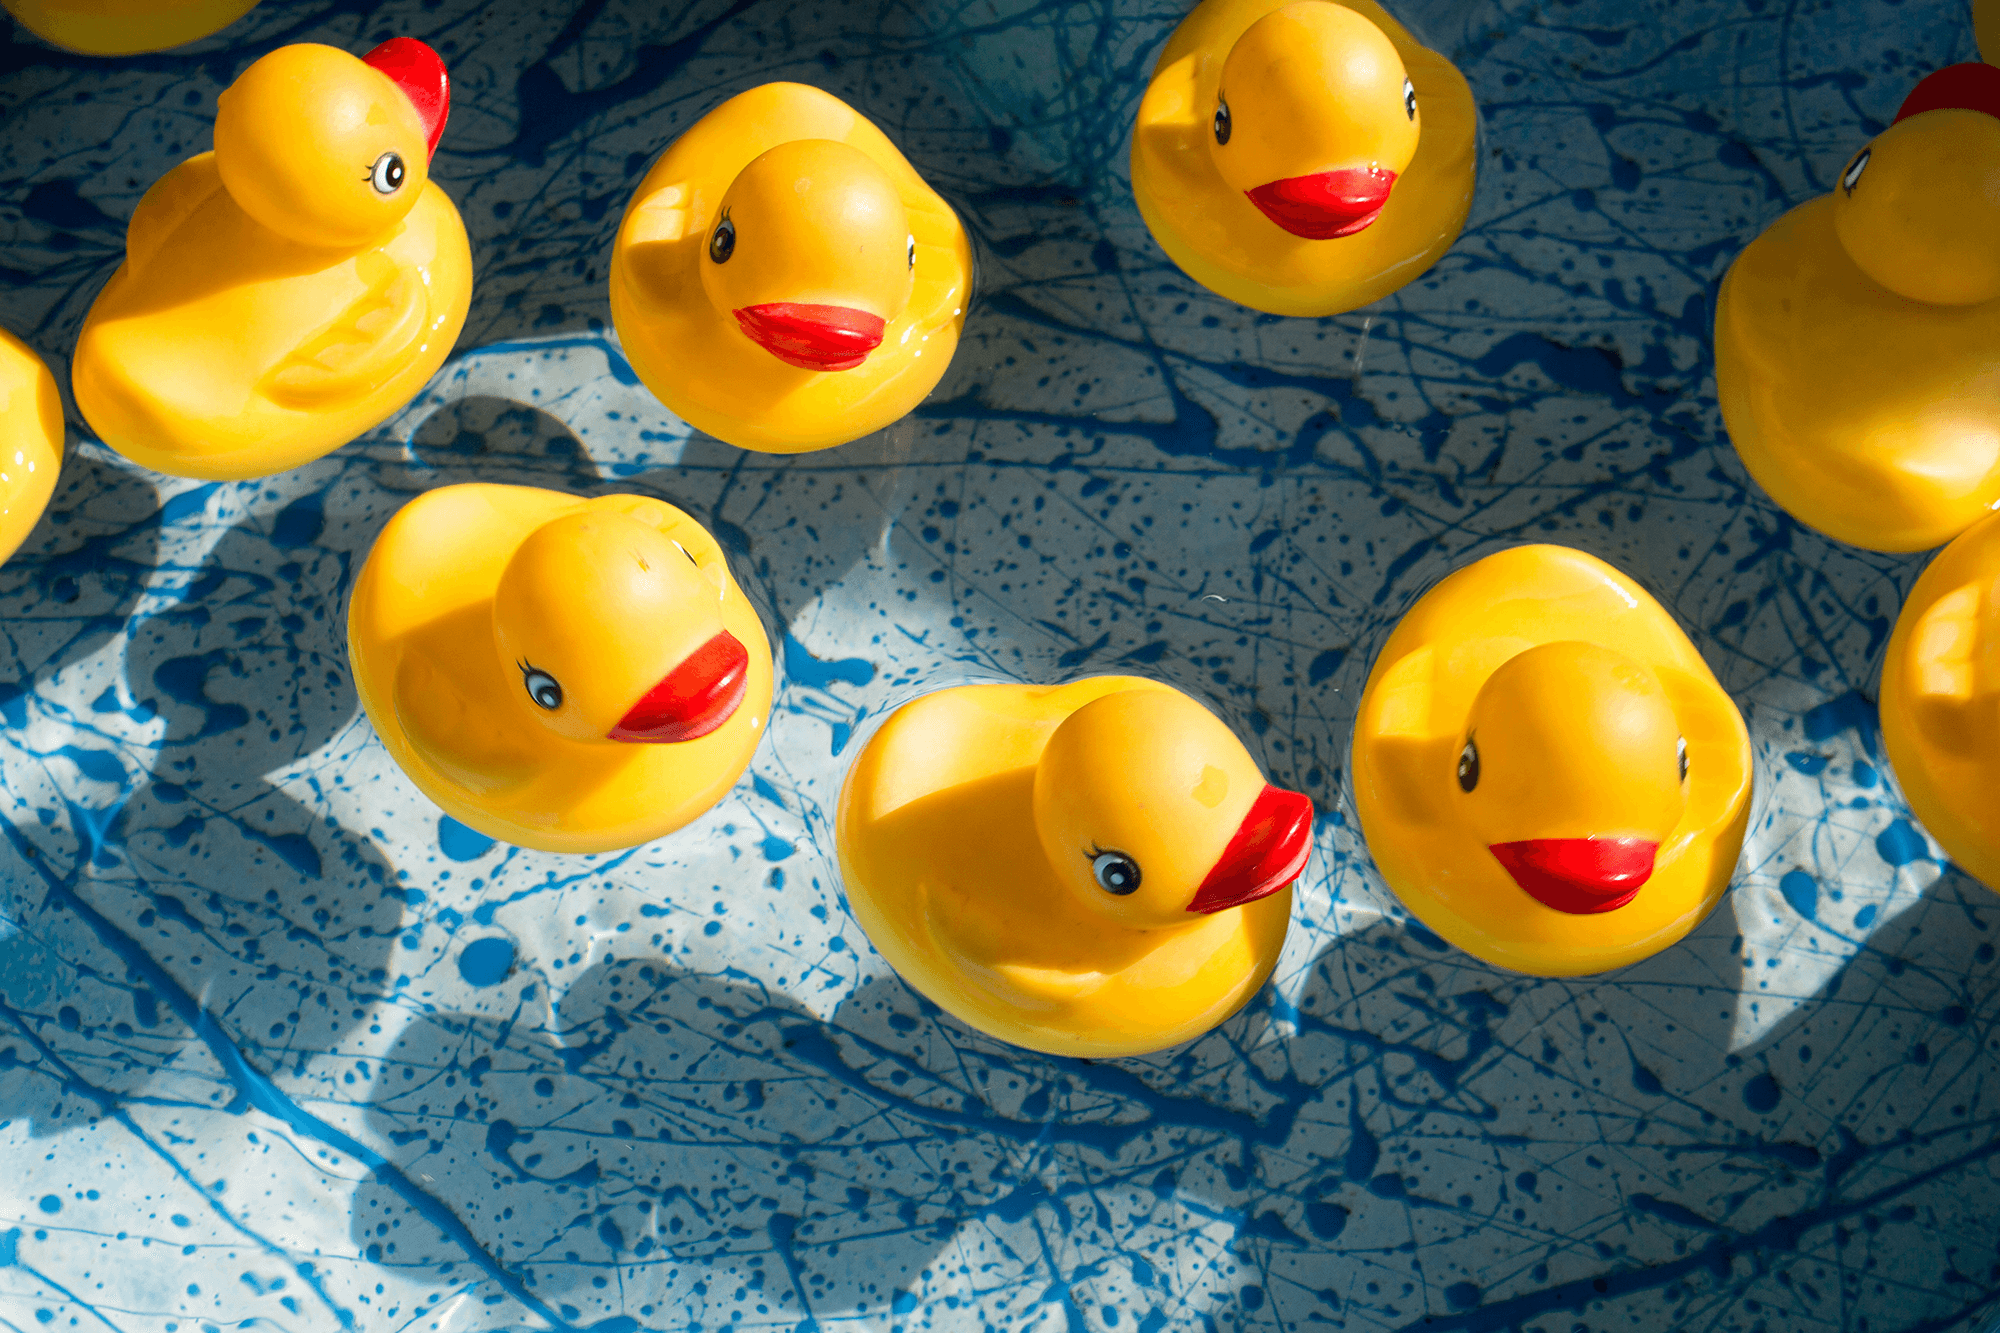
Turbulence is very good at spreading things out. Drop dye into a turbulent flow and it will quickly disperse. Add in particles — like rubber ducks — and they can spread apart, often at speeds quicker than one would expect, based on the background flow. This is (roughly speaking) a phenomenon known as “superdiffusion,” where turbulence makes particles that start out as neighbors part ways.
Physicists conjectured that turbulence — including simplified and idealized versions of it that are simpler to deal with — had this superdiffusion property, but no one was able to show that in a mathematically rigorous way. But now a group of mathematicians has done so, using a technique known as homogenization. There’s a lot more on the story over at Quanta, or you can check out the original papers on arXiv. (Image credit: J. Richard; research credit: S. Armstrong et al. and S. Armstrong and T. Kuusi; see also Quanta)
This video offers an artistic look at a soap bubble bursting. The process is captured with high-speed video combined with schlieren photography, a technique that makes visible subtle density variations in the air. The bubbles all pop spontaneously, once enough of their cap drains or evaporates away for a hole to form. That hole retracts quickly; the acceleration of the liquid around the bubble’s spherical shape makes the retracting film break into droplets, seen as falling streaks near the bottom of the bubble. The retraction also affects air inside the bubble, making the air that touched the film curl up on itself, creating turbulence. Then, as the film completes its retraction, it pushes a plume of the once-interior air upward, as if the interior of the bubble is turning itself inside out. (Video and image credit: D. van Gils)
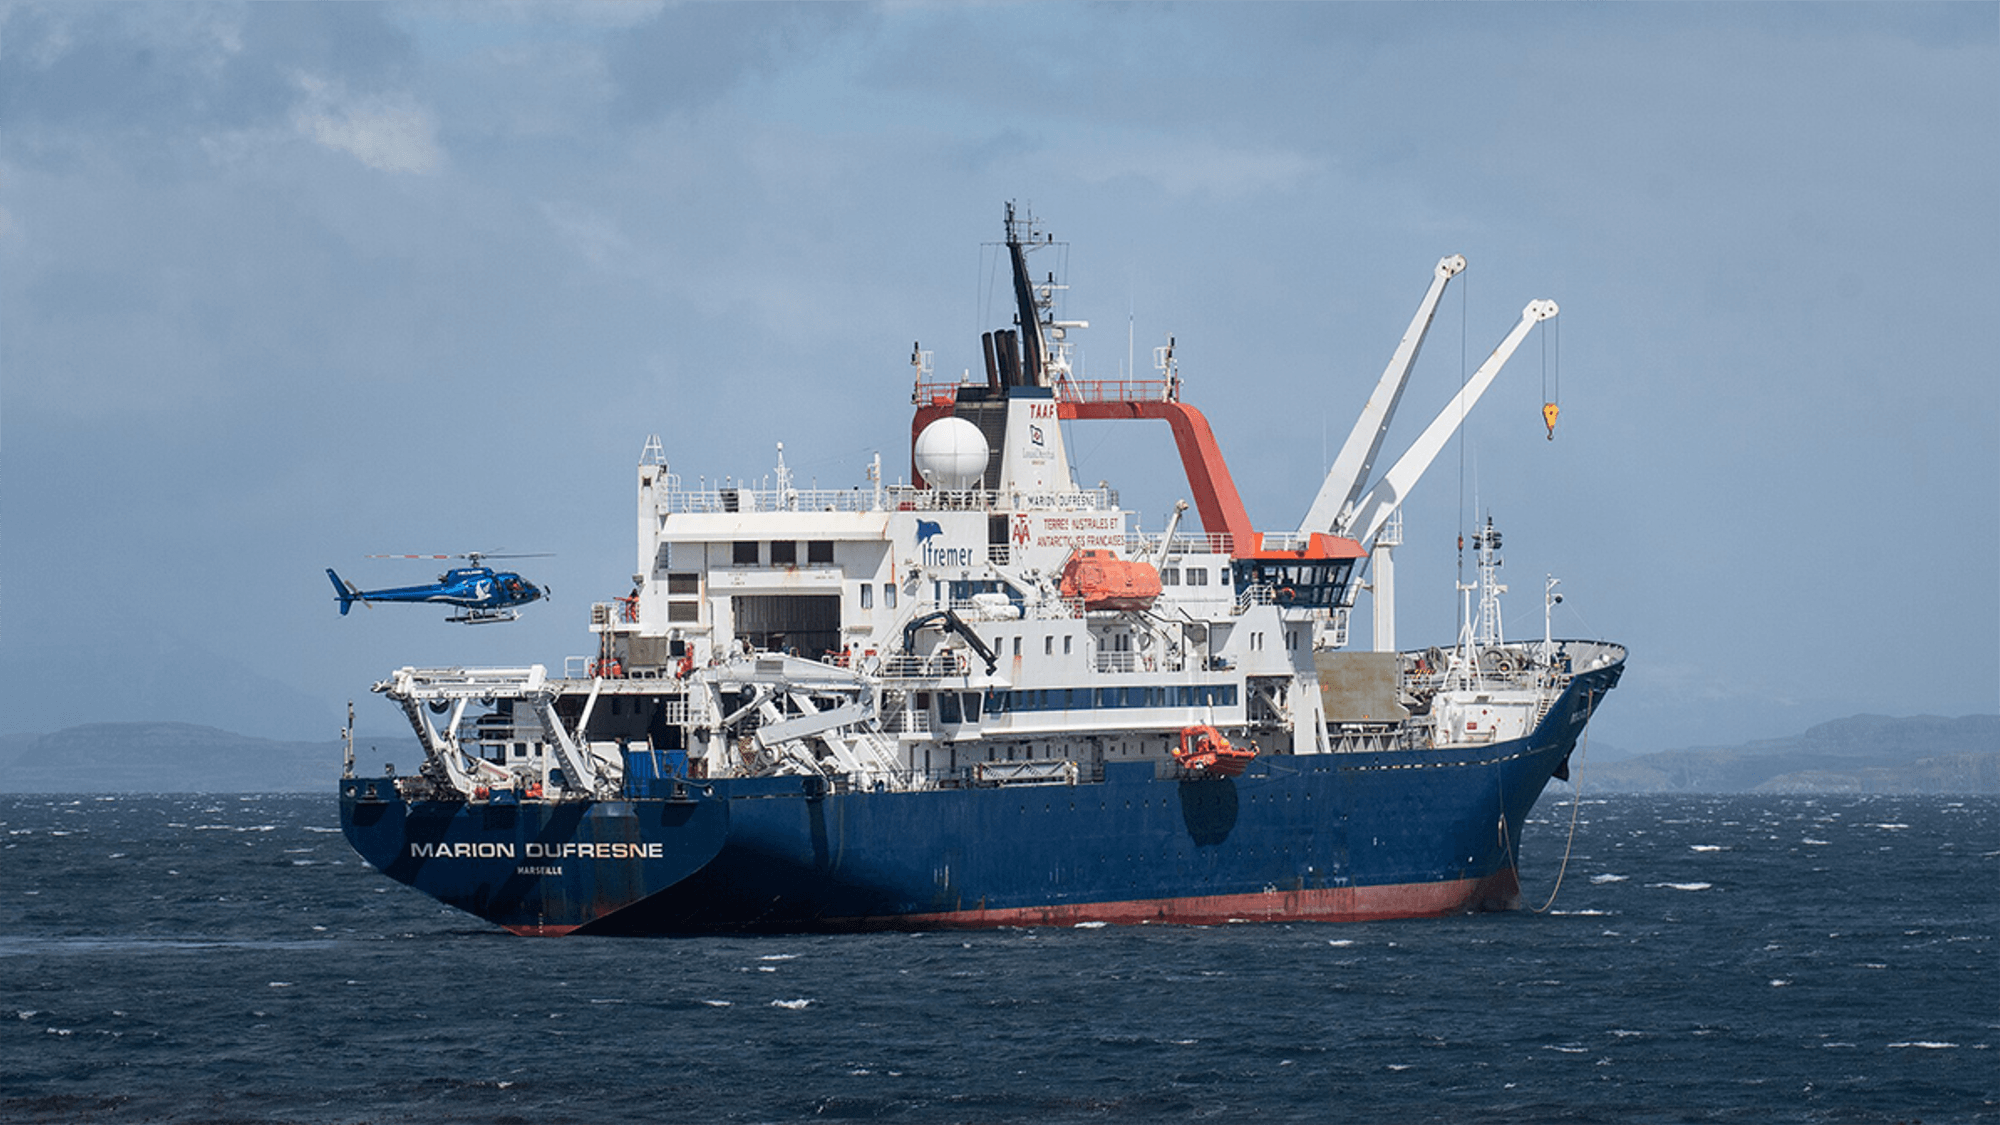
The Mozambique Channel boasts some of the world’s most turbulent waters, driven by eddies hundreds of kilometers wide. Eddies of this size — known as mesoscale — determine regional flows that influence local biodiversity, sediment mixing, and how plastic pollution moves. To better understand the region, scientists measured a mesoscale dipole from a research vessel.
Illustration of flows in the Mozambique Channel. The anticyclonic ring in dark blue rotates counterclockwise and consists of largely uniform water (labeled Ring: R1). To the south, in green, a cyclonic eddy rotates in a clockwise sense (labeled Cyclone: C1). This area is chlorophyll-rich and has varying salinity levels. Between the two is a filament of chlorophyll-rich water being drawn from the near-shore region (labeled Filament: F1).
The dipole consisted of a large anticyclonic ring (shown in dark blue) that rotated counterclockwise and a smaller cyclonic eddy (shown in green) that rotated clockwise. Between these eddies lay a central jet moving up to 130 centimeters per second that drew material out from the shoreline. In the anticyclonic ring, researchers found largely uniform waters with little chlorophyll. The cyclonic eddy, in contrast, was high in chlorophyll and had large variations in salinity. Those smaller-scale variations, they found, helped to drive vertical motions of up to 40 meters per day.
In situ measurements like these help scientists understand how energy flows through different scales in the ocean and how that energy helps transport nutrients, sediment, and pollution regionally. Such measurements also help us to refine ocean models that enable us to predict this transport and how regions will change as climate patterns shift. (Image credit: ship – A. Lamielle/Wikimedia Commons, eddies – P. Penven et al.; research credit: P. Penven et al.; via Eos)
Filmmaker Roman De Giuli returns to his roots with this short fluid-filled film inspired by the color gold. He combines paint, ink, powders, and particles in a mix of micro- and macroscale photography. As always, the results are a mesmerizing plethora of fluid phenomena: Marangoni flows, turbulence, vorticity, viscous fingering and so much more. (Video and image credit: R. De Giuli)
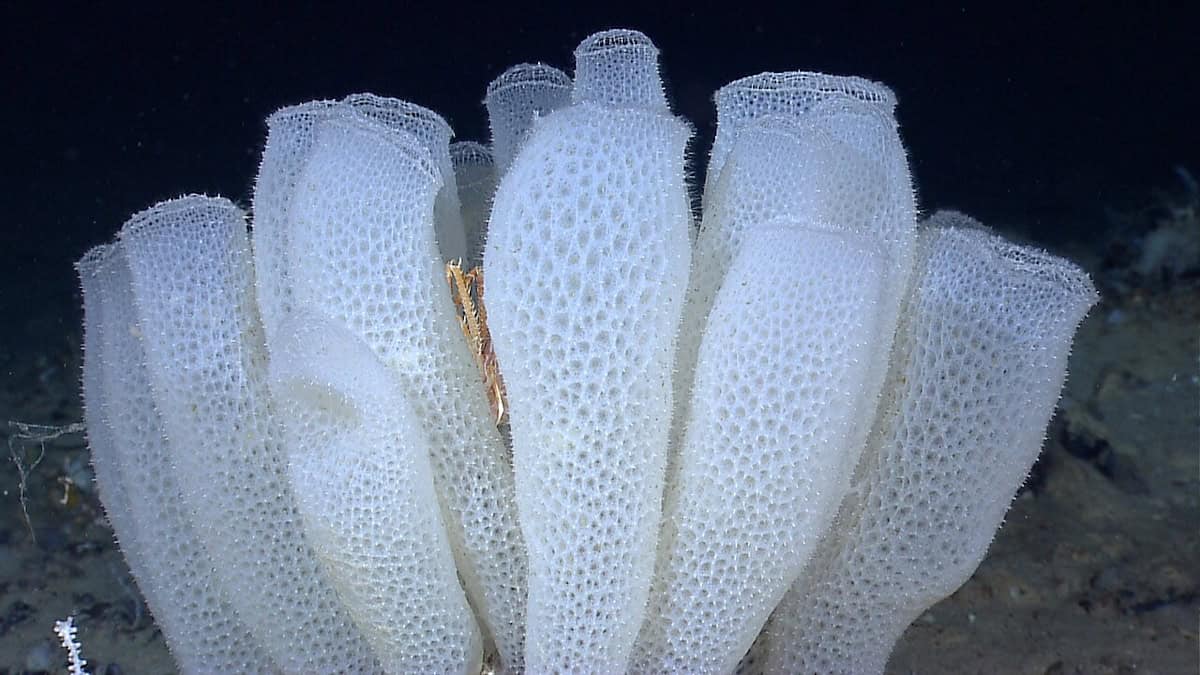
Gathering oil after a spill is fiendishly difficult. Deploying booms to corral and soak up oil at the water surface only catches a fraction of the spill. A recent study instead turns to nature to inspire its oil filter. The team was inspired by the Venus’ flower basket, a type of deep-sea sponge with a multi-scale structure that excels at pulling nutrients out of complex flow fields. The outer surface of the sponge has helical ridges that break up the turbulence of any incoming flow, helping the sponge stay anchored by reducing the force needed to resist the flow. Beneath the ridges, the sponge’s skeleton has a smaller, checkered pattern that further breaks up the flow as it enters into the sponge’s hollow body. Within this cavity, the flow is slower and swirling, giving plenty of time for nutrients in the water to collide with the nutrient-gathering flagellum lining the sponge.
By mimicking this three-level structure, the team built a capable oil-capturing device that can filter even emulsified oil from the water. They swapped the flagellum with a (replaceable) oil-adsorbing material and found that their filter captured more than 97% of oil across a range of flow conditions. (Image credit: NOAA; research credit: Y. Yu et al.; via Physics World)
Our oceans absorb large amounts of atmospheric carbon dioxide. Liquid water is quite good at dissolving carbon dioxide gas, which is why we have seltzer, beer, sodas, and other carbonated drinks. The larger the surface area between the atmosphere and the ocean, the more quickly carbon dioxide gets dissolved. So breaking waves — which trap lots of bubbles — are a major factor in this carbon exchange.
This video shows off numerical simulations exploring how breaking waves and bubbly turbulence affect carbon getting into the ocean. The visualizations are gorgeous, and you can follow the problem from the large-scale (breaking waves) all the way down to the smallest scales (bubbles coalescing). (Video and image credit: S. Pirozzoli et al.)
Fires glow above and below in this award-winning image from photographer Josh Beames. In the foreground, lava from an Icelandic eruption spurts into the air and seeps across the landscape as it slowly cools. Above, the northern aurora ripples through the night sky, marking the dance of high-energy particles streaming into our atmosphere, guided by the lines of our magnetic field. Throw in some billowing turbulent smoke, and it’s hard to get more fluid dynamical (or beautiful!) than this. (Image credit: J. Beames/NLPOTY; via Colossal)
Pour the Greek liquor ouzo into water, and your glass will billow with a milky, white cloud, formed from tiny oil droplets. The drink’s unusual dynamics come from the interactions of three ingredients: water, oil, and ethanol. Ethanol is able to dissolve in both water and oil, but water and oil themselves do not mix.
In this video, researchers explore the turbulent effects of pouring ouzo into water. In particular, pouring from the top creates a fountain-like effect, due to a tug-of-war between the ouzo’s momentum and its buoyancy. Momentum wants the ouzo to push down into the water, and buoyancy tries to lift it back up. For an extra neat effect, they also show what happens when the ouzo is confined to a 2D plane and what happens when momentum and buoyancy act together instead of oppositely. (Image and video credit: Y. Lee et al.)
In this ASMR video, black ink diffuses in water. When the video starts, the ink is so diffuse that it’s not apparent the video is playing backward. It’s only as specific structures — things like Rayleigh-Taylor instabilities, plumes, and jets — coalesce from the background that we recognize the time reversal. Though it’s probably unintentional, this makes for a neat, subtle commentary on the nature of isotropic turbulence. (Video and image credit: Wryfield Lab)