
Joints like our knuckles are lubricated with liquid called the synovial fluid. When manipulated, these joints can pop or crack audibly. For half a century, researchers have thought the cracking sound joints under tension make was the result of bubbles in the synovial fluid collapsing. But a new cine magnetic resonance imaging (MRI) study shows that the sound is generated during bubble inception and that the cavity persists after the sound. When the bones of the joint are pulled, viscous forces resist their separation. With enough force, the joints separate suddenly, causing a pressure drop in the synovial fluid that forms a vapor-filled cavity in the joint. According to the real-time MRI observations, this is when the sound is generated. The cavity does eventually dissipate, they found, but only well after the pop. The whole joint-cracking process is consistent with the tribonucleation mechanism seen in machinery. (Image credit: G. Kawchuk et al.; GIF via skunkbear, source video)
Search results for: “art”

Growing Icicles
For those from colder climates, icicles are a familiar part of winter. They come in a multitude of shapes and sizes, many of which have been captured and cataloged in the Icicle Atlas project. The site contains images, videos, and measurements of more than 230 icicles grown in the lab over the course of four years of research into how and why icicles form the way they do. One interesting result of the work was the discovery that the ripples commonly found on icicles are directly related to impurities. Icicles grown with pure water remain smooth, and only those with ionic impurities, like salt, develop ripples. Check out more images and icicle research at the Atlas. (Video credit: A. Chen and S. Morris/The Icicle Atlas; via Discover)

Blast Waves Visualized
Typically, shock waves are invisible to the human eye. Using sensitive optical techniques like schlieren photography, researchers in a lab can visualize sharp density gradients like shock waves or even the slight density variations caused by natural convection. But it takes some special conditions to make shock waves visible to the naked eye. The blast wave of the explosion in the photo above is a great example. The leading edge of the shock wave and the heat of the explosion create a strong, sharp change in density. That density change is accompanied by a change in the air’s refractive index. As light travels from the distance toward the camera, it’s distorted–more specifically, refracted–when it travels through the blast wave and its wake. And, in this case, that visual distortion is strong enough that we can clearly see the outlines of the shock waves moving out from the explosion. The apparent horizontal line through the blast wave is probably the intersection of a weaker secondary shock wave with the initial expanding shock wave. (Image credit: Defense Research and Development Canada; via io9)
Lab-borne Tornadoes
Conventional wind tunnels are great, but some aerodynamic testing requires facilities of a different nature. The video above is from the WindEEE dome, a hexagonal chamber with sixty fans on one wall, eight directional fans on the other five walls, and six fans in the upper chamber. Each is individually computer controlled, allowing the researchers to create straight flows as well as complex vortical ones. The video shows their tornado flow, which stands 5 m tall and swirls at 30 m/s. They can also move the tornado around the chamber at 2 m/s. This capability enables a kind of scale-model analysis of tornadoes and their impact that’s not possible in most facilities. You can read more about the dome at New Scientist or the WindEEE website. (Video credit: New Scientist/WindEEE; submitted by entropy-perturbation)

Dancing Droplets


What makes drops of food coloring able to dance, chase, sort themselves, or align with one another? This unexpected behavior is a consequence of food coloring consisting of two mixed liquids: water and propylene glycol. Both have their own surface tension properties and evaporation rates, which ultimately drives the behavior you see in the animations above. Both long-range and short-range interactions are observed. The former are due to vapor from each droplet adsorbing onto the glass around the droplet, thereby changing the local surface tension and causing nearby drops to feel an attractive force. The short-range effects are also surface-tension-driven. Droplets with lower surface tension will naturally try to flow toward areas of higher surface tension, which causes them to “chase” dissimilar adjacent drops. You can learn more about the research in the videos linked below (especially the last two), or you can read about the work in this article or the original research paper. (Image credit: N. Cira et al., source videos 1, 2, 3, 4; GIFs via freshphotons; submitted by entropy-perturbation)
“Jack and the Giant”
This fantastic music video by Kim Pimmel is a beautiful merger of art and fluid dynamics. Using household goods (and some slightly more exotic ferrofluid), the video shows how mesmerizing diffusion, buoyancy, Marangoni flow, and other fluid effects can be up close. It may also be the first time I’ve ever seen fluid dynamics–specifically bubbles–used as characters! Also be sure to check out some of his previous videos, many of which also feature cool fluid dynamics. (Video credit and submission: K. Pimmel)
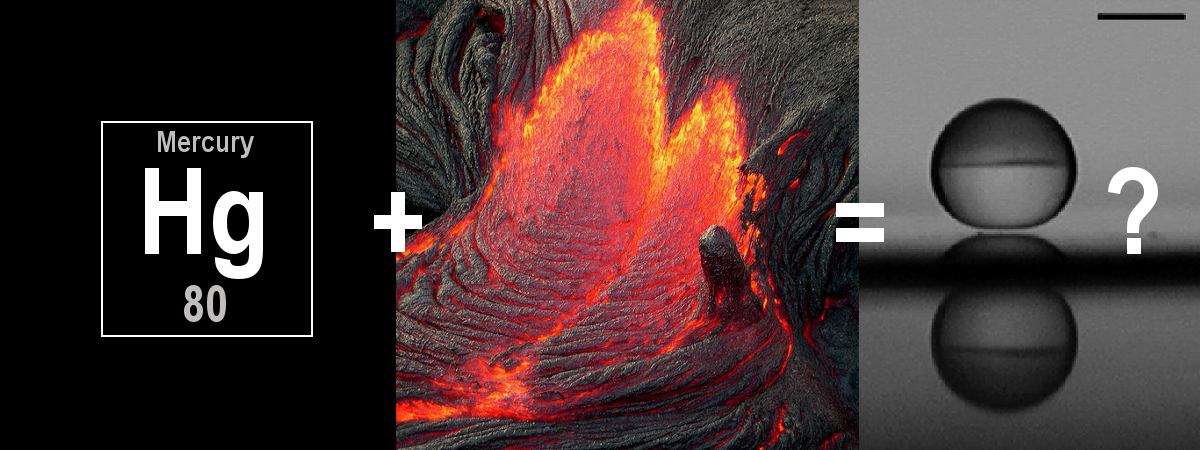
Reader Question: When Mercury Meets Lava
Reader lucondri asks:
What happens when mercury touches lava?
That’s an interesting thought experiment, but hopefully no one tries it any time soon given mercury’s toxicity. So, what might happen? Mercury has a boiling point just under 630 Kelvin, and, although the temperature of molten lava varies, it’s between 970 and 1470 Kelvin when it first erupts. So mercury would definitely vaporize (i.e. boil) on contact with lava. (Again, this is very bad for anyone nearby.) If you’re curious what boiling liquid mercury looks like, wonder no further.
Molten lava is much, much hotter than the boiling point of mercury, though, so there’s a possibility that the mercury won’t boil away instantly. This is because of the Leidenfrost effect, where a thin layer of vapor forms between a liquid and an extremely hot surface. The vapor has such low friction that the liquid can essentially skate across a surface, and it doesn’t boil away instantly because the vapor insulates it from the extreme heat. After some digging, I found a paper that placed the Leidenfrost temperature of mercury between about 850 and 950 Kelvin, meaning that fresh lava is probably hot enough to generate mercury Leidenfrost drops.
So pouring a lot of mercury on lava will probably result in some boiling, but there’s also a good chance that it will form a bunch of skittering mercury droplets that will stick around awhile before they evaporate into toxic mercury gas. That said, it’s a lot easier and safer to watch awesome Leidenfrost drop videos with other liquids. (Collage credit: N.Sharp; images sources: Z. T. Jackson, and A.Biance)
Magnetic Putty
Sometimes fluids are slow-moving enough that it takes timelapse techniques to reveal the flow. Fog is one example, and, as seen above, magnetic silly putty is another. The putty is an unusual fluid in a couple of ways. First, having been impregnated with ferromagnetic nanoparticles, it is sensitive to magnetic fields, making it a sort of ferrofluid. And secondly, being silly putty, it’s a non-Newtonian fluid, meaning that it has a nonlinear response to deformation – a fact that will be familiar to anyone who has tried to knead putty versus striking it. With a strong enough magnet, the putty makes for an impressively tenacious creeping flow. (Video credit: I. Parks; via io9; submitted by Chad W.)
When Lava Meets Ice
What happens when lava meets ice or water? Artists and geologists are working together to explore these interactions by melting crushed basalt and pouring it onto different substrates. Ice is their classic example; instead of melting instantly through the ice, the lava is so hot that it creates a layer of steam between it and the ice. This steam helps the lava flow due to lower friction while also insulating the ice from the lava. It’s an example of the Leidenfrost effect. The end result is a very bubbly lava flow thanks to the steam trying to escape through the viscous lava. (Video credit: Science Channel; submitted by @jchawner)
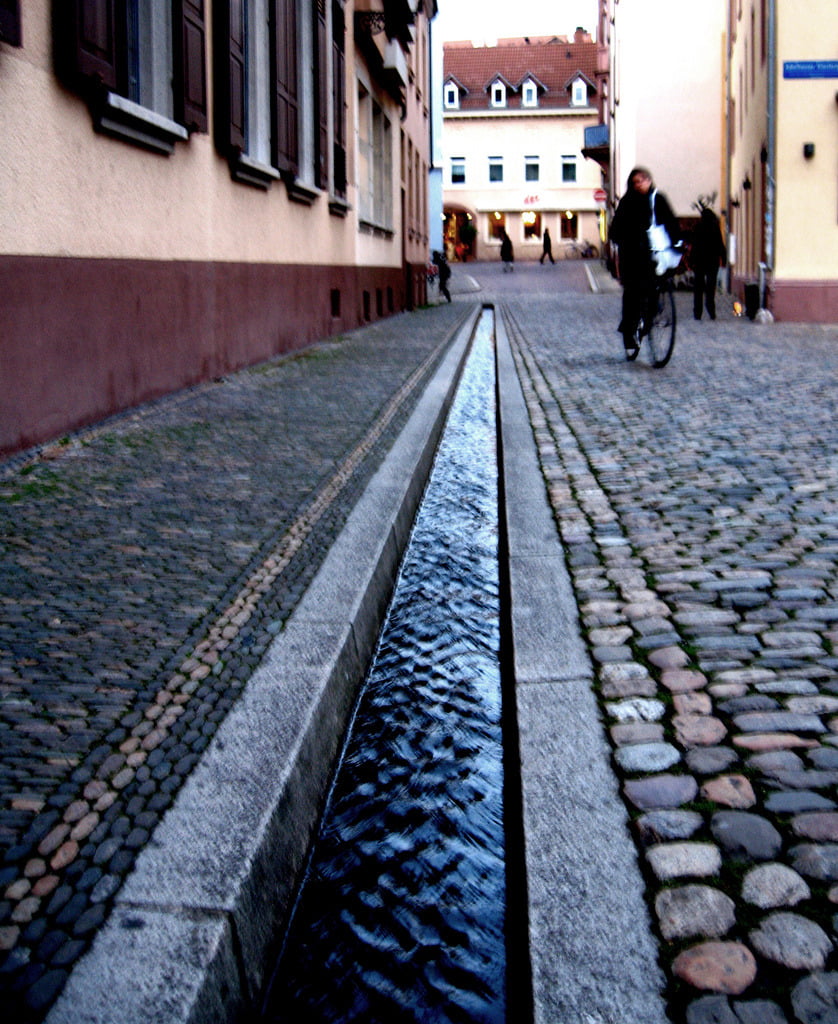
Reader Question: Rippling Runoff

Reader junolivi asks:
When shallow water (like runoff from melting snow) flows across pavement, it creates small repeated wave-like ripples. What creates that texture and why isn’t it just a steady flow?
This is a great question that’s probably crossed the mind of anyone who’s seen water running down the gutter of a street after a storm. The short answer is that this gravity-driven flow is becoming unstable.
Fluid dynamicists often like to characterize flows into two main types: laminar and turbulent. Most flows in nature are turbulent, like the wild swirls you see behind cars driving in the rain. But there are laminar flows in nature as well. Often flows that begin as laminar will become turbulent. This happens because those laminar flows are unstable to disturbances.
The classic example of stability is a ball on a hill. If the ball is at the top of the hill and you disturb it, it will roll down the hill because its original position was unstable. If, on the other hand, the ball is in a depression, then you can prod the ball and it will eventually settle back down into its original place because that position was stable. Another way of looking at it is that, in the unstable case, the disturbance–how far the ball is from its original position–grows uncontrollably. In the stable case, on the other hand, the disturbance can be initially large but eventually decays away to nothing.
There are many ways to disturb a laminar flow–surface roughness, vibrations, curvature, noise, etc., etc. These disturbances enter the flow and they can either grow (and become unstable) or decay (because the flow is stable to the disturbance). Just as one can look at the stability of a pendulum, one can mathematically examine the stability of a fluid flow. When one does this for water flowing down an incline, one finds that the flow is quite unstable, even in the ideal case of a pure, inviscid fluid flowing down a smooth wall.
The reason that one sees distinctive waves with a particular wavelength (assuming that they aren’t caused by local obstructions) is directly related to this idea of instability. Essentially, the waves are the disturbance, having grown large enough to see. One could imagine that any wavelength disturbance is possible in a flow, but mathematically, what one finds, is that different wavelengths have different growth rates associated with them. The wavelength we observe is the most unstable wavelength in the flow. This is the wavelength that grows so much quicker than the others that it just overwhelms them and trips the flow to turbulence. This is very common. For example, you can see distinctive waves showing up before the flow goes turbulent in both this mixing layer simulation and this boundary layer flow.
(Image credits: anataman, mo_cosmo; also special thanks to Garth G. who originally asked a similar question via email)