Videos

  • Featured Video Play Icon

    The Clever Cat’s Tongue

    Cats spend almost a quarter of their waking hours grooming, and their tongues are wonderfully specialized for this task, allowing them to clean, cool, and untangle themselves with ease. Anyone who’s ever been licked by a cat knows their tongues feel sandpaper-y. This is due to rear-facing hook-like structures called papillae that have a stiffness comparable to human fingernails.

    The papillae are hollow, and their U-shaped tip helps them wick up saliva, which the cat deposits deep into its undercoat when it licks. Although the papillae only hold about 5% of the volume of saliva on the cat’s tongue, this wicking action is key because most of the tongue surface can’t reach the inner coat; only the papillae do. The saliva that reaches these dense inner hairs is important not only for cleaning the fur, but for helping the cat cool off. As the saliva evaporates, it carries heat away with it, just like sweating does for us.

    The papillae are key to untangling fur, but their shape also makes it easy to remove hairs caught on the tongue. Researchers built a 3D-printed cat-inspired hair brush to show how efficient and easy to clean a cat’s tongue can be! (Video credit: Science; research credit: A. Noel and D. Hu)

  • Featured Video Play Icon

    “If I Say”

    The new Mumford & Sons single “If I Say” features a fluid-dynamical music video. It’s full of dendritic fingers and flowing colors – likely from combinations of inks, paints, and other fluids. Although the fingers are reminiscent of the viscosity-dependent Saffman-Taylor instability, these appear to be driven by variations in surface tension between the different fluids. That’s a major feature throughout the video; although some of the flow is caused by the syringes depositing fluids, much of it seems to be a Marangoni effect, where flow moves away from areas of low surface tension to ones with higher surface tension. (Video credit: Mumford & Sons; filmed by P. Hofstede; via Katie M.)

  • Featured Video Play Icon

    Rivers in the Sky

    The water cycle is quite a bit more complicated than what we learn in elementary school, and the environment around us contributes to that cycle in invisible but vital ways. In this video, Joe Hanson of It’s Okay to Be Smart pulls back the veil on this in the context of the Amazon river basin and how the Amazon rainforest itself creates an atmospheric river that carries more water than its namesake river.

    Trees release water into the air almost constantly as they transpire. And to trigger that water to fall as rain, trees can release other compounds that serve as a nucleus around which raindrops can form. The condensing raindrops form clouds, which lower the air pressure and create winds, thereby creating an atmospheric river flowing from the Atlantic back up the Amazon River. That stream carries rain that feeds the rainforest and the Amazon River, continuing the cycle. (Video and image credit: It’s Okay to Be Smart)

  • Stone Skipping Physics

    Stone Skipping Physics

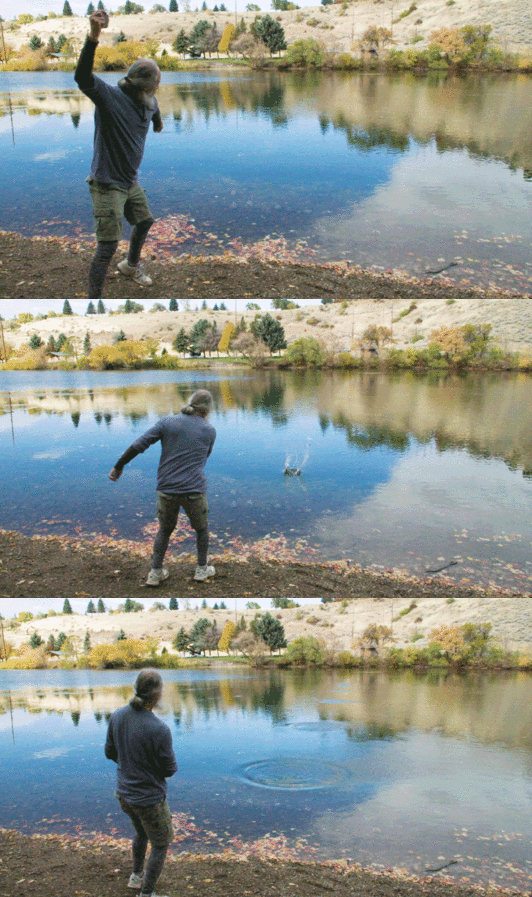
    The current record for stone-skipping is about 88 skips. For most of us, that’s an unimaginably high number, but according to physicists, human throwers may top out around 300 or 350 skips. In the video above and the accompanying article, Wired reporter Robbie Gonzalez explores both the technique of a world-record-holding skip and the physics that enable it.

    The perfect skip requires many ingredients: a large, flat rock with good edges; a strong throw to spin the rock and hold it steady at the right angle of attack; and a good first contact with the right entry angle and force to set up the skips’ trajectory. The video is long, but it’s well worth a full watch. It gives you an inside look both at a master skipper and at the experts of skipping science. (Video and image credit: Wired; see also: Splash Lab, C. Clanet et al.; submitted by Kam-Yung Soh)

    ETA: Wired’s embed code is acting up, so if you can’t see the stone skipping video here, just go to the article directly.

    Heads up for those going to the APS DFD meeting! You can catch my talk Monday, Nov. 19th at 5:10PM in Room B206. I’ll be talking about how to use narrative devices to tell scientific stories. I’ll be around for the whole meeting, so feel free to come say hi!

  • Sheep as a Compressible Flow

    Not everything that flows is a fluid. And when viewed from above traffic, crowds, and even herds of sheep flow in patterns like those of a fluid. In particular, these conglomerations move like compressible fluids – ones that allow substantial changes in density as they flow. From above, each sheep is just a few pixels of white, but you can see which areas of the herd have the highest density by how white an area looks. The highest density regions also tend to be the slowest moving – not surprising in a crowd.

    Now watch the gates. They act like choke points in the flow and, to some extent, like a nozzle in supersonic flow. As the sheep approach the gate, they’re in a dense, slow moving clump, but as they pass through it, the sheep speed up and spread out. This is exactly what happens in a supersonic nozzle. On the upstream end, flow in the nozzle is subsonic and dense. But once the flow hits the speed of sound at the narrowest point in the nozzle, the opening on the downstream side allows the flow to spread out and speed up past Mach 1.  (Video credit: MuzMuzTV*; submitted by Trent D.)

    *Editor’s Note: I do my best to credit the original producers of any media featured on FYFD, but this is especially difficult with viral videos as there can be many copies, all of which are uncredited. I’ve made my best guess on this one, but if this is your video, please let me know so that I can credit you properly. Thanks!

  • Featured Video Play Icon

    An Introduction to Turbulence

    With some help from Physics Girl and her friends, Grant Sanderson at 3Blue1Brown has a nice video introduction to turbulence, complete with neat homemade laser-sheet illuminations of turbulent flows. Grant explains some of the basics of what turbulence is (and isn’t) and gives viewers a look at the equations that govern flow – as befits a mathematics channel! 

    There’s also an introduction to Kolmogorov’s theorem, which, to date, has been one of the most successful theoretical approaches to understanding turbulence. It describes how energy is passed from large eddies in the flow to smaller ones, and it’s been tested extensively in the nearly 80 years since its first appearance. Just how well the theory holds, and what situations it breaks down in, are still topics of active research and debate. (Video and image credit: G. Sanderson/3Blue1Brown; submitted by Maria-Isabel C.)

  • Featured Video Play Icon

    Making a Square Vortex

    As someone who has played with her share of vortex cannons, I can assure you that messing around with smoke generators and vortex rings is a lot of fun. And in this video, Dianna gives things a little twist: she makes the vortex cannon’s mouth a square instead of a circle.

    Now, that doesn’t create a square vortex ring. (Vortex rings don’t really do 90-degree corners.) But it does make the vortex ring all neat and wobbly. Whenever you have two vortices near one another (or, in this case, two parts of a vortex line near one another), they interact. As Dianna shows with hurricanes, depending on the direction of rotation and their relative strength, nearby vortices can orbit one another or travel together in straight lines – or they can cause more complicated interactions, like in the case of the square-launched rings.

    I think there may also be some interesting effects here from vortex stretching, but that’s a topic for another day! (Video and image credit: D. Cowern/Physics Girl; see also: LIBLAB; submitted by Maria-Isabel C.)

  • Featured Video Play Icon

    The Tacoma Narrows Bridge

    One of the most dramatic and famous engineering failures of the twentieth century is also one of the most complicated: the collapse of the Tacoma Narrows Bridge. This early suspension bridge earned the name “Galloping Gurtie” from construction workers while it was still being built because its flexibility made it prone to moving up and down under even relatively light winds. That vertical motion was due to vortex-induced vibration. As the wind blew, it shed vortices off the downstream side of the bridge. These vortices alternated, coming off the top and then bottom of the bridge deck. The resulting forces made the bridge shift up and down.

    That wasn’t the bridge’s ultimate downfall, though. Shortly before it collapsed, the bridge stopped flexing up and down and instead twisted back and forth. This was a clear sign that the bridge had moved into aeroelastic flutter. In this situation, you get a feedback loop between the bridge’s aerodynamics and its structural dynamics. When the wind twists the bridge deck to a positive angle of attack, it will try to continue forcing the bridge to twist that direction. The internal forces of the bridge will try to twist it back, but when that happens, it can overshoot and end up at a negative angle of attack. At that point, the wind tries to push it further that direction and internal forces twist it back, overshooting the other way. This back-and-forth can create a dangerous feedback loop where the twisting of the bridge keeps getting worse and worse. In fact, that’s exactly what happened – right up until the bridge collapsed rather than twisting any more. (Video and image credit: Practical Engineering)

  • Featured Video Play Icon

    “Float”

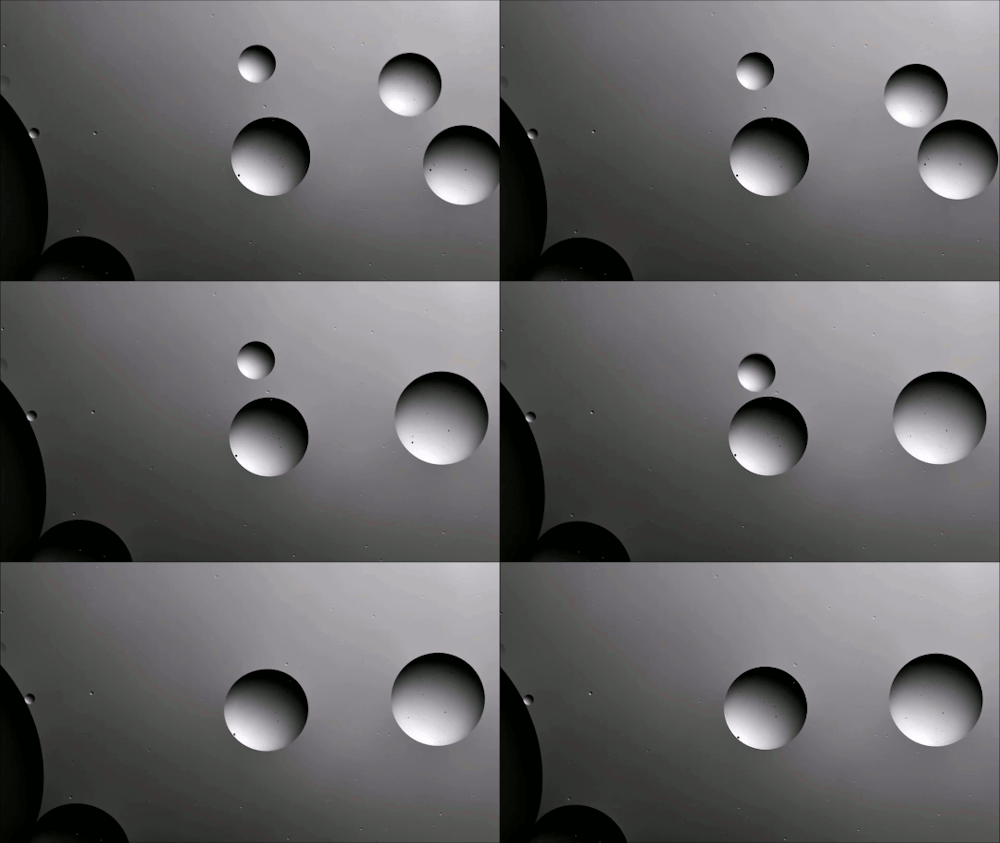
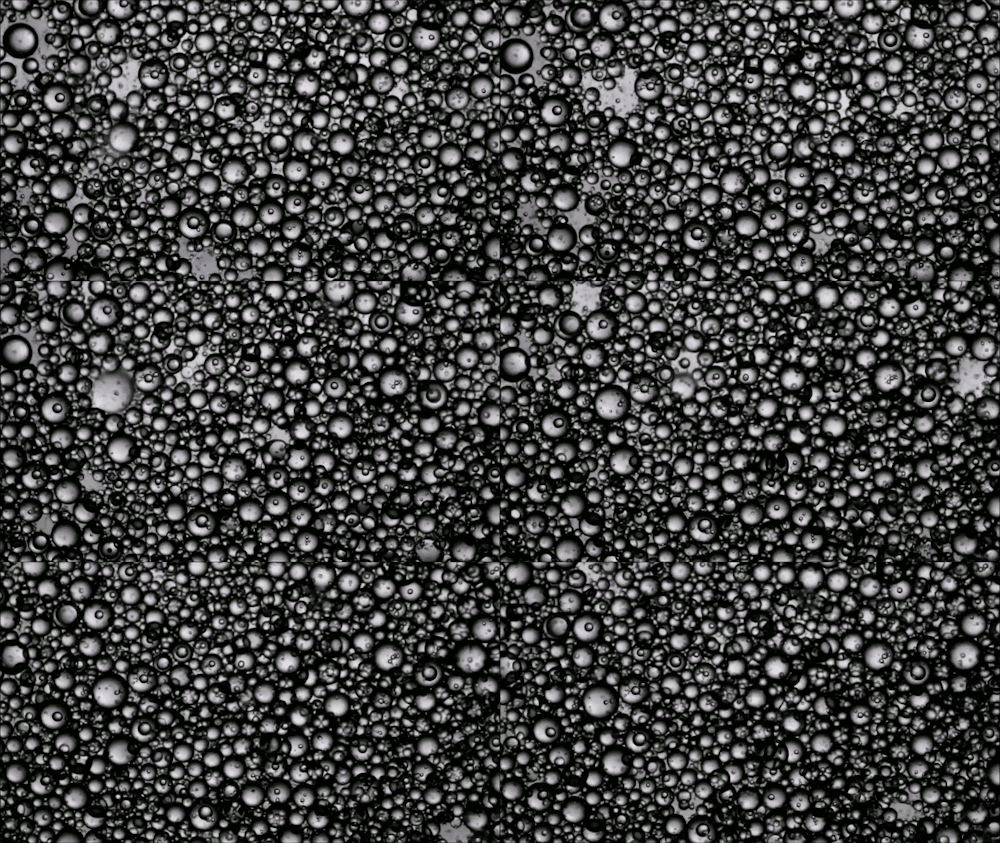
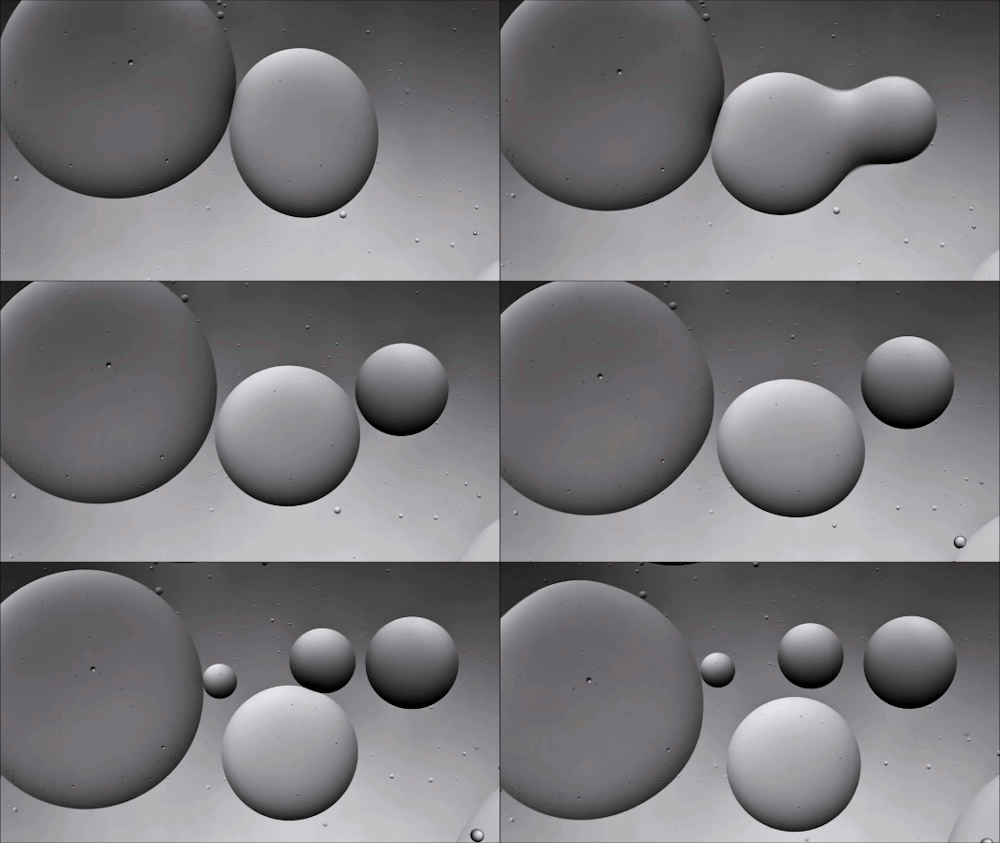
    In “Float” artist Susi Sie uses water and oil to create a whimsical landscape of bubbles and droplets. Coalescence is a major player in the action, though Sie uses some clever time manipulations to make her bubbles and droplets multiply as well. Watching coalescence in reverse feels like seeing mitosis happen before your eyes. (Video and image credit: S. Sie)

  • Featured Video Play Icon

    Inside Hurricane Maria

    In addition to looking outward, NASA constantly monitors our own planet using a suite of satellites. In this video, they visualize data taken by the Global Precipitation Measurement Core Observatory of Hurricane Maria two days before it hit Puerto Rico. Instruments on board the satellite measure both liquid and frozen precipitation, giving scientists – and now the public – a glimpse into the heart of a developing hurricane. Be sure to take a look around; it’s a 360-degree video, and I bet it’s even more spectacular in VR. Having a trove of data like this helps researchers better understand the processes that influence a strengthening hurricane, which ultimately allows them to make better predictions about hurricane behavior in order to save lives. (Video credit: NASA; via Francesco C.)