
This surrealistic timelapse doesn’t show an ocean in the sky. These are undulatus asperatus clouds rolling over Lincoln, Nebraska. Also known simply as asperatus, this cloud formation has been proposed as but not yet recognized as a distinctive cloud type. Their speed is much slower than shown in the animation, but the wave-like motion is accurate and is the source of the cloud’s name, which comes from the Latin word aspero, meaning to make rough. Though they appear stormy, asperatus clouds do not usually produce storms. They form under conditions similar to those of mammatus clouds, but wind shear at the cloud level causes the undulations to form. (Maybe some Kelvin-Helmholtz instabilities going on there?) You can check out many more images of asperatus clouds at the Cloud Appreciation Society’s gallery. (Image credit: A. Schueth, source video; submitted by leftcoastjunkies)
Tag: science

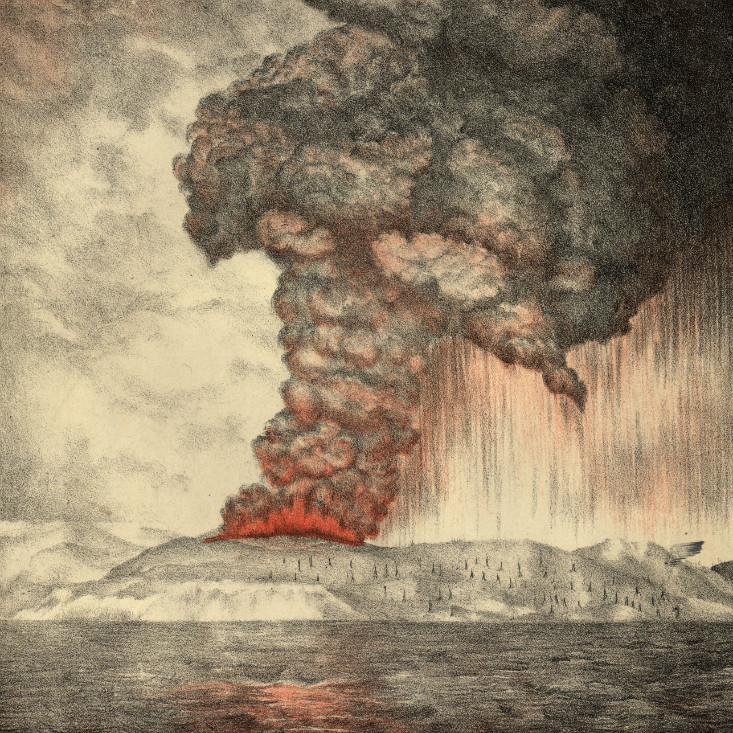
Krakatoa
Volcanoes seem to be a common topic these days. Yesterday Nautilus published a great piece by Aatish Bhatia on the 1883 eruption of Krakatoa, which tore the island apart and unleashed a sound so loud it was heard more than 4800 km away:
The British ship Norham Castle was 40 miles from Krakatoa at the time of the explosion. The ship’s captain wrote in his log, “So violent are the explosions that the ear-drums of over half my crew have been shattered. My last thoughts are with my dear wife. I am convinced that the Day of Judgement has come.“
In general, sounds are caused not by the end of the world but by fluctuations in air pressure. A barometer at the Batavia gasworks (100 miles away from Krakatoa) registered the ensuing spike in pressure at over 2.5 inches of mercury. That converts to over 172 decibels of sound pressure, an unimaginably loud noise. To put that in context, if you were operating a jackhammer you’d be subject to about 100 decibels. The human threshold for pain is near 130 decibels, and if you had the misfortune of standing next to a jet engine, you’d experience a 150 decibel sound. (A 10 decibel increase is perceived by people as sounding roughly twice as loud.) The Krakatoa explosion registered 172 decibels at 100 miles from the source. This is so astonishingly loud, that it’s inching up against the limits of what we mean by “sound.” #
Those are some mindbogglingly enormous numbers. Aatish does a wonderful job of explaining the science behind an explosion whose effects ricocheted through the atmosphere for days afterward. Check out the full article over at Nautilus. (Image credit: Parker & Coward, via Wikipedia)

Pyroclastic Flow

Saturday morning Japan’s Mount Ontake erupted unexpectedly, sending a pyroclastic flow streaming down the mountain. Many, though sadly not all, of the volcano’s hikers and visitors survived the eruption. Pyroclastic flows are fast-moving turbulent and often super-heated clouds filled with ash and poisonous gases. They can reach speeds of 700 kph and temperatures of 1000 degrees C. The usual gases released in a pyroclastic flow are denser than air, causing the cloud to remain near the ground. This is problematic for those trying to escape because the poisonous gases can fill the same low-lying areas in which survivors shelter. Heavy ashfall from the flow can destroy buildings or cause mudslides, and the fine volcanic glass particles in the ash are dangerous to inhale. The sheer power and scale of these geophysical flows is stunning to behold. Those who have witnessed it firsthand and survived are incredibly fortunate. For more on the science and history of Mount Ontake, see this detailed write-up at io9. (Image credits: A. Shimbun, source video; K. Terutoshi, source video; via io9)

200k Followers!
Exciting milestone: 200,000 Tumblr followers! What a great early birthday present. Thank you to everyone who follows, shares, asks questions, and submits topics. FYFD wouldn’t be what it is today without all of you.

Freediving
The freediving del Rosario brothers have created a real treat with this underwater film. There are no computer-generated special effects, just some clever tricks with camera angles, perspective, and buoyancy. The end result is slightly surrealistic and captures some of the fluid beauty of the ocean. And don’t miss the excellent bubble ring vortices. (Video credit: The Ocean Brothers; via Gizmodo; submitted by jshoer)

Saturnian Auroras

Earth is not the only planet in our solar system with auroras. As the solar wind–a stream of rarefied plasma from our sun–blows through the solar system, it interacts with the magnetic fields of other planets as well as our own. Saturn’s magnetic field second only to Jupiter’s in strength. This strong magnetosphere deflects many of the solar wind’s energetic particles, but, as on Earth, some of the particles get drawn in along Saturn’s magnetic field lines. These lines converge at the poles, where the high-energy particles interact with the gases in the upper reaches of Saturn’s atmosphere. As a result, Saturn, like Earth, has impressive and colorful light displays around its poles. (Image credit: ESA/Hubble, M. Kornmesser & L. Calçada, source video; via spaceplasma)
City Winds Simulated
Anyone who has spent much time in an urban environment is familiar with the gusty turbulence that can be generated by steady winds interacting with tall buildings. To the atmospheric boundary layer–the first few hundred meters of atmosphere just above the ground–cities, forests, and other terrain changes act like sudden patches of roughness that disturb the flow and generate turbulence. The video above shows a numerical simulation of flow over an urban environment. The incoming flow off the ocean is relatively calm due to the smoothness of the water. But the roughness of an artificial island just off the coast acts like a trip, creating a new and more turbulent boundary layer within the atmospheric boundary layer. It’s this growing internal boundary layer whose turbulence we see visualized in greens and reds. (Video credit: H. Knoop et al.)

The Chelyabinsk Meteor
In February 2013 a meteor streaked across the Russian sky and burst in midair near Chelyabinsk. A recent Physics Today article summarizes what scientists have pieced together about the meteor, from its origins to its demise. The whole article is well worth reading. Here’s a peek:
The Chelyabinsk asteroid first felt the presence of Earth’s atmosphere when it was thousands of kilometers above the Pacific Ocean. For the next dozen minutes, the 10 000-ton rock fell swiftly, silently, and unseen, passing at a shallow angle through the rarefied exosphere where the molecular mean free path is much greater than the 20-m diameter of the rock. Collisions with molecules did nothing to slow the gravitational acceleration as it descended over China and Kazakhstan. When it crossed over the border into Russia at 3:20:20 UT and was 100 km above the ground, 99.99997% of the atmosphere was still beneath it.
Because the asteroid was moving much faster than air molecules could get out of its way, the molecules began to pile up into a compressed layer of high-temperature plasma pushing a shock wave forward. Atmospheric density increases exponentially with depth, so as the asteroid plunged, the plasma layer thickened and its optical opacity rapidly increased. About one second later, at 95 km above the surface, it became bright enough to be seen from the ground. That was the first warning that something big was about to happen. #
How often are scientific articles that gripping?! Kring and Boslough provide some excellent descriptions of the aerodynamics of the meteor and its airburst. Be sure to check it out. (Photo credit: M. Ahmetvaleev; paper credit: D. Kring and M. Boslough; via io9)
Turning Into 2D
UCLA Spinlab has another great video demonstrating the effects of rotation on a fluid. In a non-rotating fluid, flow over an obstacle is typically three-dimensional, with flow moving over as well as around the object. But in a steadily rotating fluid, as shown in the latter half of the video, the flow only moves around the obstacle, not over it. This non-intuitive behavior is part of the Taylor-Proudman theorem, which shows that flow around an obstacle in a rapidly rotating fluid will be two-dimensional and confined to planes perpendicular to the axis of rotation. (For the mathematically-inclined, Wikipedia does have a short derivation.) This 2D flow creates what are called Taylor columns over the obstacle. The Taylor column is like an imaginary extension of the original obstacle, turning the puck into a tall cylinder, and it’s real enough to flow, which diverts around it as though the column were there. (Video credit: UCLA Spinlab)

Transonic Flow
In the transonic speed regime the overall speed of an airplane is less than Mach 1 but some parts of the flow around the aircraft break the speed of sound. The photo above shows a schlieren photograph of flow over an airfoil at transonic speeds. The nearly vertical lines are shock waves on the upper and lower surfaces of the airfoil. Although the freestream speed in the tunnel is less than Mach 1 upstream of the airfoil, air accelerates over the curved surface of airfoil and locally exceeds the speed of sound. When that supersonic flow cannot be sustained, a shock wave occurs; flow to the right of the shock wave is once again subsonic. It’s also worth noting the bright white turbulent flow along the upper surface of the airfoil after the shock. This is the boundary layer, which can often separate from the wing in transonic flows, causing a marked increase in drag and decrease in lift. Most commercial airliners operate at transonic Mach numbers and their geometry is specifically designed to mitigate some of the challenges of this speed regime. (Image credit: NASA; via D. Baals and W. Corliss)


