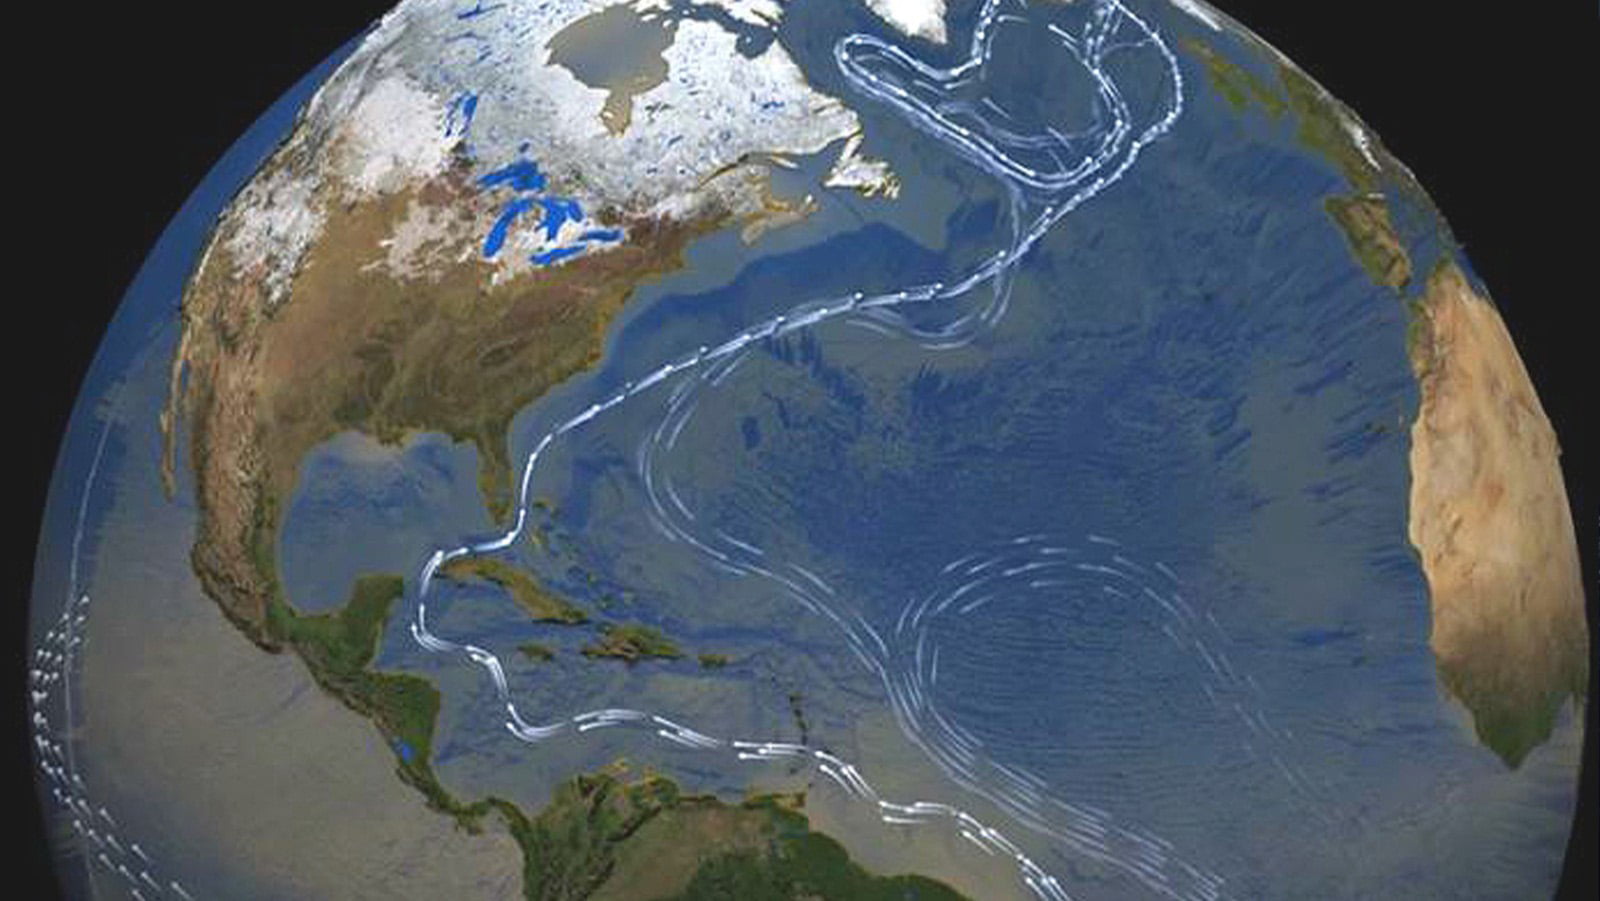
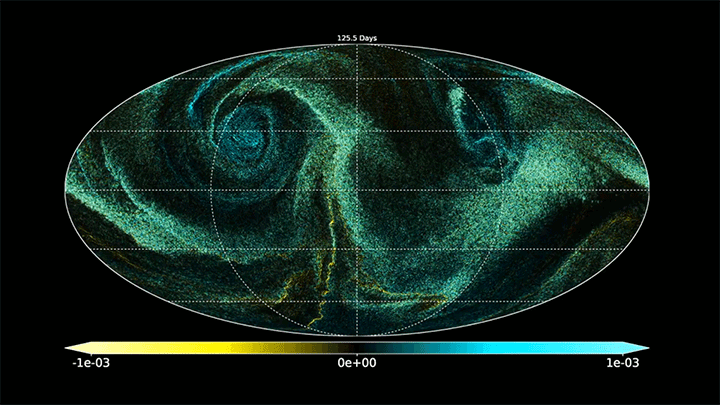
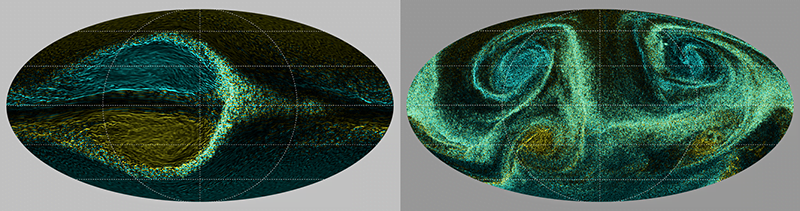
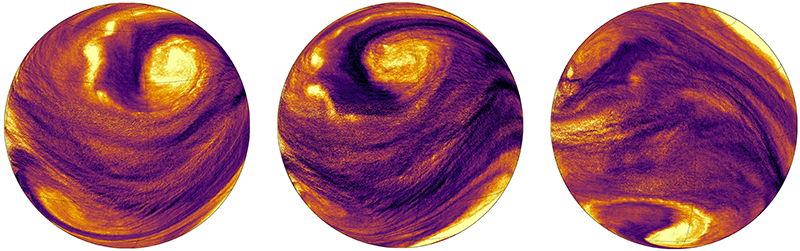
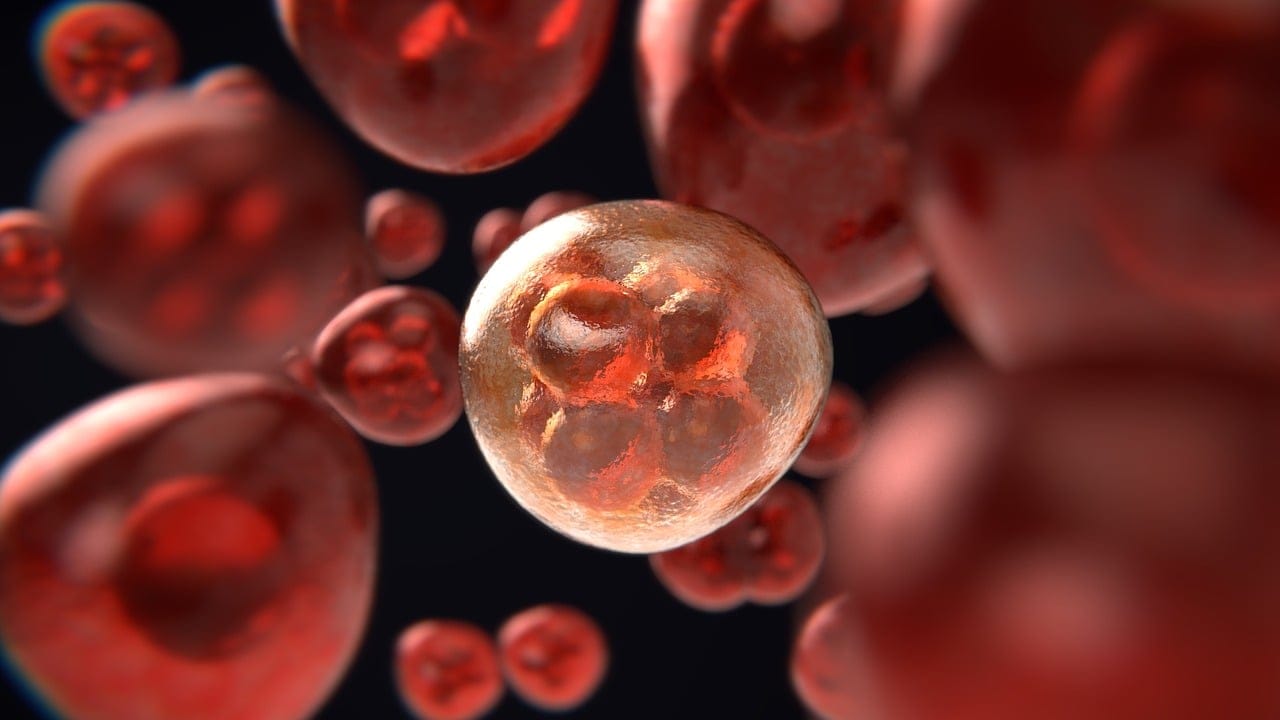
Tag: numerical simulation

  • Resolution Effects on Ocean Circulation

    Resolution Effects on Ocean Circulation

    The Gulf Stream current carries warm, salty water from the Gulf of Mexico northeastward. In the North Atlantic, this water cools and sinks and drifts southwestward, emerging centuries later in the Southern Ocean. Known as the Atlantic Meridional Overturning Circulation (AMOC), this circulation is critical, among other things, to Europe’s temperate climate. Since 1995, scientists have been warning that human-driven climate change is weakening the AMOC and may cause it to shut down entirely — which would have catastrophic consequences for our society.

    Comparison of ocean current speeds in the low-resolution (left) and high-resolution (right) simulations.
    Comparison of ocean current speeds in the low-resolution (left) and high-resolution (right) simulations.

    A recent study re-examined the AMOC using both low- and high-resolution numerical simulations, combined with direct observations. Both simulations covered 1950 – 2100 and found the AMOC’s strength has declined since 1950. But the high-resolution simulation found significant regional variations in the AMOC’s behavior. Some regions saw localized strengthening, while other areas showed abrupt collapse. These sensitive shifts underscore the importance of driving toward higher resolutions in our next-generation climate models, if we want to better understand — and perhaps predict — what lies ahead as our climate changes. (Image credit: illustration – Atlantic Oceanographic and Meteorological Laboratory, simulations – R. Gou et al.; research credit: R. Gou et al.; via APS Physics)

  • Venus Flower Basket Sponges

    Venus Flower Basket Sponges

    Venus flower basket sponges have an elaborate, vase-like skeleton pocked with holes that allow water to pass through the organism. A recent numerical study looked at how the sponge’s shape deflects incoming (horizontal) ocean currents into a vertical flow the sponge can use to filter out food.

    The sponges’ structure is porous and lined with helical structures. In their simulation, researchers reproduced a version of this structure (shown below) that used none of the real sponge’s active pumping mechanisms. The digital sponge was, instead, purely passive. Nevertheless, the simulation showed that, by their skeletal structure alone, sponges could redirect a significant fraction of incoming flow toward its filtering surfaces. Interestingly, the highest deflection fraction occurred at relatively low flow speeds, showing that the sponges are set up so that their structure is especially helpful for scavenging nutrients from nearly-still waters.

    In the real world, these sponges use a combination of passive filtering and active pumping to capture their food, but this study shows that the sponge’s clever structure helps it save energy, especially in tough flow conditions. (Image credit: sponges – NOAA, simulation – G. Falcucci et al.; research credit: G. Falcucci et al.; via APS Physics)

    A detail from a numerical simulation shows streamlines around and inside a model sponge.
    A detail from a numerical simulation shows streamlines around and inside a model sponge.
  • Slipping Along Enceladus

    Slipping Along Enceladus

    Home to a sub-surface ocean, Saturn‘s moon Enceladus is a fascinating candidate for life in our solar system. As it orbits Saturn, plumes periodically shoot out long surface features known as tiger stripes that sit near the icy moon’s southern pole. A recent study, based on numerical simulation, suggests a geophysical mechanism that could account for the plumes.

    The team suggests that, like the San Andreas Fault, the tiger stripes are a fault subject to strike-slip motion. In this type of fault, the ice on either side meets along a vertical face and the two sides will slide past one another in opposite directions. As Enceladus orbits, its proximity to Saturn causes tidal compression across the fault that modulates how much slip motion occurs. In their model, the authors found that strike-slip motion would intermittently open gaps in the fault that would allow water from the subsurface ocean to create plumes at intervals consistent with those observed. (Image credit: top – NASA/JPL-Caltech/Space Science Institute, illustration – A. Berne et al.; research credit: A. Berne et al.; via Gizmodo)

    Illustration of the strike-slip mechanism over the course of Enceladus's tides. The two sides of the "tiger stripe" fault move in opposite directions. How much they move depends on the amount of tidal compression caused by Enceladus's orbit around Saturn. At times, motion along the fault pulls apart narrow sections of the ice, allowing a plume to spray out.
    Illustration of the strike-slip mechanism over the course of Enceladus’s tides. The two sides of the “tiger stripe” fault move in opposite directions. How much they move depends on the amount of tidal compression caused by Enceladus’s orbit around Saturn. At times, motion along the fault pulls apart narrow sections of the ice, allowing a plume to spray out.
  • Saving Screens with Shear-Thinning Fluids

    Saving Screens with Shear-Thinning Fluids

    These days glass screens travel with us everywhere, and they can take some big hits on the way. Manufacturers have made tougher glass, but they continue to look for ways to protect our screens. Recently, a study suggested that non-Newtonian fluids are well-suited to the task.

    The team explored the physics of sandwiching a layer of fluid between a glass top layer and an LCD screen bottom layer, mimicking structures found in electronic devices. Through simulation, they searched for the fluid characteristics that would best minimize the forces felt by the solid layers during an impact. They found that shear-thinning fluids — fluids that, like paint or shampoo, get runnier when they’re deformed — provided the best protection. Having the impact energy go into reducing the local viscosity of the fluid stretches the length of time the impact affects the glass, which lowers the bending forces on it and helps avoid breakage. (Image credit: G. Rosenke; research credit: J. Richards et al.; via Physics World)

  • Exoplanet Heating

    Exoplanet Heating

    WASP-96B is a tidally-locked exoplanet between the size of Saturn and Jupiter. This hot, massive planet lies close to its star, orbiting in less than three-and-a-half Earth days. A recent study shows that planets like these can have very different weather, depending on what depth their atmosphere absorbs heat at.

    Using numerical simulations, researchers took a detailed look at the possible atmospheric dynamics on this planet. When the atmosphere absorbed heat at a shallow depth — near the outer layers of the planet — a coupled vortex pair formed (left, below). These vortices promenaded westward and completed a circuit around the planet every 11-15 days.

    Shallow heating on a hot Jupiter produces a pair of coupled vortices (left), but deeper heating in the atmosphere generates four more-chaotic vortices (right).
    Shallow heating on a hot Jupiter produces a pair of coupled vortices (left), but deeper heating in the atmosphere generates four more-chaotic vortices (right).

    In contrast, deeper heating produced a more-chaotic pattern of four vortices (right, above) that each lasted 3 to 15 days before disappearing, replaced by a new vortex. This atmosphere, they found, was very turbulent, with smaller-scale vortices as well.

    Since each weather pattern is visually distinct and carries its own brightness signature, the authors predict that additional observations of WASP-96b with the current generation of telescopes will show which type of heating dominates on the exoplanet. (Image and research credit: J. Skinner et al.; via APS Physics)

    Snapshots from a simulation of a deep-heated hot Jupiter. Each image shows the planet on a different day.
    Snapshots from a simulation of a deep-heated hot Jupiter. Each image shows the planet on a different consecutive day.
  • Droplet Medusa

    Droplet Medusa

    Vibration is one method for breaking a drop into smaller droplets, a process known as atomization. Here, researchers simulate this break-up process for a drop in microgravity. Waves crisscrossing the surface create localized craters and jets, making the drop resemble the Greek mythological figure of Medusa. With enough vibrational amplitude, the jets stretch to point of breaking, releasing daughter droplets. (Image and research credit: D. Panda et al.)

  • Extreme Weather and Climate Change

    Extreme Weather and Climate Change

    Extreme weather events like floods, hurricanes, atmospheric rivers, heat waves, and droughts are increasingly discussed in terms of the effects of climate change. Because complex systems have complex causes, it’s difficult to draw exact lines of causality between human-made climate change and a given weather event. But scientists have built an array of tools that help address two key questions: 1) how much more extreme was this weather due to climate change, and 2) how much more likely was this extreme event due to climate change?

    Comparing (a) the actual flooding from Hurricane Harvey with (b) the estimated flood that would have been without climate change. The depth of actual flood waters was about 1m greater due to climate change.
    Comparing (a) the actual flooding from Hurricane Harvey with (b) the estimated flood that would have occurred without climate change. The depth of actual flood waters was about 1m greater due to climate change.

    To answer the first question, scientists often use hindcasts. In these studies, scientists first build a simulation that mirrors the actual event, like Hurricane Harvey’s stall over Houston, Texas. Once their simulated storm reflects the actual one, they tweak the initial conditions to reflect a world without climate change and see how the storm differs. By comparing the actual and simulated floods (image above), scientists can estimate just how much worse climate change made things. In Harvey’s case, they found that human activity increased the overall precipitation by 19% and that 32% of the flooded homes in Harris county would not have flooded in a world without climate change. Detailed results from that particular study can be explored in the web portal here. (Image credits: Flooded street – J. Gade, Harvey flooding – M. Wehner; research credit: M. Wehner in Physics Today)

  • Leidenfrost Collapse

    Leidenfrost Collapse

    When a droplet encounters a surface much hotter than its boiling point, it forms a thin layer of vapor that insulates the liquid from the surface. But this Leidenfrost effect can’t last forever. Eventually, the vapor layer destabilizes and the drop touches the surface, causing explosive boiling that destroys the drop.

    To determine how the layer destabilizes, researchers simulated the breakdown. To their surprise, they found that inertial forces in the micron-thin vapor layer were critical for destabilization. The gas inertia caused reductions in pressure that pulled the liquid toward the surface. Usually at these small scales, we’d ignore inertial effects and focus instead on viscosity, but, for Leidenfrost drops, that simplification doesn’t work. (Image credit: L. Gledhill; research credit: D. Harvey and J. Burton)

  • Fish Fins Work Together

    Fish Fins Work Together

    Researchers studying how fish swim have long focused on their tail fins and the flows created there. But a fish’s other fins have important effects, too, as seen in this recent study. Researchers built a CFD simulation based on observations of a swimming rainbow trout, focusing on the flow from its back and tail fins. They found that the vortex created by the back fin stabilizes and strengthens the one generated by the tail. It also played a role in reducing drag on the fish by maintaining the pressure difference across the body. When they tried changing the size and geometry of the fins, the fish’s efficiency suffered, indicating that evolution has already optimized the trout’s fins for swimming efficiency. (Image credits: top – J. Sailer, simulation – J. Guo et al.; research credit: J. Guo et al.; via APS Physics)

    Visualization of flow around a digitized rainbow trout.
    Visualization of flow around a digitized rainbow trout.
  • Lanes in Crowds

    Lanes in Crowds

    In nature — from atoms to human crowds — two groups moving in opposite directions often spontaneously organize into interwoven lanes flowing in their respective directions. Now researchers have built a mathematical model for this behavior, building on Einstein’s observations of Brownian motion.

    To test their model, the researchers performed numerical simulations and experiments with pedestrians. Intriguingly, they found that introducing rules like “always pass on the right” created unexpected results, such as tilted lanes. With their model verified — at least for low-density crowds — the group hope to uncover other hidden patterns within crowds. (Image and research credit: K. Bacik et al.; via Physics World)

    An animation showing one pedestrian experiment.
    In their validation experiments, the researchers filmed groups of pedestrians walking past one another under different conditions. Note the lanes that form as the two groups interleave.