Tag: numerical simulation

  • Fish Fins Work Together

    Fish Fins Work Together

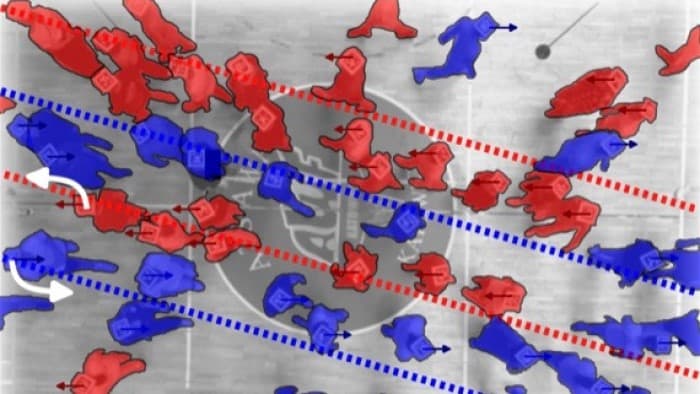
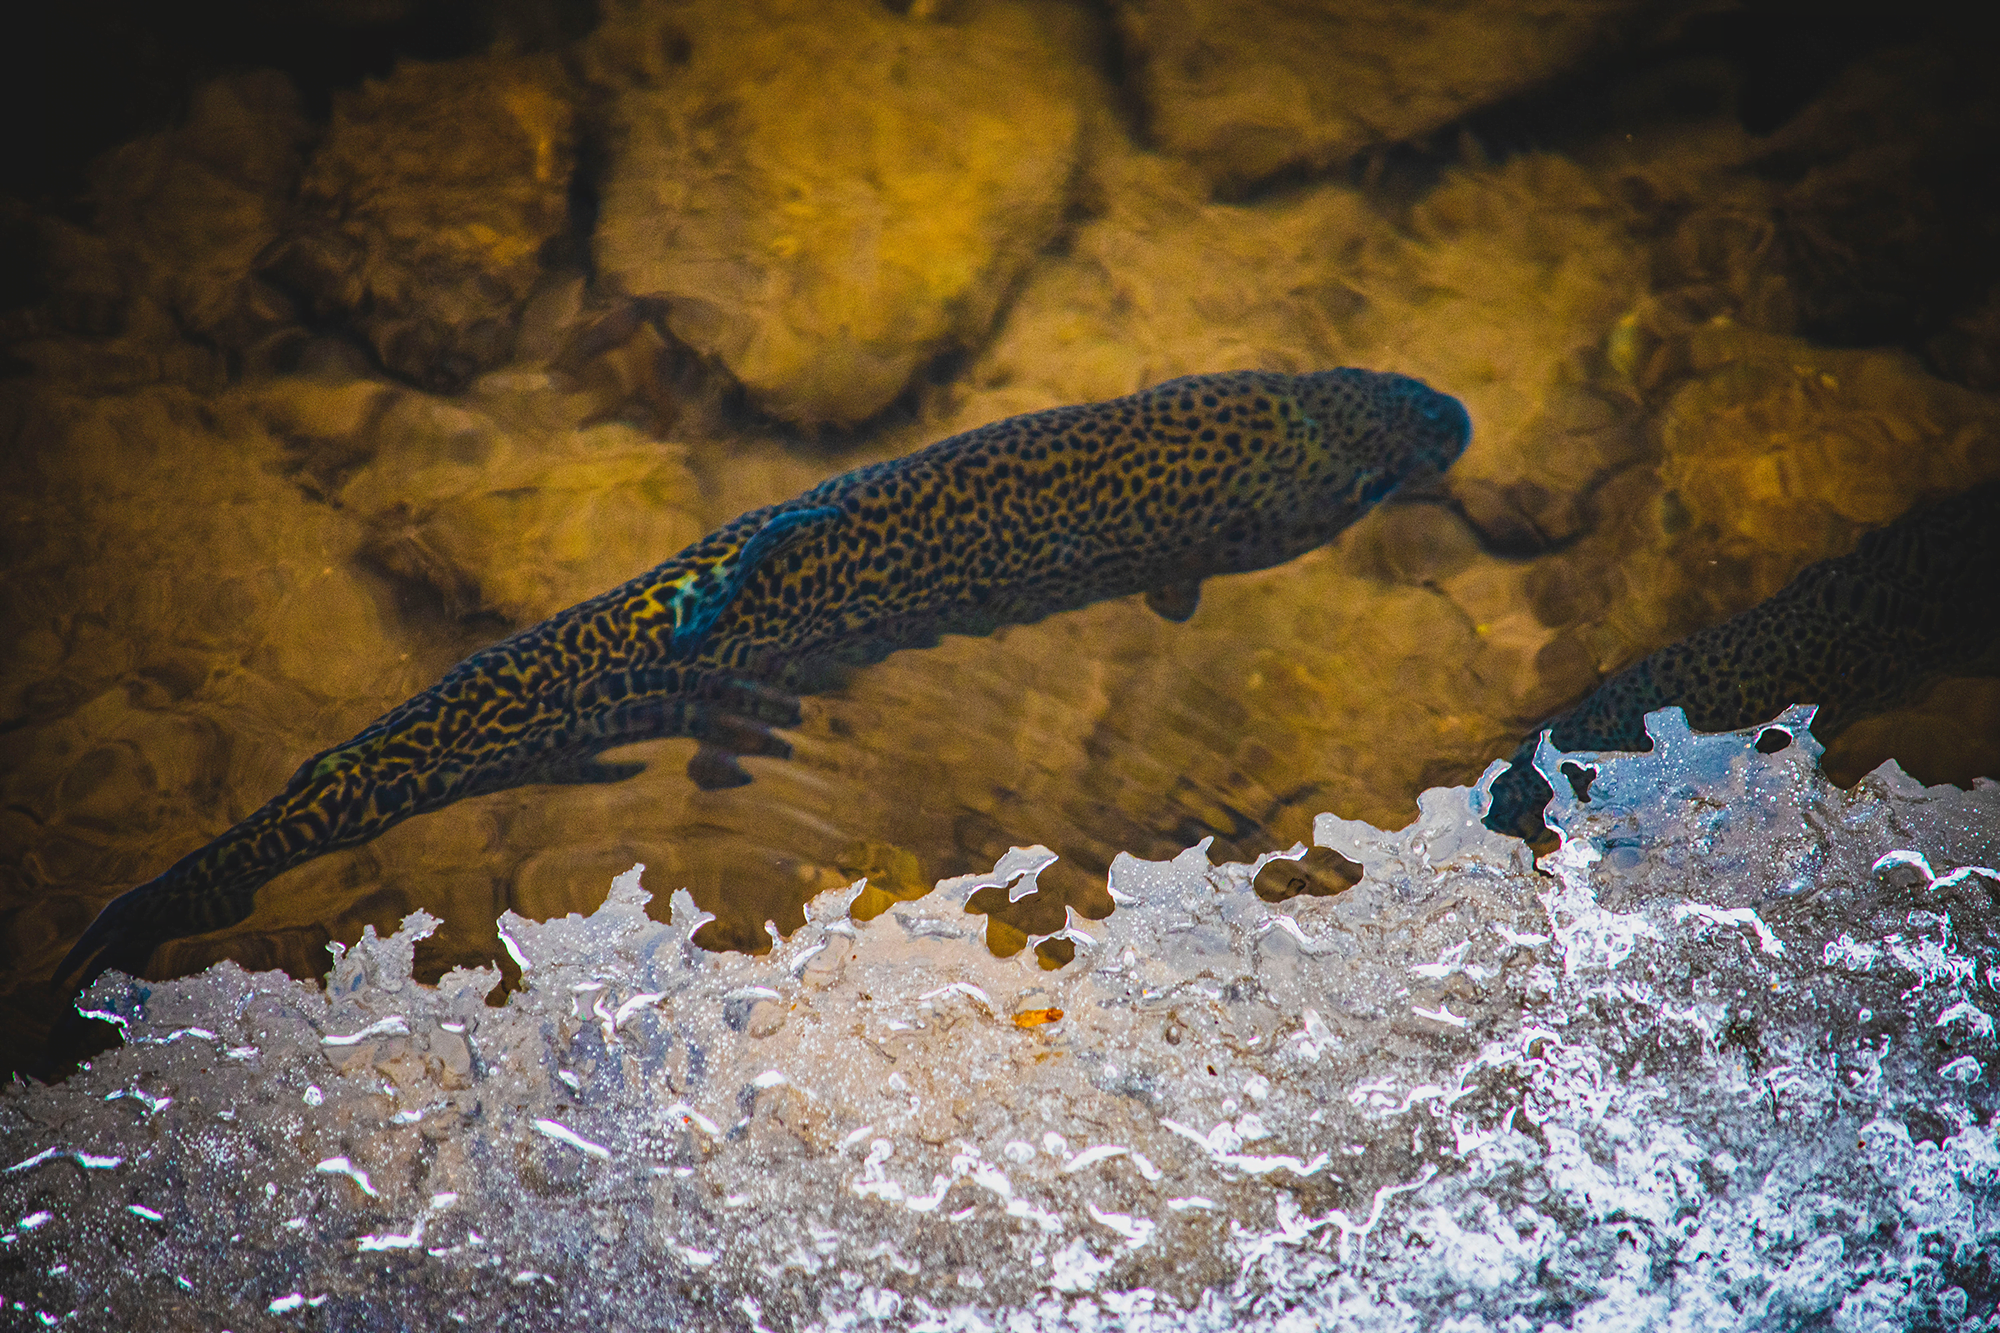
    Researchers studying how fish swim have long focused on their tail fins and the flows created there. But a fish’s other fins have important effects, too, as seen in this recent study. Researchers built a CFD simulation based on observations of a swimming rainbow trout, focusing on the flow from its back and tail fins. They found that the vortex created by the back fin stabilizes and strengthens the one generated by the tail. It also played a role in reducing drag on the fish by maintaining the pressure difference across the body. When they tried changing the size and geometry of the fins, the fish’s efficiency suffered, indicating that evolution has already optimized the trout’s fins for swimming efficiency. (Image credits: top – J. Sailer, simulation – J. Guo et al.; research credit: J. Guo et al.; via APS Physics)

    Visualization of flow around a digitized rainbow trout.
    Visualization of flow around a digitized rainbow trout.
  • Lanes in Crowds

    Lanes in Crowds

    In nature — from atoms to human crowds — two groups moving in opposite directions often spontaneously organize into interwoven lanes flowing in their respective directions. Now researchers have built a mathematical model for this behavior, building on Einstein’s observations of Brownian motion.

    To test their model, the researchers performed numerical simulations and experiments with pedestrians. Intriguingly, they found that introducing rules like “always pass on the right” created unexpected results, such as tilted lanes. With their model verified — at least for low-density crowds — the group hope to uncover other hidden patterns within crowds. (Image and research credit: K. Bacik et al.; via Physics World)

    An animation showing one pedestrian experiment.
    In their validation experiments, the researchers filmed groups of pedestrians walking past one another under different conditions. Note the lanes that form as the two groups interleave.
  • Gathering Safely

    Gathering Safely

    One effect of the COVID-19 pandemic is a renewed interest in the physics of disease transmission and what measures can protect us from airborne respiratory illnesses. This recent study looks at how meetings — whether in classrooms, conferences, or care facilities — can transmit infections. Their mathematical model is able to handle many variables — room size, number of people, length of meeting, breaks between sessions, masking, ventilation, and so on. Without prescribing any one policy, the authors aim to inform decision makers so that they can choose what methods (testing, masking, ventilation, etc.) work best for their event.

    That said, they find that ventilation and periodic breaks between meetings are highly effective in reducing a room’s viral load. Leaving enough time between sessions for ventilation to clear the room was as effective (or more effective) than masking and moderate isolation of those infected. Tools like these are vital in enabling gatherings that keep participants safe. (Image credit: Product School; research credit: A. Dixit et al.; submitted by Kam-Yung Soh)

  • Featured Video Play Icon

    Predicting Contamination in Urban Environs

    The canyons of a city’s streets form a complex flow environment. To better understand the risks of a spreading contaminant, researchers simulated a release in lower Manhattan’s urban jungle. The released particles spread due to the dominant wind pattern of the area. Initially, the particles follow the street pattern and stay at a low elevation. But updrafts on the downwind side of skyscrapers lift the particles higher, spreading them to lower concentrations at more elevations.

    Public officials study simulations like these to understand what response is needed to protect people in the event of an accidental or intentional release of harmful materials. (Image and video credit: W. Oaks and A. Khosronejad)

  • A Bubble’s Path

    A Bubble’s Path

    Centuries ago, Leonardo da Vinci noticed something peculiar about bubbles rising through water. Small bubbles followed a straight path, but slightly larger ones swung back and forth or corkscrewed upward. The mechanism behind this behavior has been a matter of debate ever since, but the authors of a recent study believe they’ve nailed down the answer.

    The forces determining a bubble’s path are remarkably complex, which is why it’s taken so long to figure this out. Viscosity acts as a source of drag on the rising bubble, acting across a thin boundary region surrounding the bubble. That boundary isn’t constant, though; the bubble’s shape changes as the flow pushes on it, and the changing shape of the bubble pushes on the flow, in turn. Capturing those subtle interactions numerically and comparing them to careful experiments was necessary to unravel the mystery.

    The team found that bubbles above a critical radius (0.926 millimeters) begin to tilt. That tilt causes a change in the bubble’s shape, which increases the flow along one side. This kicks off the wobbling motion, which carries on because of the continuing changes in the bubble’s shape and the flow around it. (Image credit: A. Grey; research credit: M. Herrada and J. Eggers; via Vice; submitted by @lediva)

  • The Chicxulub Impact’s Tsunami

    The Chicxulub Impact’s Tsunami

    66 million years ago an asteroid struck offshore of what is now Chicxulub near the Yucatán Peninsula in Mexico. The impact and its aftermath are widely credited with a mass extinction that wiped out 75% of plant and animal life on Earth, including non-avian dinosaurs. Since the impact occurred in shallow waters, it also generated a tsunami, one over 30,000 times bigger than any in recorded history.

    Snapshot showing the spreading tsunami after the asteroid's impact.
    Snapshot showing the spreading tsunami after the asteroid’s impact. Click on the image to go to NOAA’s website and watch the video.

    In this simulation, researchers show how that tsunami spread globally. The initial wave was about a mile high but stretched up to about 2.5 miles as it rushed ashore. Worldwide, every shoreline saw flows at 20 cm/s or higher as the wave hit. In the image above, black areas show the landmasses as they existed at the time, with modern borders shown in white outline. To watch the video, click on the image or head to NOAA’s visualization.

    You may wonder how scientists can validate a simulation like this one, which so wildly exceeds any recorded event. One way they judged these results is by looking at the sedimentary records of the seafloor. Their results show flows large enough to scour the seafloor and disrupt any sedimentary records in those areas, and, sure enough, those regions hold no records older than the asteroid’s impact. That alignment between the geological record and the simulation’s highest flow areas helps establish confidence in the results. (Image credit: illustration – SWRI/D. Davis, simulation – NOAA; research credit: M. Range et al.; submitted by Kam-Yung Soh)

  • Featured Video Play Icon

    Exascale Simulations

    Capturing what goes on inside a combustion engine is incredibly difficult. It’s a problem that depends on turbulent flow, chemistry, heat transfer, and more. To represent all of those aspects in a numerical simulation requires enormous computational resources. It’s not simply the realm of a supercomputer; it requires some of the fastest supercomputers in existence.

    Exascale computing, like that used for the simulations in this video, is defined as at least 10^18 (floating-point) operations per second. For comparison, my PC has a recent, high-end graphics card, and it’s about a million times slower than that. These are absolutely gigantic simulations. (Image and video credit: N. Wimer et al.)

  • Slab Avalanche Physics

    Slab Avalanche Physics

    Slab avalanches like the one shown here begin after weak, porous layers of snow get buried by fresher, more cohesive snow layers. On a steep slope, the weight of the new snow can be too great for friction to hold the slab in place, causing the upper layer to crack and slide at speeds up to 150 meters per second. Scientists had two competing theories for how slab avalanches began. One theory presumed that the weak layer of snow failed under shear; the other argued that the collapse of the lower, porous layer was at fault.

    In a new study combining large-scale numerical simulation with real-life observations, scientists came to a new conclusion: cracks began to form in the porous layer as the weight of heavier snow crushed down, but once the cracks formed, the shear mechanism took over. Cracks formed by shear could propagate along the existing cracks in the porous layer, allowing faster crack propagation than through undamaged snow. In the end, it’s the combination of the two mechanisms that triggers the avalanche. (Image credit: R. Flück; research credit: B. Trottet et al.; via Physics World)

  • Nanoconfined Water

    Nanoconfined Water

    Water is a decidedly weird substance. It’s densest above its freezing point; it has a slippery liquid-like layer on its solid form; and, in the right form, it can bend like a wire. So it’s not surprising that water demonstrates some odd behaviors when it’s confined inside a space so narrow it’s only one molecule thick.

    A new, simulation-based study finds that this nanoscale-confined water flows with a wide variety of behaviors, depending on the temperature and pressure. In some conditions, the water ceases to act molecularly, with hydrogen atoms flowing through a lattice of oxygen atoms. These superionic forms were thought only to exist in the extreme conditions of a gas giant’s interior, but these simulations suggest we can find them under far milder circumstances. (Image and research credit: V. Kapil et al.; via Physics World; submitted by Kam-Yung Soh)

  • Featured Video Play Icon

    Simulating Schools

    In nature, fish school for many reasons: protection from predators, increased sensing, and hydrodynamic advantages. To capture this complex behavior, researchers are building their own digital fish, governed by known rules. Here, scientists give each fish social rules — based on vision range and preferred distance from a neighbor — and hydrodynamic rules — based on a fish’s wake. With the rules in place, they can then observe the schooling behaviors of their digital fish. Like their real counterparts, these schools show different flocking based on apparent “moods”. (Image and video credit: J. Zhou et al.)