Earth’s atmosphere and oceans form a complicated and interconnected system. Water, carbon, nutrients, and heat move back and forth between them. As humanity pumps more carbon and heat into the atmosphere, the oceans–and particularly the Southern Ocean–have been absorbing both. A new study looks ahead at what the long-term consequences of that could be.
The team modeled a scenario where, after decades of carbon emissions, the world instead sees a net decrease in carbon–which could be achieved by combining green energy production with carbon uptake technologies. They found that, after centuries of carbon reduction and gradual cooling, the Southern Ocean could release some of its pent-up heat in a “burp” that would raise global temperatures by tenths of a degree for decades to a century. The burp would not raise carbon levels, though.
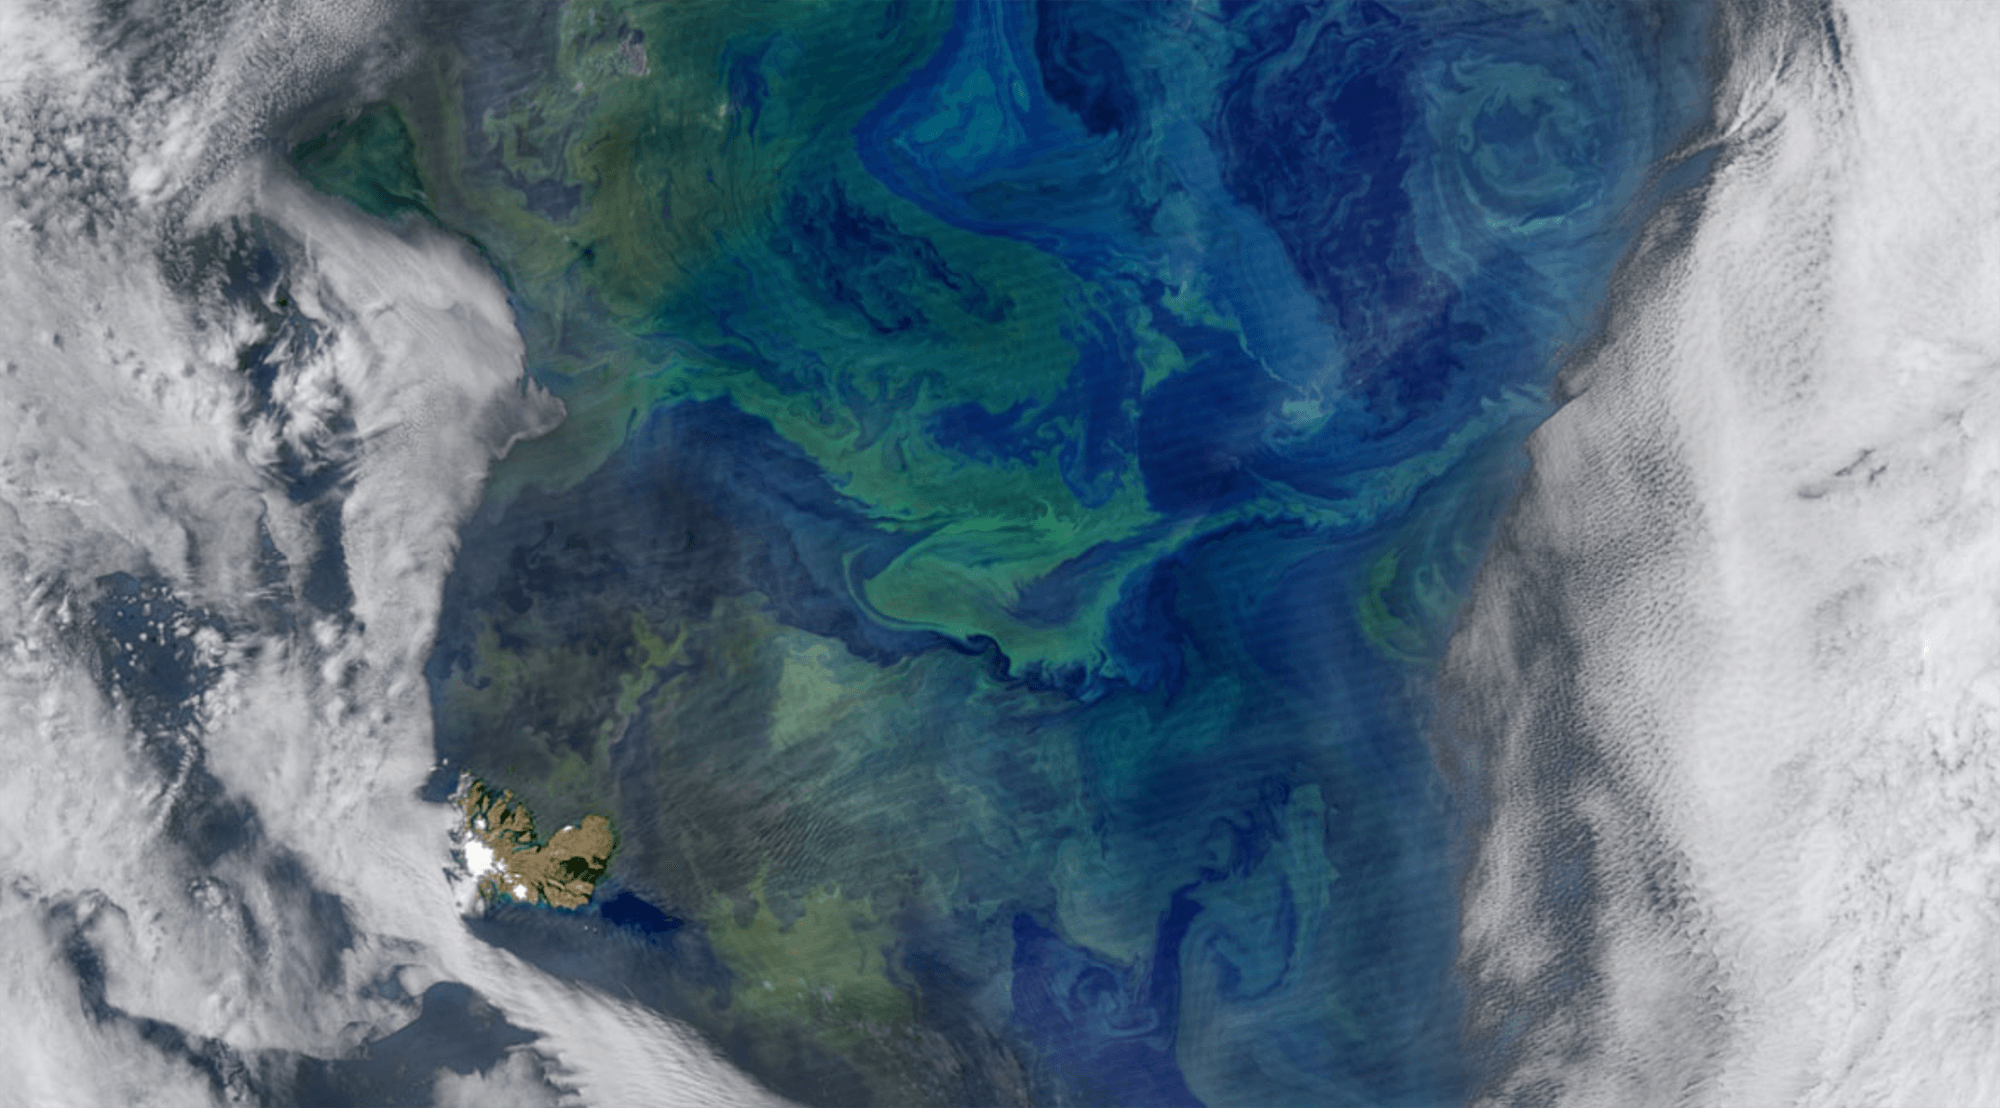
The research suggests that we should continue working to understand the complex balance between the atmosphere and oceans–and how our changes will affect that balance not only now but in the future. (Image credit: J. Owens; research credit: I. Frenger et al.; via Eos)