Smoke visualization, illuminated by a laser sheet, shows a 2D slice from an axisymmetric jet as it breaks down to turbulence. The flow is laminar upon exiting the nozzle, but the high velocity at the edge of the jet and low velocity of the surrounding air causes shear that leads to the Kelvin-Helmholtz instability. This instability leads to the formation of small vortices that grow as they are advected downstream until they are large enough to interrupt the jet and it breaks down into fully turbulent flow. (Video credit: B. O. Anderson and J. H. Jensen)
Tag: flow visualization

Flow Over Swept Wings
Flow over a swept wing behaves very differently than a straight fixed wing or an airfoil. Instead of flowing straight along the chord of the wing in a two-dimensional fashion, air is also directed along the wing, parallel to the leading edge. The above oil flow visualization on a swept wing airplane model shows this curvature of streamlines. As a result of this three-dimensional flow behavior, boundary layers on swept wings are subject to the crossflow instability, which manifests as co-rotating vortices aligned to within a few degrees of the streamlines. Triggering this boundary layer instability can lead to turbulence and higher drag for the aircraft.

Artificial Fins in Tandem
For this image, two artificial fish fins are placed side-by-side and flapped in phase. Flow in the image is upward. The wakes of the fins interact in a complicated vortex street. Researchers hope that studying such flows can help in designing the next generation of autonomous underwater vehicles. (Photo credit: B. Boschitsch, P. Dewey, and A. Smits)

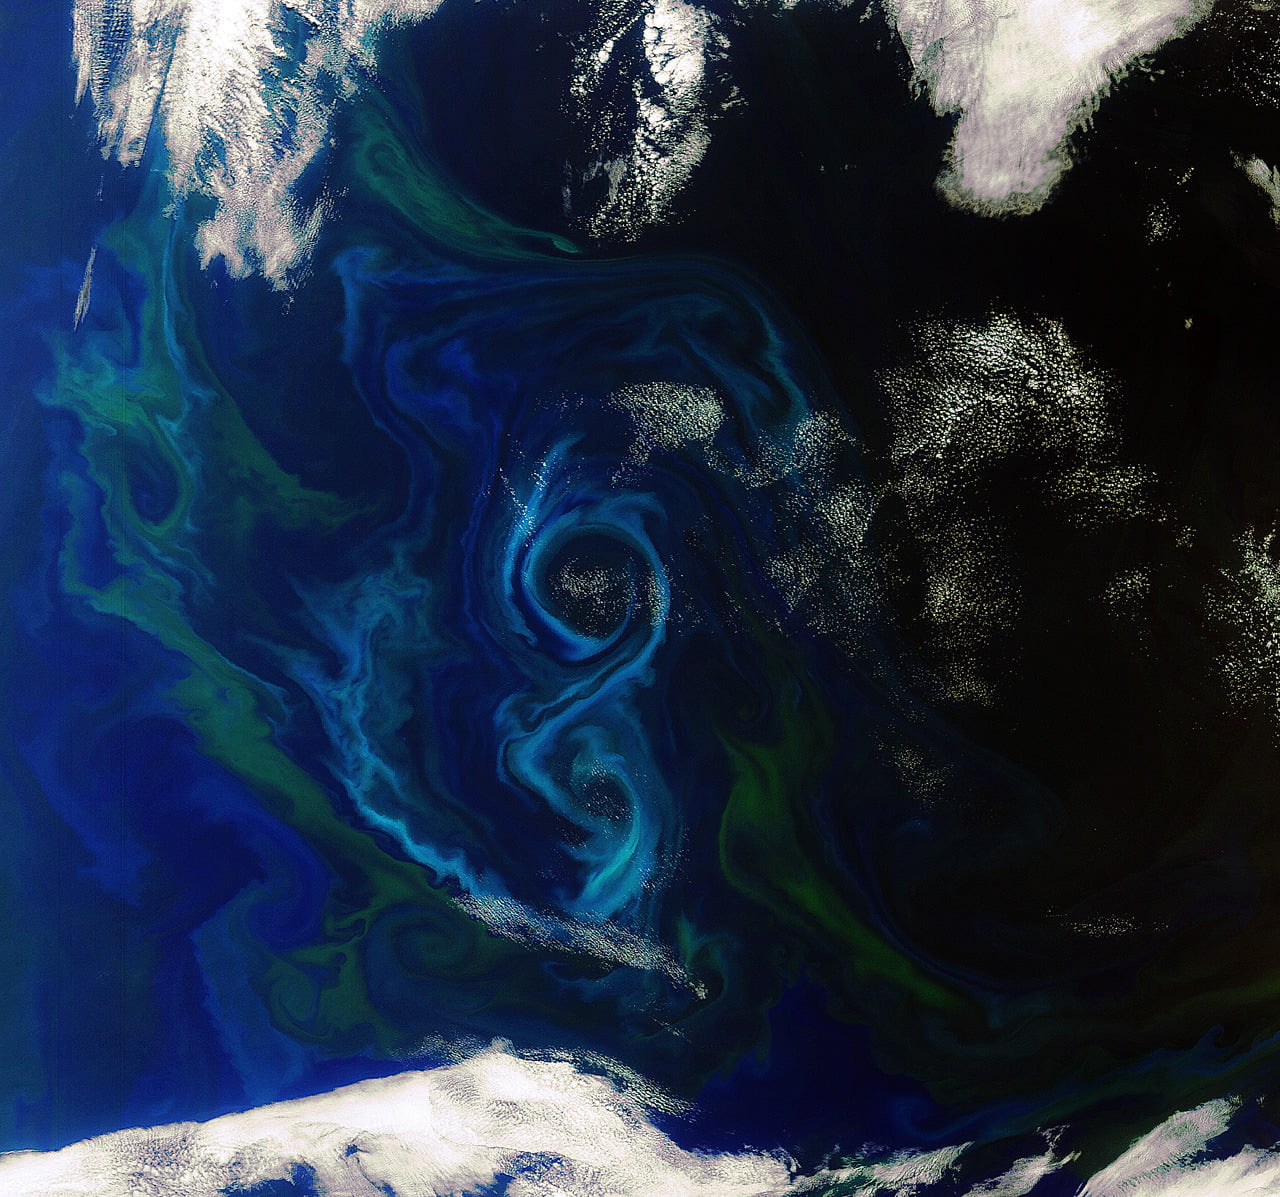
Oceanic Swirls
Mixing of surface waters with deeper ocean currents brings together the minerals and nutrients used by phytoplankton, resulting in gorgeous swirls of color in the ocean. These phytoplankton blooms are most common in the spring and summer, and while lovely, can be harmful to other marine life, either through the production of toxins or by depleting the waters of oxygen. Because the phytoplankton move according to the wind and waves, they can also form a sort of natural flow visualization. (Photo credit: ESA)
———-
While FYFD is not blacking out for SOPA/PIPA, we would like to take a moment to register our protest and encourage those of you who are Americans to take a moment to let Congress know that you don’t approve of these bills. Although we agree that protection of copyright holders rights is important, the measures proposed in these bills reach far beyond that line. FYFD, as a site that reposts photos and videos primarily created by others, could be taken down as a result of these bills, despite the purpose of the website as a tool for educational outreach and dissemination of science. Please support a free and uncensored Internet!
Inside a Blender
[original media no longer available]
High-speed video visualizes the complicated flow field inside a blender. Note that the video is placed in reverse for artistic effect. This flowfield is clearly too turbulent for reversible flow. That said, it is possible to mix two fluids and then unmix them, under the right circumstances.

Separation and Stall
This flow visualization of a pitching wind turbine blade demonstrates why lift and drag can change so drastically with angle of attack. When the angle the blade makes with the freestream is small, flow stays attached around the top and bottom surfaces of the blade. At large (positive or negative) angles of attack, the flow separates from the turbine blade, beginning at the trailing edge and moving forward as the angle of attack increases. The separated flow appears as a region of recirculation and turbulence. This is the same mechanism responsible for stall in aircraft. (Submitted by Bobby E)

Pitching Plate Flow Viz
This photograph uses fluorescent dye to visualize the wake behind a rigid flat plate pitching about its leading edge. A vortex is shed from the plate twice in each cycle of oscillation. These vortices entangle, producing the structured wake above. The top photo shows a side view of the wake, the bottom photo is a top view. (Photo credit: J. Buchholz and A. Smits)
Wingtip Vortices in Ground Effect
[original media no longer available]
If you’ve ever watched airplane contrails fade, you’ve probably observed the Crow instability, which causes the trailing wingtip vortices of the plane to interact and distort. The same effect is explored in the video above with the addition of ground effect. The first clip shows a pair of counter-rotating vortices from the side, showing a periodic pattern of thickening and thinning along the vortices. The second clip shows cross-sectional slices of the vortices at a thin and a thick point.

Transition to Turbulence
Smoke introduced into the boundary layer of a cone rotating in a stream highlights the transition from laminar to turbulent flow. On the left side of the picture, the boundary layer is uniform and steady, i.e. laminar, until environmental disturbances cause the formation of spiral vortices. These vortices remain stable until further growing disturbances cause them to develop a lacy structure, which soon breaks down into fully turbulent flow. Understanding the underlying physics of these disturbances and their growth is part of the field of stability and transition in fluid mechanics. (Photo credit: R. Kobayashi, Y. Kohama, and M. Kurosawa; taken from Van Dyke’s An Album of Fluid Motion)
Visualizing Fish Wakes
This novel flow visualization technique uses dilute solutions of the tobacco mosaic virus (TMV). These rod-shaped particles align with shear and produce a birefringent interference pattern visible when viewed between crossed polarizing filters. The intensity of the light is related to the magnitude of shear. The technique is benign to the fish but enables researchers to see fluid motion around fish that other techniques cannot capture. #