This image shows oil-flow visualization of a cylindrical roughness element on a flat plate in supersonic flow. The flow direction is from left to right. In this technique, a thin layer of high-viscosity oil is painted over the surface and dusted with green fluorescent powder. Once the supersonic tunnel is started, the model gets injected in the flow for a few seconds, then retracted. After the run, ultraviolet lighting illuminates the fluorescent powder, allowing researchers to see how air flowed over the surface. Image (a) shows the flat plate without roughness; there is relatively little variation in the oil distribution. Image (b) includes a 1-mm high, 4-mm wide cylinder. Note bow-shaped disruption upstream of the roughness and the lines of alternating light and dark areas that wrap around the roughness and stretch downstream. These lines form where oil has been moved from one region and concentrated in another, usually due to vortices in the roughness wake. Image © shows the same behavior amplified yet further by the 4-mm high, 4-mm wide cylinder that sticks up well beyond the edge of the boundary layer. Such images, combined with other methods of flow visualization, help scientists piece together the structures that form due to surface roughness and how these affect downstream flow on vehicles like the Orion capsule during atmospheric re-entry. (Photo credit: P. Danehy et al./NASA Langley #)
Tag: flow visualization

Airborne Aerosols
This numerical simulation from NASA Goddard shows the motion of particulates in Earth’s atmosphere between August 2006 and April 2007. These aerosols come from various sources including smoke, soot, dust, and sea salt. As these fine particles move through atmosphere, they can have significant effects on weather as well as climate. For example, the particles serve as nucleation sites for the condensation and formation of rain drops. (Video credit: NASA Goddard SFC)
Stirring Faces
This video features simulation of the laminar flow around a plate plunging sinusoidally in a quiescent flow. As the plate moves up and down, it mixes the fluid around it. This is visualized in several ways, beginning with the vorticity. Clockwise and anti-clockwise vortices are shed by the edges of the plate as it moves. The flow is also visualized using particle trajectories, which are classified by their tendency to accumulate (attract) or lose (repel) particles. These trajectories are particularly intriguing to watch develop as they appear to show ornate faces and designs. (Video credit: S. L. Brunton and C. W. Rowley)

Fluorescing Shock Waves
Wind tunnel testing plays a major role in the planning of many space missions. Here a model of the Mars Sample Return Orbiter is tested at Mach 10 to determine the heat shield’s response to aerobraking off Mars’ atmosphere. The colors are the result of electron beam fluorescence, in which an electron gun is used to ionize molecules in the flow, which causes them to emit photons (light). The technique can be used for flow visualization–as in the case of the shock waves shown here–or to measure flow characteristics like density, temperature, and velocity. (Photo credit: Thierry Pot/DAFE/ONERA)
Supersonic Bubble Shock Waves
Supercomputing has been an enormous boon to fluid dynamics over the past few decades. Many problems, like the interaction between a supersonic shock wave and a bubble, are too complicated for analytical solutions and difficult to measure experimentally. Numerical simulation of the problem, combined with visualization of key variables, adds invaluable understanding. Here a shock wave strikes a helium bubble at Mach 3, and the subsequent interactions in terms of density and vorticity are shown. This situation is relevant to a number of applications, such as supersonic combustion and shockwave lithotripsy–a medical technique in which kidney stones are broken up inside the body using shock waves. After impact, an air jet forms and penetrates the center of the structure while the outer regions mix and form a persistent vortex ring. (Video credit: B. Hejazialhosseini et al.; via Physics Buzz)

Reader Question: Dry Rear Windshields in the Rain
Reader sheepnamedpig asks:
I was driving through the rain down the highway when I noticed something strange: though the rain was heavy enough to reduce visibility to a quarter mile, the rear windshield of my Corolla was bone dry except for the streams of water flowing off the roof. There was no wind so far as I could tell, but I had to slow down all the way to ~20-25 mph for rain to start falling on the rear windshield. Why is that?
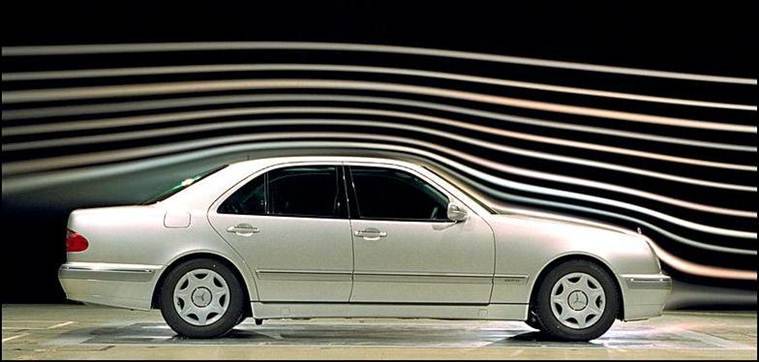
That’s a wonderful observation! Like many sedans, your Corolla has a long, sloped rear window that acts much like a backward-facing step with respect to the airflow while the car is moving. Note the smoke lines in the photo above. At the front of the car, we see closely spaced intact lines near the hood and windshield, indicating relatively fast, smooth airflow over the front of the vehicle. At the back, though, there is a big gap over the rear windshield. This is because flow over the car has separated at the rear windshield and a pocket of recirculating air. This recirculation zone is, for the most part, isolated from the rest of the air moving over the car; that’s why the smoke lines continue relatively unaffected a little ways above the surface. This same pocket of recirculating air is protecting your rear windshield from rainfall. It’s an area of low-speed, high-pressure fluid, and the raindrops are preferentially carried by the high-speed, low-pressure air over the recirculation zone. This is one reason why many sedans don’t have rear windshield wipers. (Photo credit: F-BDA)
ETA: Reposted by request to make it rebloggable.

Reader Question: How Useful is Flow Viz?
")


Reader Andrew asks:
I’ve noticed you’ve posted a bunch of flow visualization/wind tunnel content. I’m just curious where how useful information is obtained from these. Is it just observation? Or are there instruments that are usually used in conjunction with these techniques to provide data?
Great question, Andrew! The answer can vary based on the technique and application. In some cases, flow visualization is used for purely qualitative observation, but in others it can provide more quantifiable data. For example, the water tunnel flow visualization of Google’s heliostat array gave very qualitative data about flow around a given configuration but allowed quick evaluation of many configurations. Flow visualization can also help identify key features for additional study like vortices in a wake. This identification of structure can be so useful that even in computational fluid dynamics, where researchers have all possible information about pressure, temperature, and velocity in a flow field, flow visualization is regularly used to identify underlying structures.
Some flow visualization methods can also give very specific information. Oil-flow visualization gives a snapshot of shear stress at the surface of an object, letting an engineer identify at a glance areas of laminar and turbulent flow as well as regions with vortices and streaks. Naphthalene flow visualization and infrared thermography are both great for identifying the location of laminar-turbulent transition and can do so across the span of an object, which is much easier than trying to traverse a probe across the entire object. And some forms of flow visualization allow for extraction of velocity field information, as in particle image velocimetry. In this technique, tiny particles seed the flow and carefully timed image pairs are taken and correlated to determine the flow field velocity based on the changes in particle positions between images.
Like every measurement, flow visualization methods have their strengths and limitations. But for many applications, flow visualization provides much more than just pretty pictures and thus remains an important tool in any fluid dynamicist’s arsenal!

Supercomputed Fluids
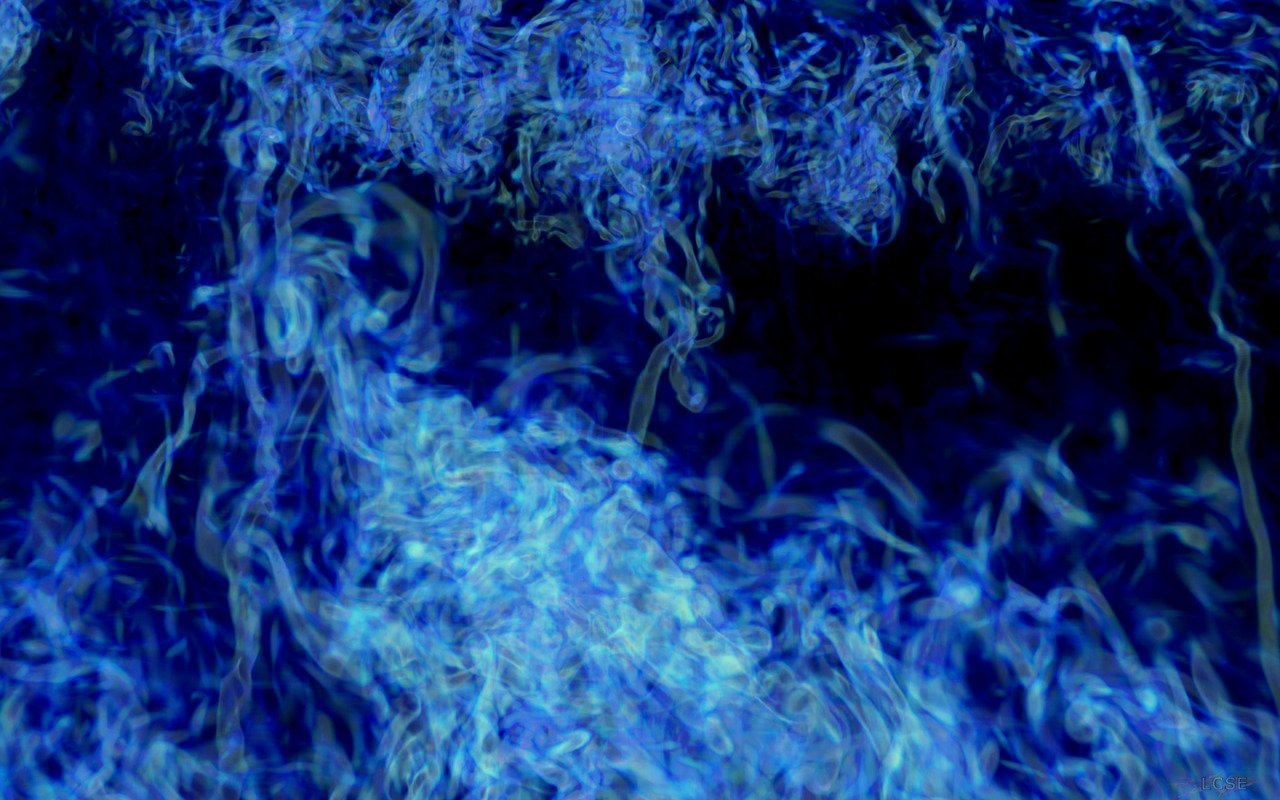

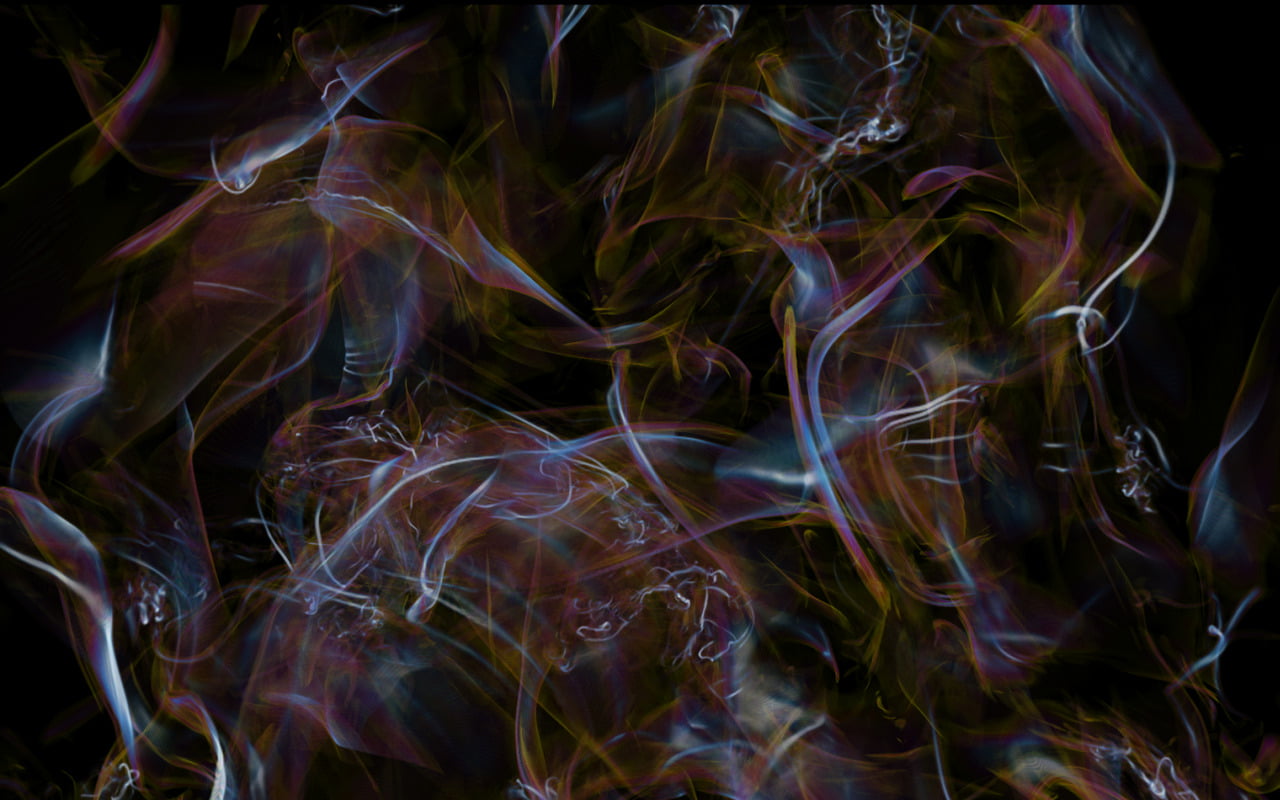
Computational fluid dynamics and supercomputers can produce some stunning flow visualizations. Above are examples of turbulence, the Rayleigh-Taylor instability, and the Kelvin-Helmholtz instability. Be sure to check out LCSE’s website for more; they’ve included wallpapers of some of the most spectacular ones. (Photo credits: Laboratory for Computational Science and Engineering, University of Minnesota, #)

The Backward-Facing Step
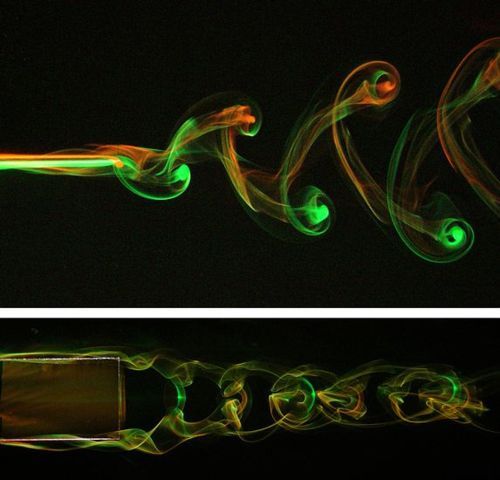
This photo collage shows vortices shed off a backward-facing step. The flow is left to right. Here the flow is visualized using dye released in water. Initially, the vortex forms near the bottom of the step in the recirculation zone. Because flow over the top of the vortex is much faster than the flow beneath the vortex, a low pressure zone forms over the vortex and gradually draws it up toward the top of the step. Eventually the vortex will rise to the point where the upstream flow pushes it downstream and the process begins anew. (Photo credit: Andrew Carter, University of Colorado)
Using Flow Viz for Optimization


Flow visualization is a powerful design tool for engineers. When Google was interested in determining optimal configurations for their heliostat array, they turned to NASA Ames’ water tunnel facility to test upstream barriers to deflect flow off the heliostats. In each photo, flow is from left to right and fluorescent dye is used to mark streamlines and reveal qualitative flow detail. Upstream of the obstacles, the streamlines are coherent and laminar, but after deflection, the flow breaks down into turbulence. In this case, such turbulence is desirable because it lowers the local fluid velocity and thus the aerodynamic loads experienced by each heliostat, potentially allowing for a savings in fabrication. For more, see Google’s report on the project. (Photo credits: google.org)