A simple cylinder in a steady flow creates a beautiful wake pattern known as a von Karman vortex street. The image above shows several examples of this pattern. Flow is from bottom to top, and the Reynolds number is increasing from left to right. In the experiment, this increasing Reynolds number corresponds to increasing the flow velocity because the cylinder size, fluid, and temperature were all fixed. As the Reynolds number first increases, the cylinder begins to shed vortices. The vortices alternate the side of the cylinder from which they are shed as well as alternating in their sense of rotation (clockwise or counterclockwise). Further increasing the Reynolds number increases the complexity of the wake, with more and more vortices being shed. The vortex street is a beautiful example of how fluid behavior is similar across a range of scales from the laboratory to our planet’s atmosphere. (Image credit: Z. Trávníček et. al)
Tag: flow visualization

Convective Impressionism


Buoyant convection, driven by temperature-dependent changes in density, is a major force here on Earth. It’s responsible for mixing in the oceans, governs the shape of flames, and drives weather patterns. The images above show flow patterns caused by buoyant convection. The colors come from liquid crystal beads immersed in the fluid; red indicates cooler fluid and blue indicates warmer fluid. You can see plumes of warmer fluid rising in some of the photos. At the same time, though, the images are beautiful simply as art and are strongly reminiscent of works by Vincent van Gogh. (Image credit: J. Zhang et al.)

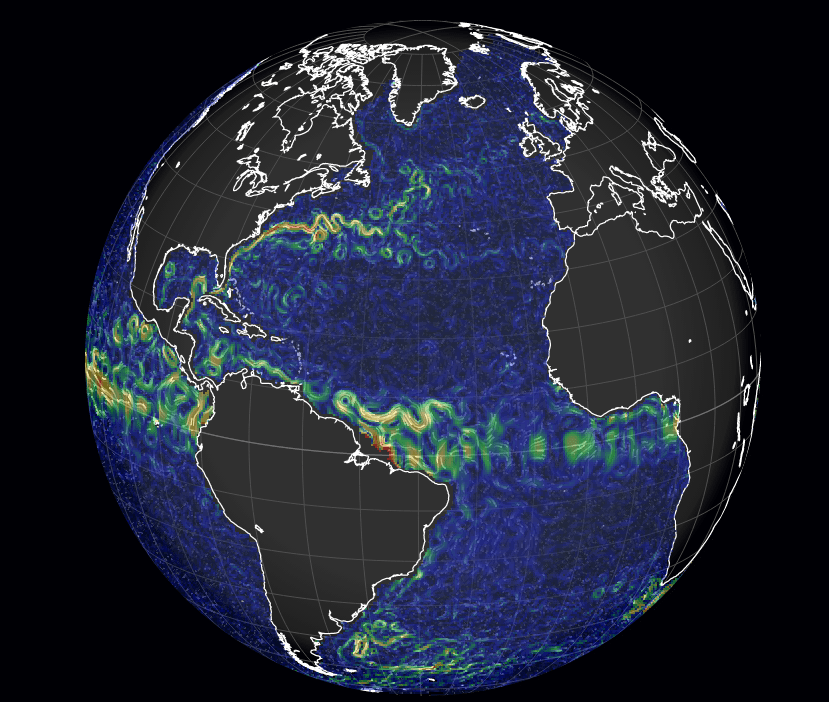
Wind and Waves Visualized

Much like the wind map we featured previously, designer Cameron Beccario’s visualizations of wind and ocean surface current data draw from near-real-time sources to create a stunning picture of fluid dynamics on a planetary scale. The number of options in terms of projections and data are really quite incredible, and you’ll want to play around to get a real sense for it. Want to see the wind and total precipitable water at 1000 hPa? Here you go. Maybe you prefer studying Pacific ocean currents. All the data are there to play with. People often wonder why weather forecasts aren’t always right, but, when you look at the scale and complexity of these flows, it’s almost a wonder that we can predict them at all. (Image credits:C. Beccario/earth; via skunkbear and io9)

The Structure of Turbulence
Though they may appear random at first glance, turbulent flows do possess structure. The video above shows a numerical simulation of a mixing layer, a flow in which two adjacent regions of fluid move with different velocities. The upper third of the frame shows a top view, and the bottom frame shows a side view, in which the upper fluid layer moves faster than the lower one. The difference in velocities creates shear which quickly drives the mixing layer into turbulence. But watch the chaos carefully, and your eye will pick out vortices rolling clockwise in the largest scales of the mixing layer. These features are known as coherent structures, and they are key to current efforts to understand and model turbulent flows. (Video credit: A. McMullan)
Measuring Wind Turbines with Snowfall
One of the challenges in large-scale wind energy is that operating wind turbines do not behave exactly as predicted by simulation or wind tunnel experiments. To determine where our models and small-scale experiments are lacking, it’s useful to make measurements using a full-scale working turbine, but making quantitative measurements in such a large-scale, uncontrolled environment is very difficult. Here researchers have used natural snowfall as seeding particles for flow visualization. The regular gaps in the flow are vortices shed from the tip of the passing turbine blades. With a searchlight illuminating a 36 m x 36 m slice of the flow behind a wind turbine, the engineers performed particle image velocimetry, obtaining velocity measurements in that region that could then be correlated to the wind turbine’s power output. Such in situ measurements will help researchers improve wind turbine performance. (Video credit: J. Hong et al.)

Impacting a Viscous Pool
Whenever a hollow cavity forms at the surface of a liquid, the cavity’s collapse generates a jet–a rising, high-speed column of liquid. The composite images above show snapshots of the process, from the moment of the cavity’s greatest depth to the peak of the jet. The top row of images shows water, and the bottom row contains a fluid 800 times more viscous than water. The added viscosity both smooths the geometry of the process and slows the jet down, yet strong similarities clearly remain. Focusing on similarities in fluid flows across a range of variables, like viscosity, is key to building mathematical models of fluid behavior. Once developed, these models can help predict behaviors for a wide range of flows without requiring extensive calculation or experimentation. (Image credit: E. Ghabache et al.)
The Inside of an Evaporating Drop
[original media no longer available]
Evaporating droplets may not look like much to the naked eye, but they contain complicated flow patterns. The type of pattern observed depends strongly on the contact line, the place where the liquid, solid, and air meet. When the contact line is pinned–kept unchanged–during evaporation, any particulates in the drop get pulled toward the edges as the drop evaporates. This is what leaves the classic coffee ring stain. It is also what is shown in the first clip in the video above. Contrast this with the second clip, in which the contact line is unpinned and varies irregularly as the drop evaporates. In the unpinned drop, particles are drawn inward during evaporation. The flow patterns are very different as well, complicated by swirling that is the result of force imbalances caused by the irregularly receding contact line. (Video credit: H. Kim)
Holiday Fluids: Santa’s Aerodynamics
Today we have some holiday-themed fluid dynamics: visualization of flow around Santa’s sleigh! This is a flowing soap film visualization at a low speed (author Nick Moore has some other speeds as well). Santa’s sleigh is what aerodynamicists call a bluff body–a shape that is not streamlined or aerodynamic–and sheds a complicated wake of vortices. Like any object moving through a fluid, Santa’s sleigh generates drag forces made up of several components. There is viscous drag, which comes from friction between the sleigh’s surface and the fluid, and form drag (or pressure drag), which comes from the shape of the sleigh. That wake full of complicated vortices significantly increases the sleigh’s pressure drag, requiring Rudolph and the other reindeer to provide more thrust to counter the sleigh’s drag. Speaking thereof, the visualization does not take into account the aerodynamics of the reindeer, who, in addition to providing the sleigh’s thrust, would also affect the flowfield upstream of the sleigh. This post is part of this week’s holiday-themed post series. (Video credit: N. Moore)

Shuttle Re-Entry
Complicated shock wave patterns envelope vehicles traveling at supersonic and hypersonic speeds. A shock wave is essentially a very tiny region–only a few mean free path lengths wide–over which flow conditions, including density, pressure, velocity, and temperature, change drastically. The image above shows a model of the Space Shuttle at a re-entry-like, high angle of attack at around Mach 20 in one of NASA Langley’s historic helium tunnels. The eerie glow outlining the shock structures around the model is a result of electron-beam fluorescence. In this flow visualization technique, a beam of high-energy electrons is swept over the model, causing the gas molecules to fluoresce according to temperature. (Photo credit: NASA Langley)

Bullet Through a Bubble
A bullet passes through a soap bubble in the schlieren photo above. The schlieren optical technique is sensitive to changes in the refractive index and, since a fluid’s refractive index changes with density, permits the visualization of shock waves. A strong curved bow shock is visible in front of the bullet as well as weaker lines marking additional shocks waves around the bullet. Impressively, the bullet’s passage is so fast (and the photo’s timing so perfect) that there are no imperfections or signs of bursting in the soap bubble. The photo’s caption suggests that the bubble may be filled with multiple gases. If they are unmixed and of differing densities, this may be the source of the speckling and plume-like structures inside the bubble. Incidentally, if anyone out there has high-speed schlieren video of a bullet passing through a soap bubble, I would love to see it. (Photo credit: H. Edgerton and K. Vandiver)