Tag: flow visualization

  • Instabilities on Instabilities

    Instabilities on Instabilities

    The world of fluid instabilities is a rich one. Combine fluids with differing viscosities, densities, or flow speeds and they’ll often break down in picturesque and predictable manners. Here, researchers explore the Rayleigh-Taylor instability (RTI), which occurs when a denser fluid sits above a less dense one (in a gravitational field). It’s an extremely common instability, showing up in both the cream in your ice coffee and the shape of a supernova’s explosion. It’s very difficult to set up and observe, though, which is where the real cleverness of this experiment stands out.

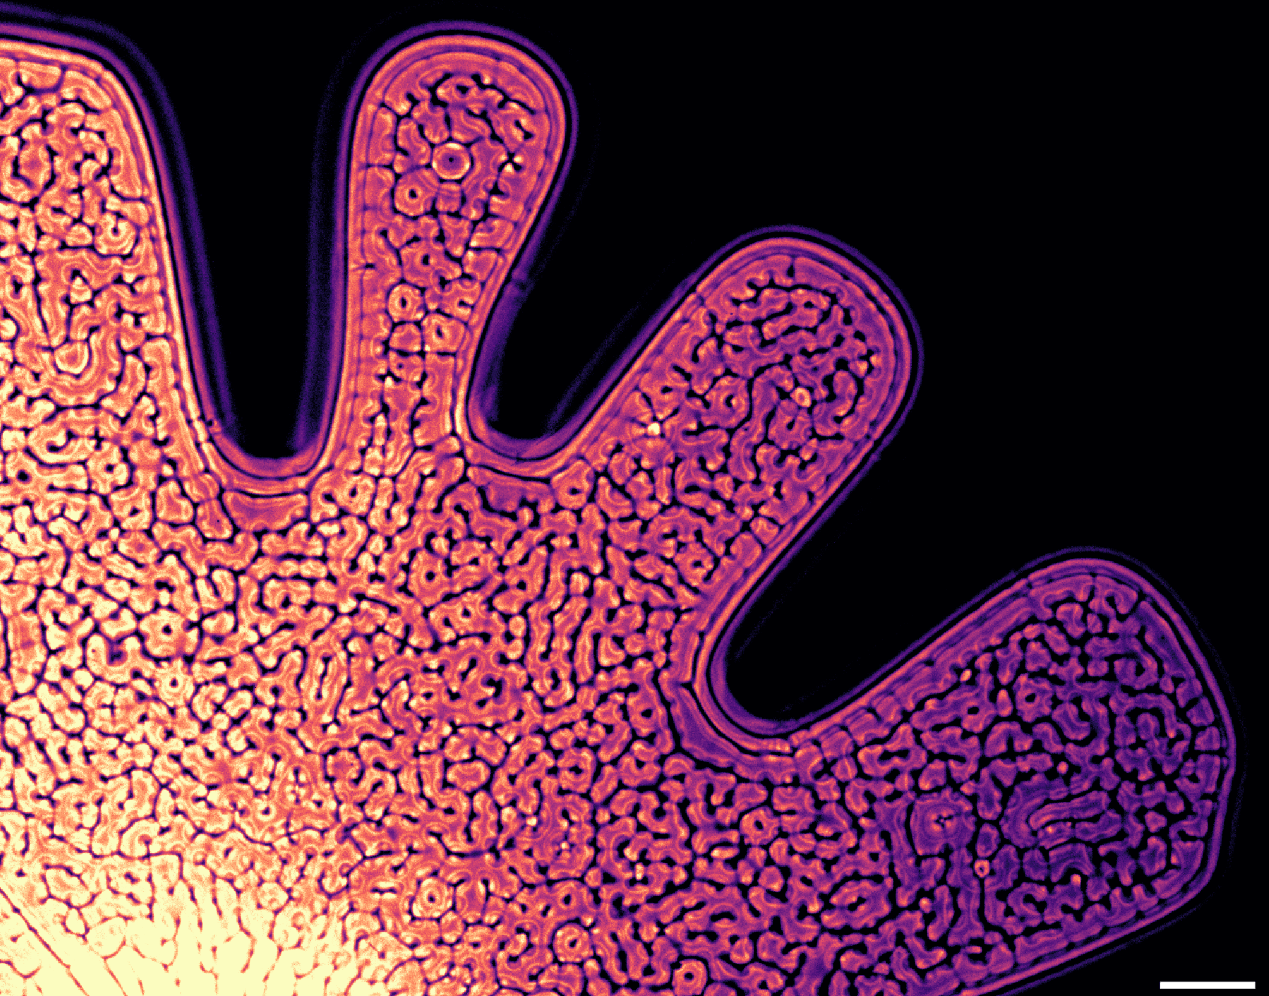
    To study the RTI, these researchers first created another instability, the Saffman-Taylor instability. They filled the space between two glass plates with a viscous fluid, then injected a less viscous one. That created the distinctive viscous fingering pattern seen in the top image. In addition to being less viscous, the injected fluid was also less dense. As it pushed into the original fluid, it displaced some of it, creating a three-layer structure with dense fluid over less-dense fluid over dense fluid. That laid the groundwork for the Rayleigh-Taylor instability form.

    A side-view through the fluid mixture shows the characteristic mushroom-like plume of the Rayleigh-Taylor instability.
    A side-view through the fluid mixture shows the characteristic mushroom-like plume of the Rayleigh-Taylor instability.

    Check out the cell-like pattern distributed across the fluid in the top image. These are plumes formed in the RTI as dense fluid sinks into the less-dense fluid below it. From the side (see second image), each plume takes on the distinctive mushroom-like shape of a Rayleigh-Taylor instability. Given time, the two fluids mix and the cellular pattern disappears. But until then, this set-up uses one instability to study a second one. How cool is that?! (Image and research credit: S. Alqatari et al., see also)

  • Featured Video Play Icon

    Surfactants and Waves

    In the ocean, waves often curl over and trap air, becoming plunging breakers. How do surfactants like soap or oil affect this process? That’s the question behind this video, where researchers visualize breaking waves with differing amounts of added surfactant. In the case of pure water, the wave forms a smooth jet that curls over and traps air when the wave breaks. As more and more surfactant gets added, the shape of that jet and cavity change. In one case, they become irregular. In another, they disappear entirely, and with the most surfactant added, the wave suddenly looks just like the water-only case.

    The key to these behaviors, it turns out, is not how much surfactant there is, but how much the concentration of surfactant varies along the length of the wave. When there are significant changes in the surfactant concentration along the wave, local Marangoni flows try to even out the surface tension, causing the wave to break up in an irregular fashion. (Image and video credit: M. Erinin et al.)

  • Sedimentation After Flooding

    Sedimentation After Flooding

    The new year brought California a series of atmospheric rivers that poured record amounts of water onto drought-stricken lands. While the precipitation refreshed snowpacks and reservoirs, much of it washed away as soils oversaturated. Those flows carried sediment with them, creating swirls of brown and green along the coastline.

    Compare the two satellite images above to see how different January 2022 looked from January 2023, post-deluge. The snow levels in January 2023 were about 248 percent of their average level for that part of the season. But the sediment levels in the ocean are also drastically increased, indicating high levels of erosion. (Image credit: J. Stevens; via NASA Earth Observatory)

  • Turning the Beach Pink

    Turning the Beach Pink

    Lab experiments and numerical simulations can only take us so far; sometimes there’s no substitute for getting out into the field. That’s why a beach in San Diego turned pink this January and February, as researchers released a safe, non-toxic dye into an estuary. The goal is to understand how small freshwater sources mix with colder, saltier ocean waters when they meet in the surf zone. Differences in temperature and salinity both affect the waters’ density and, therefore, how they’ll combine, especially in the face of the turbulent surf. Using drones, distributed sensors, and a specially-outfitted jet ski, the researchers collect data about how the dye (and therefore the estuary’s water) spreads over the 24 hours following each dye release. Check out their experiment’s site to learn more. (Image credits: E. Jepsen/A. Simpson/UC San Diego; via SFGate; submitted by Emily R.)

  • Beneath the Cavity

    Beneath the Cavity

    When a drop falls into a pool of liquid, it creates a distinctive cavity, followed by a jet. From above the surface, this process is well-studied. But this poster offers us a glimpse of what goes on beneath the surface, using particle image velocimetry. This technique follows the paths of tiny particles in the fluid to reveal how the fluid moves.

    As the cavity grows, fluid is pushed away. But the cavity’s reversal comes with a change in flow direction. The arrows now point toward the shrinking cavity — and they’re much larger, indicating a strong inward flow. It’s this convergence that creates the Worthington jet that rebounds from the surface. And, as the jet falls back, its momentum gets transferred into a vortex ring that drifts downward from the point of impact. (Image credit: R. Sharma et al.)

  • Mixing With E. Coli

    Mixing With E. Coli

    What happens when a flow meets swimming micro-organisms? Does the flow affect the swimmers? And how do the swimmers affect the flow in turn? Those are the questions behind the experiment seen here. The apparatus contains a thin layer of saline water with swimming E. coli. Electromagnetism is used to mix the fluid in an array-like pattern that triggers chaotic mixing. To visualize what’s going on, dye is introduced into the right half of the image, while the left half remains undyed.

    On the right side of the image, bright blue and white mark areas of high dye concentration, where strong mixing occurs. On the undyed left side of the image, pale blue streaks mark areas where E. coli are clustered. By comparing the two, we see that the micro-swimmers are clustered in the very same regions of flow marked by strong mixing. This result suggests strong interactions and the potential for feedback between the mixing flow and the swimmers. (Image and research credit: R. Ran et al.; see also 1 and 2)

  • Featured Video Play Icon

    “Turbulence”

    In his recent short film, artist Roman De Giuli explores turbulence using metallic paints and inks in a fishtank. The effects are beautiful: sparkling pigments dispersing in clouds, mushroom- and umbrella-shaped Rayleigh-Taylor instabilities, and lots of swirling eddies. It’s exactly the kind of eyecandy to kick off your weekend with! (Image and video credit: R. De Giuli)

  • Featured Video Play Icon

    Spinning Liquids With Lego

    One way to explore the effects of spinning liquids at high-speeds is to build an expensive and precise lab apparatus. Another method is to raid the Lego bin. Here, a YouTuber builds ever-more-elaborate Lego constructions to spin a sphere of water. He begins with a relatively straightforward magnetic stirrer that creates a bathtub vortex in his sphere, but as the set-up grows, he eventually encases the sphere to spin the entire thing at high-speed. It’s a cool way to see how spinning liquids react, from forming a vortex to spin coating the interior of the sphere and to generating a parabolic interface between air and liquid. Set-ups like these are not merely for fun, though; scientists use them to simulate the interiors of planets. (Image and video credit: Brick Technology; submitted by clogwog)

  • Featured Video Play Icon

    “Iridescent”

    Soft colors and sudden coalescence combine in this short film from Susi Sie’s team. The visuals rely on liquid lenses (likely oil) floating atop a water bath. You can see how the fluids get manipulated in their behind-the-scenes video, which also provides a peek at how the sound effects get made. (Video credit: S. Sie et al.)

  • Toilet Plumes

    Toilet Plumes

    Toilet flushes are gross. We’ve seen it before, though not in the same detail as this study. Here, researchers illuminate the spray from the flush of a typical commercial toilet, like those found in many public restrooms. They found that flushing generates a plume of droplets that reaches 1.5 meters in under 8 seconds, producing many thousands of droplets across a range of sizes.

    The experiments were conducted in a ventilated lab space, and the flushes involved only clean water — no fecal matter or toilet paper — so they don’t perfectly mimic the confines of a public toilet stall. But the implications are still pretty gross. Without a lid to contain the flush’s spray, these energetic toilets are spraying droplets capable of carrying COVID, influenza, and other nastiness all over our bathrooms. (Image and research credit: J. Crimaldi et al.; via Gizmodo)