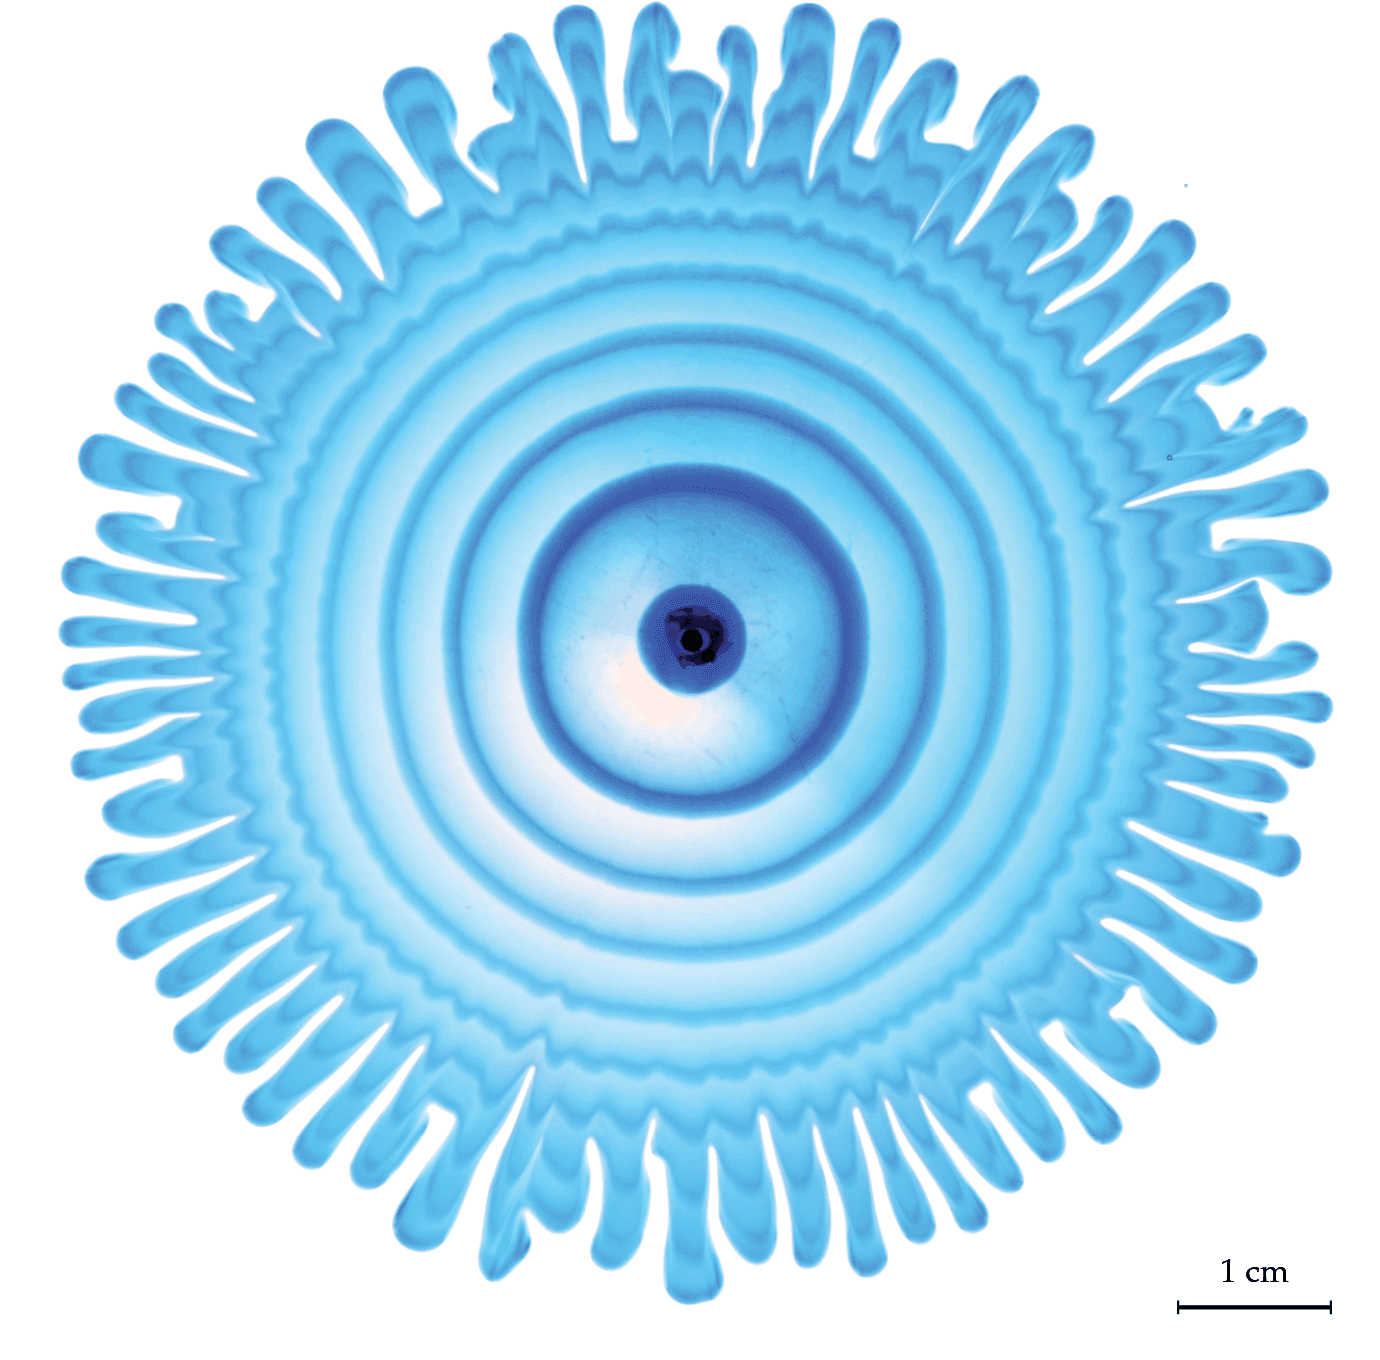
Nature is full of branching patterns: trees, lighting, rivers, and more. In fluid dynamics, our prototypical branching pattern is the Saffman-Taylor instability, created when a less viscous fluid is injected into a more viscous one in an confined space. Most attention in this problem has gone to the branching interface where the two fluids meet, but recently, a team has examined the flow away from the fingers by alternately injecting dyed and undyed fluid to visualize what goes on. That’s what we see here. Notice how the central dye rings, far from the branching fingers, still appear circular. Yet, even a few centimeters away from the fingers, the dye is starting to show ripples that correspond to the fingers. That’s an indication that the pressure gradient generated at the tips of the fingers is pretty far-reaching! (Image and research credit: S. Gowen et al.)
Tag: flow visualization

The Mystery of the Binary Droplet


What goes on inside an evaporating droplet made up of more than one fluid? This is a perennially fascinating question with lots of permutations. In this one, researchers observed water-poor spots forming around the edges of an evaporating drop, almost as if the two chemicals within the drop are physically separating from one another (scientifically speaking, “undergoing phase separation“). To find out if this was really the case, they put particles into the drop and observed their behavior as the drop evaporated. What they found is that this is a flow behavior, not a phase one. The high concentration of hexanediol near the edge of the drop changes the value of surface tension between the center and edge of the drop. And that change is non-monotonic, meaning that there’s a minimum in the surface tension partway along the drop’s radius. That surface tension minimum is what creates the separated regions of flow. (Video and image credit: P. Dekker et al.; research pre-print: C. Diddens et al.)
Within a Drop
In this macro video, various chemical reactions swirl inside a single dangling droplet. Despite its tiny size, quite a lot can go on in a drop like this. Both the injection of chemicals and the chemical reactions themselves can cause the flows we see here. Surface tension variations and capillary waves on the exterior of the drop can play a role, too. Just because a flow is tiny doesn’t mean it’s simple. (Video and image credit: B. Pleyer; via Nikon Small World in Motion)

Chemical reactions swirl within a single, hanging droplet. Fediverse Reactions
-

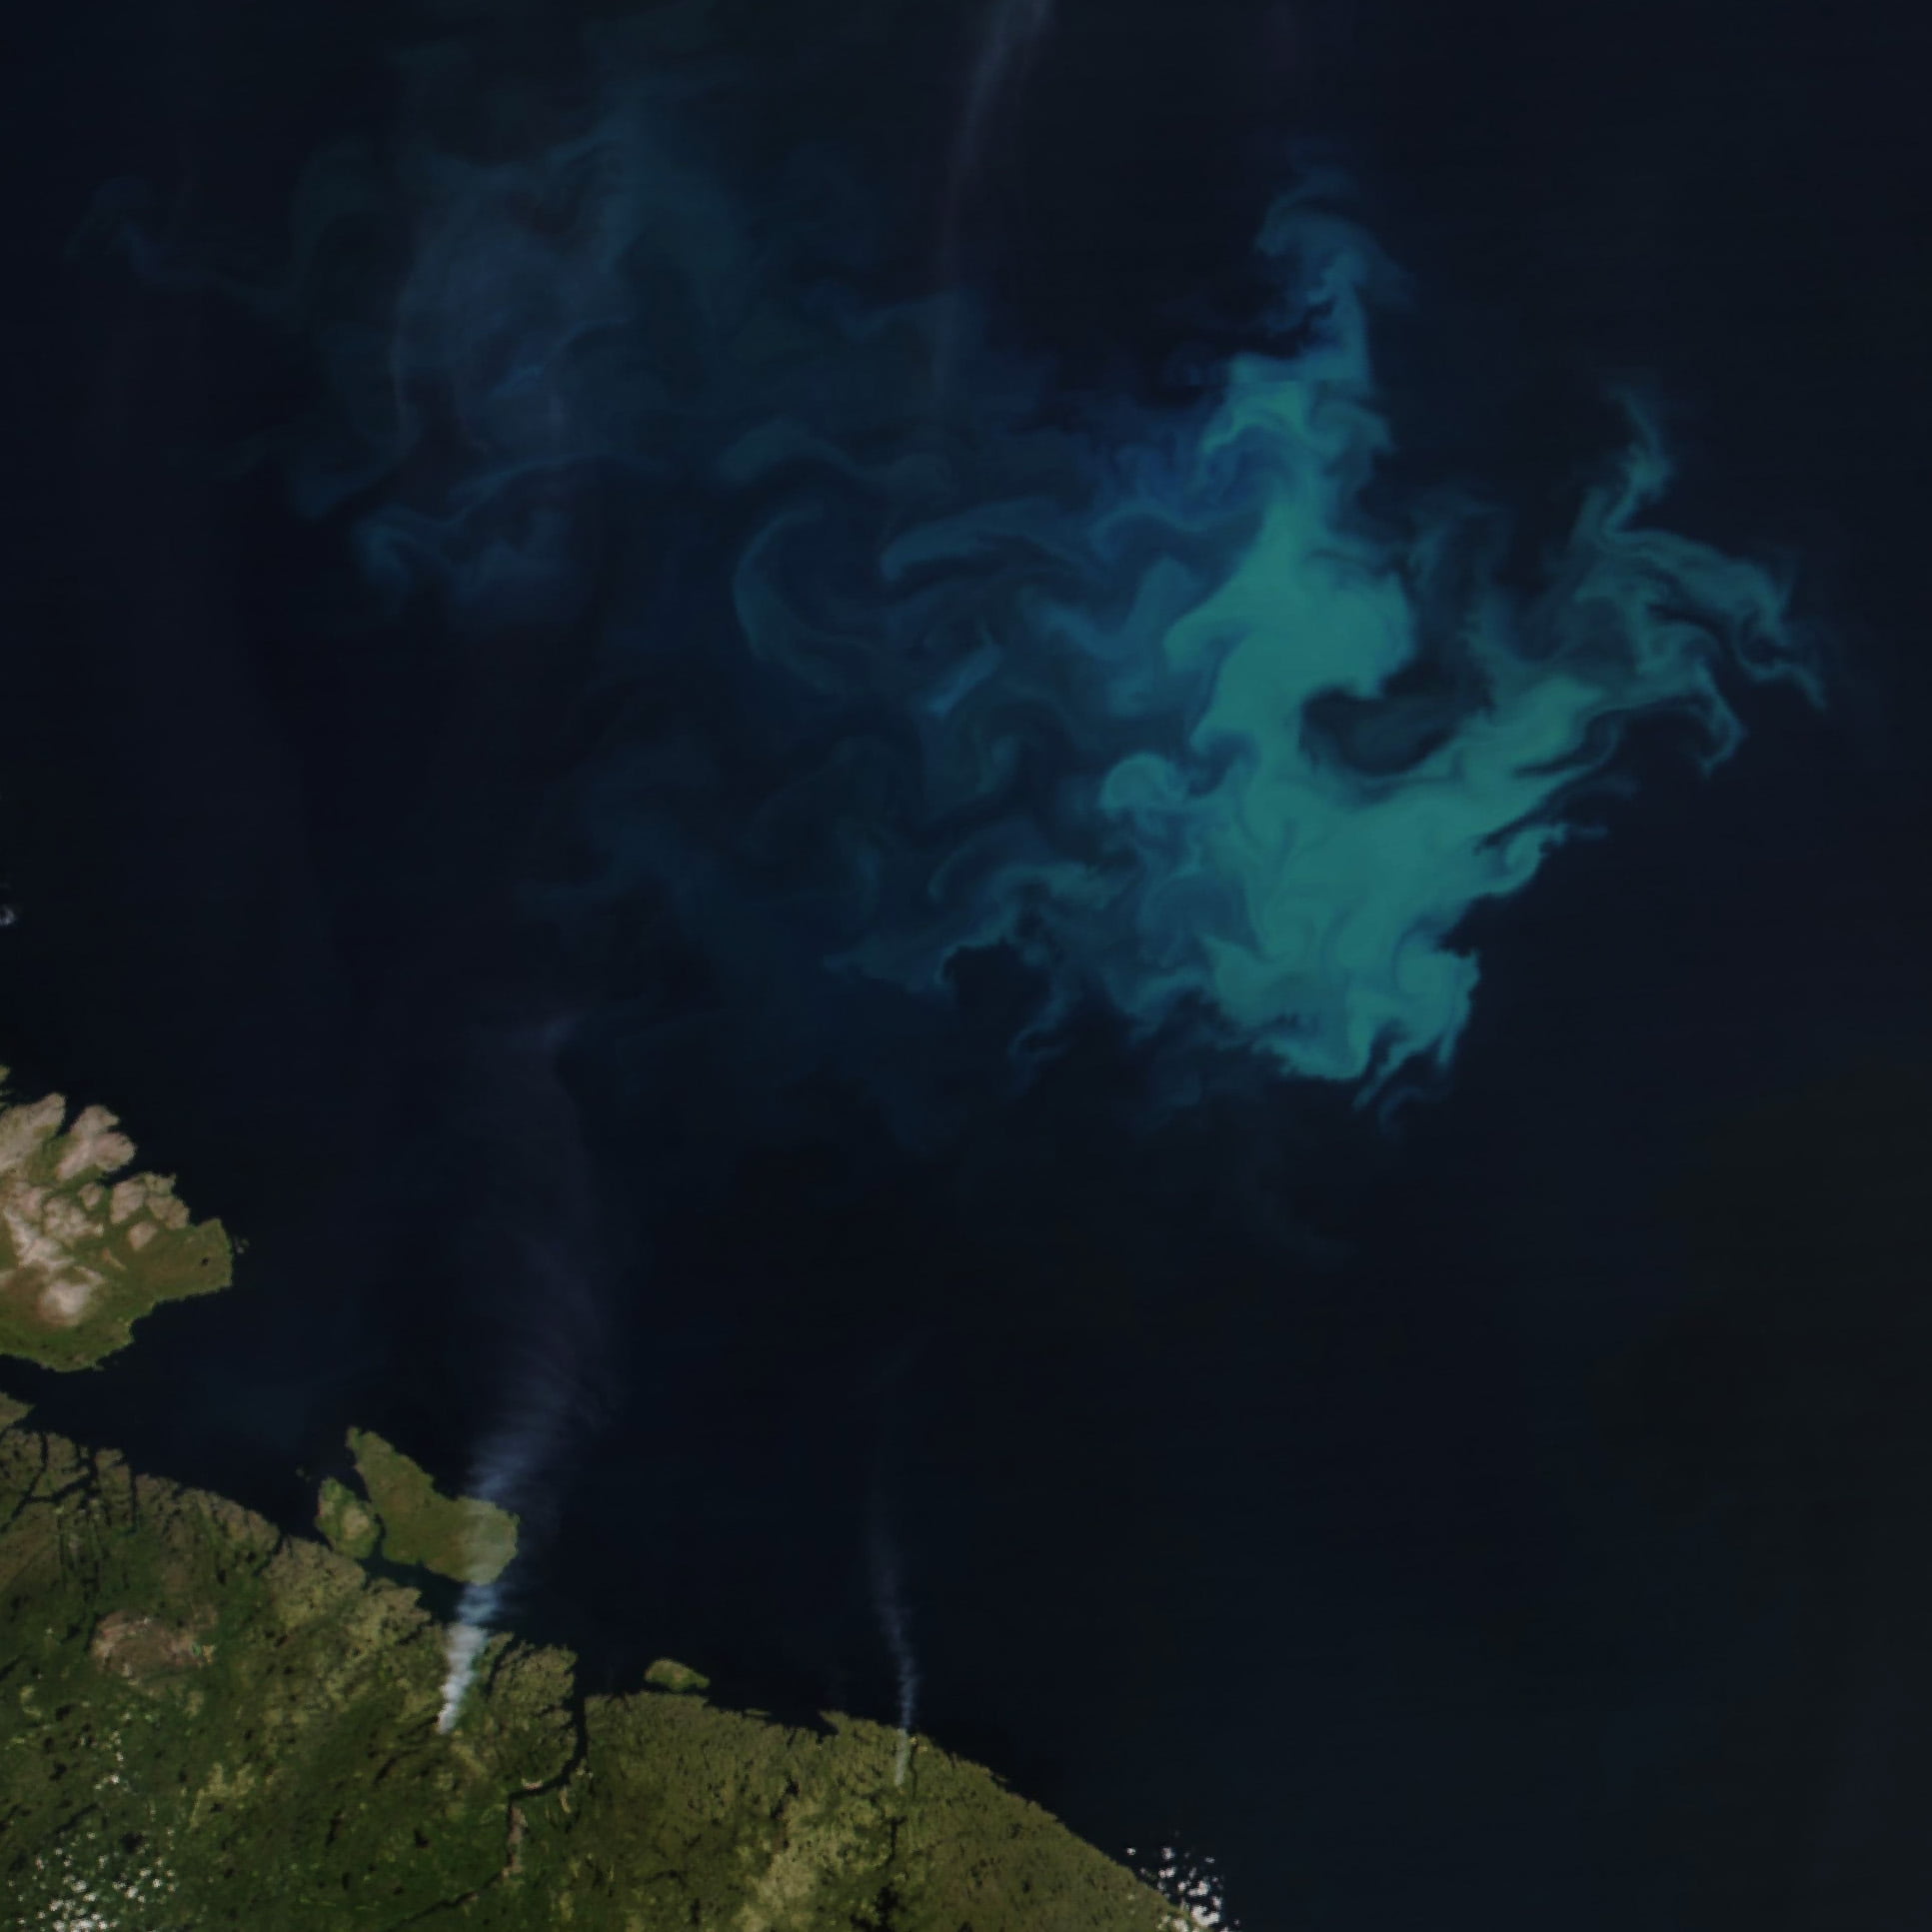
Blooming in Blue
Summers in the Barents Sea — a shallow region off the northern coasts of Norway and Russia — trigger phytoplankton blooms like the one in this satellite image. The blue shade of the bloom suggests the work of coccolithophores, a type of plankton armored in white calcium carbonate. This type of plankton thrives in the warm, stratified waters of the late summer. Earlier in the year, the water tends to be nutrient-rich and well-mixed, conditions which favor diatom plankton species instead. Their blooms appear greener in satellite images. (Image credit: W. Liang; via NASA Earth Observatory)
Fediverse Reactions
-

Strata of Starlings


Starlings come together in groups of up to thousands of birds for the protection of numbers. These flocks form spellbinding, undulating masses known as murmurations, where the movement of individual starlings sends waves spreading from neighbor to neighbor through the group. One bird’s effort to dodge a hawk triggers a giant, spreading ripple in the flock.
To capture the flowing nature of the murmuration, photographer and scientist Kathryn Cooper layers multiple images of the starlings atop one another. The birds themselves become pathlines marking the murmuration’s motion. The final images are surprisingly varied in form. Some flocks resemble a downpour of rain; others the dangling branches of a tree. (Image credit: K. Cooper; via Colossal)
Fediverse Reactions
-

The Best of FYFD 2024


Welcome to another year and another look back at FYFD’s most popular posts. (You can find previous editions, too, for 2023, 2022, 2021, 2020, 2019, 2018, 2017, 2016, 2015, and 2014. Whew, that’s a lot!) Here are some of 2024’s most popular topics:
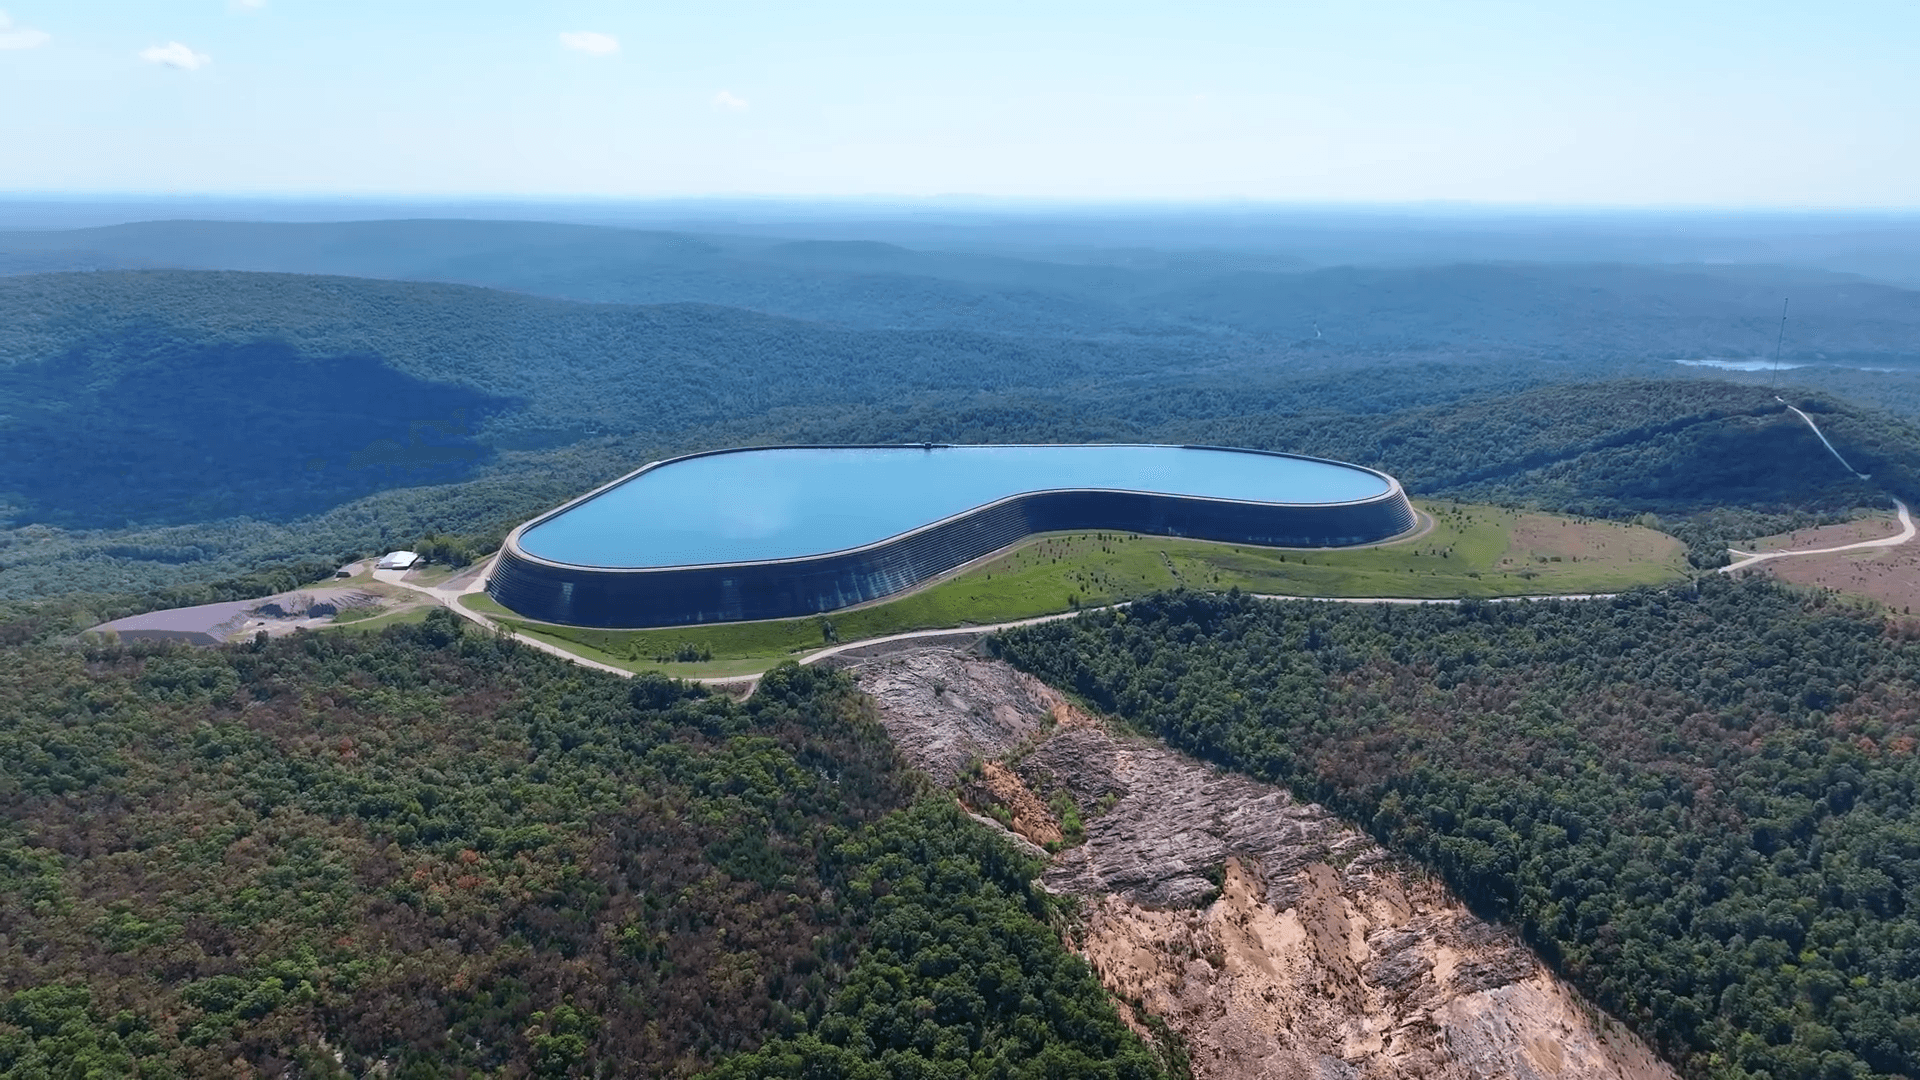
- The Taum Sauk Dam Failure and Its Legacy
- Stretching Ant Rafts
- Gigapixel Supernova
- Feynman’s Sprinkler Solved
- Calming the Waves
- “Dew Point” Deposits Droplets
- Drying Unaffected by Humidity
- Trapped in a Taylor Column
- Exciting a Flame in a Trough
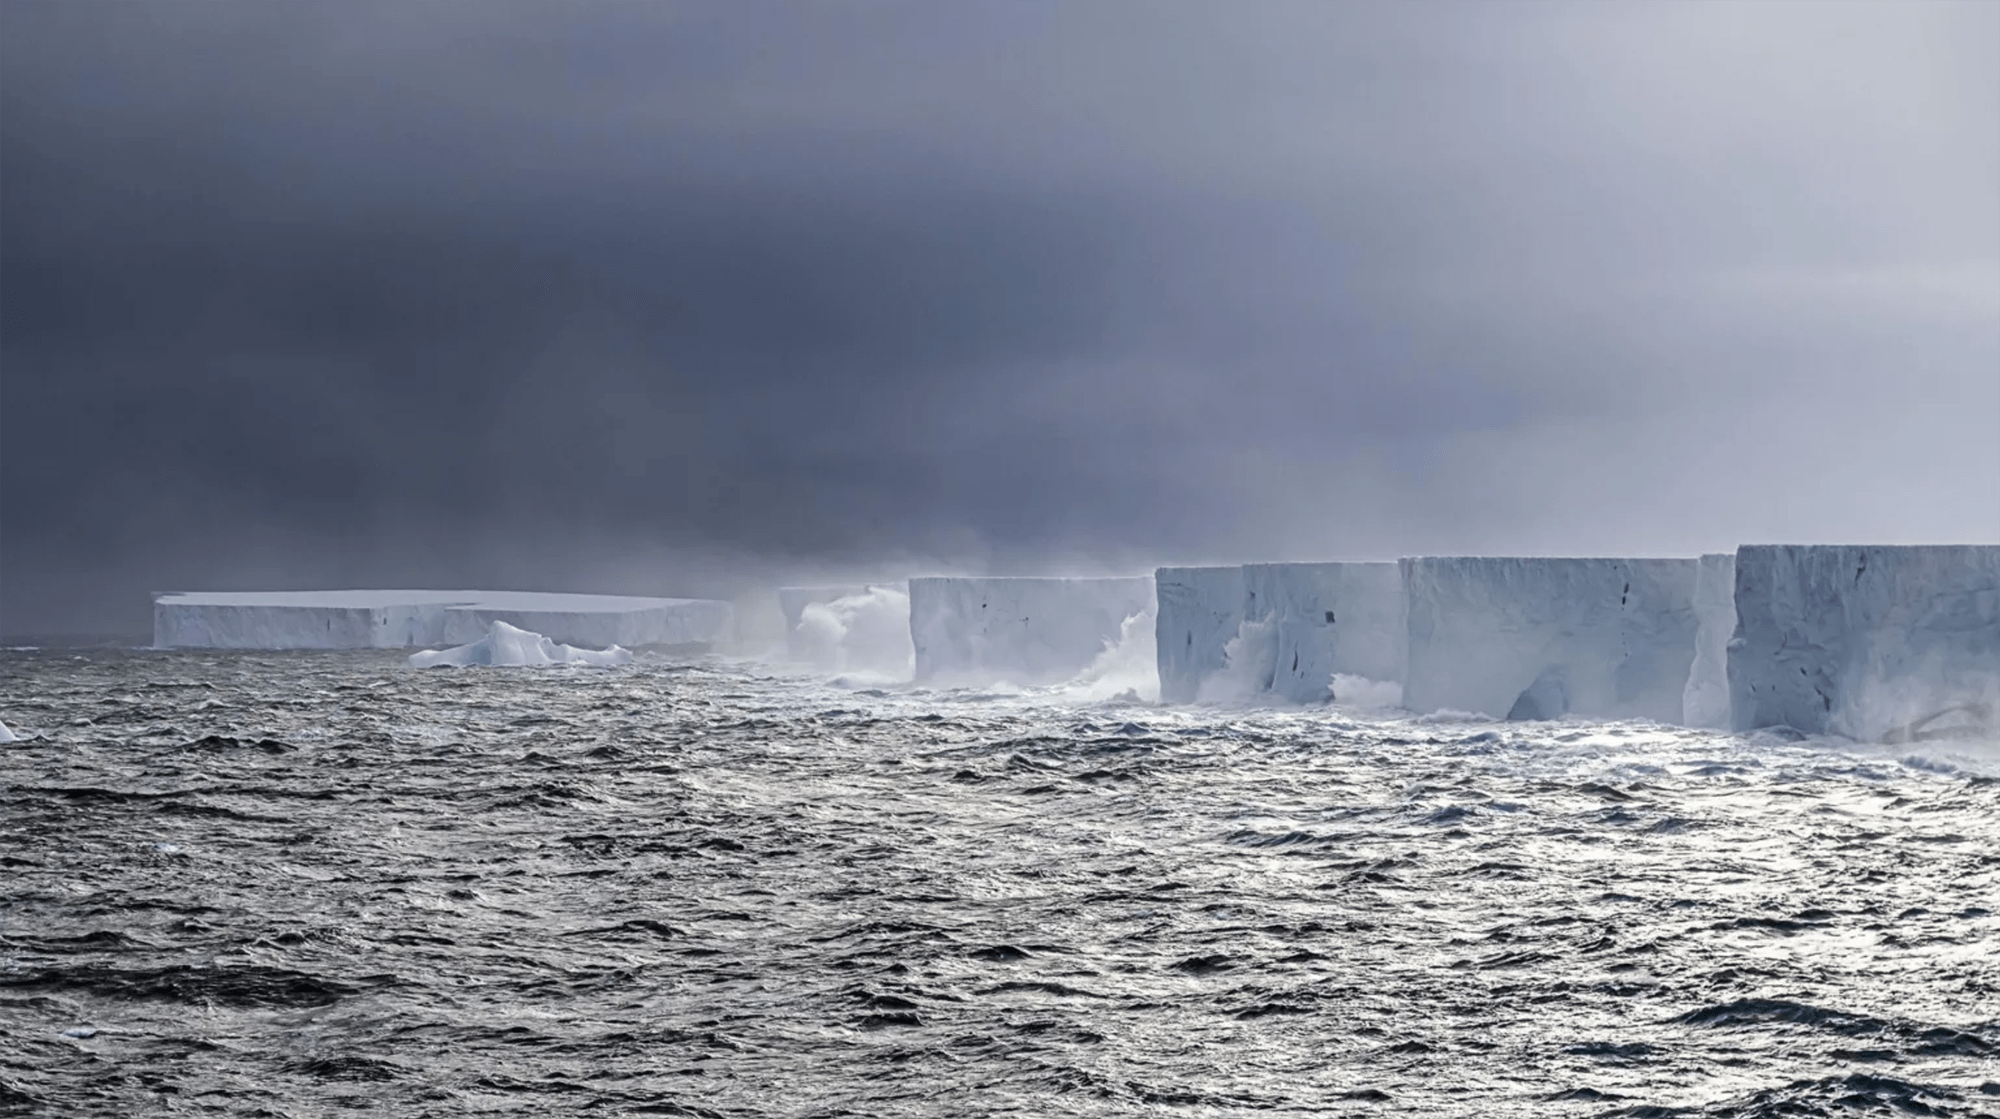
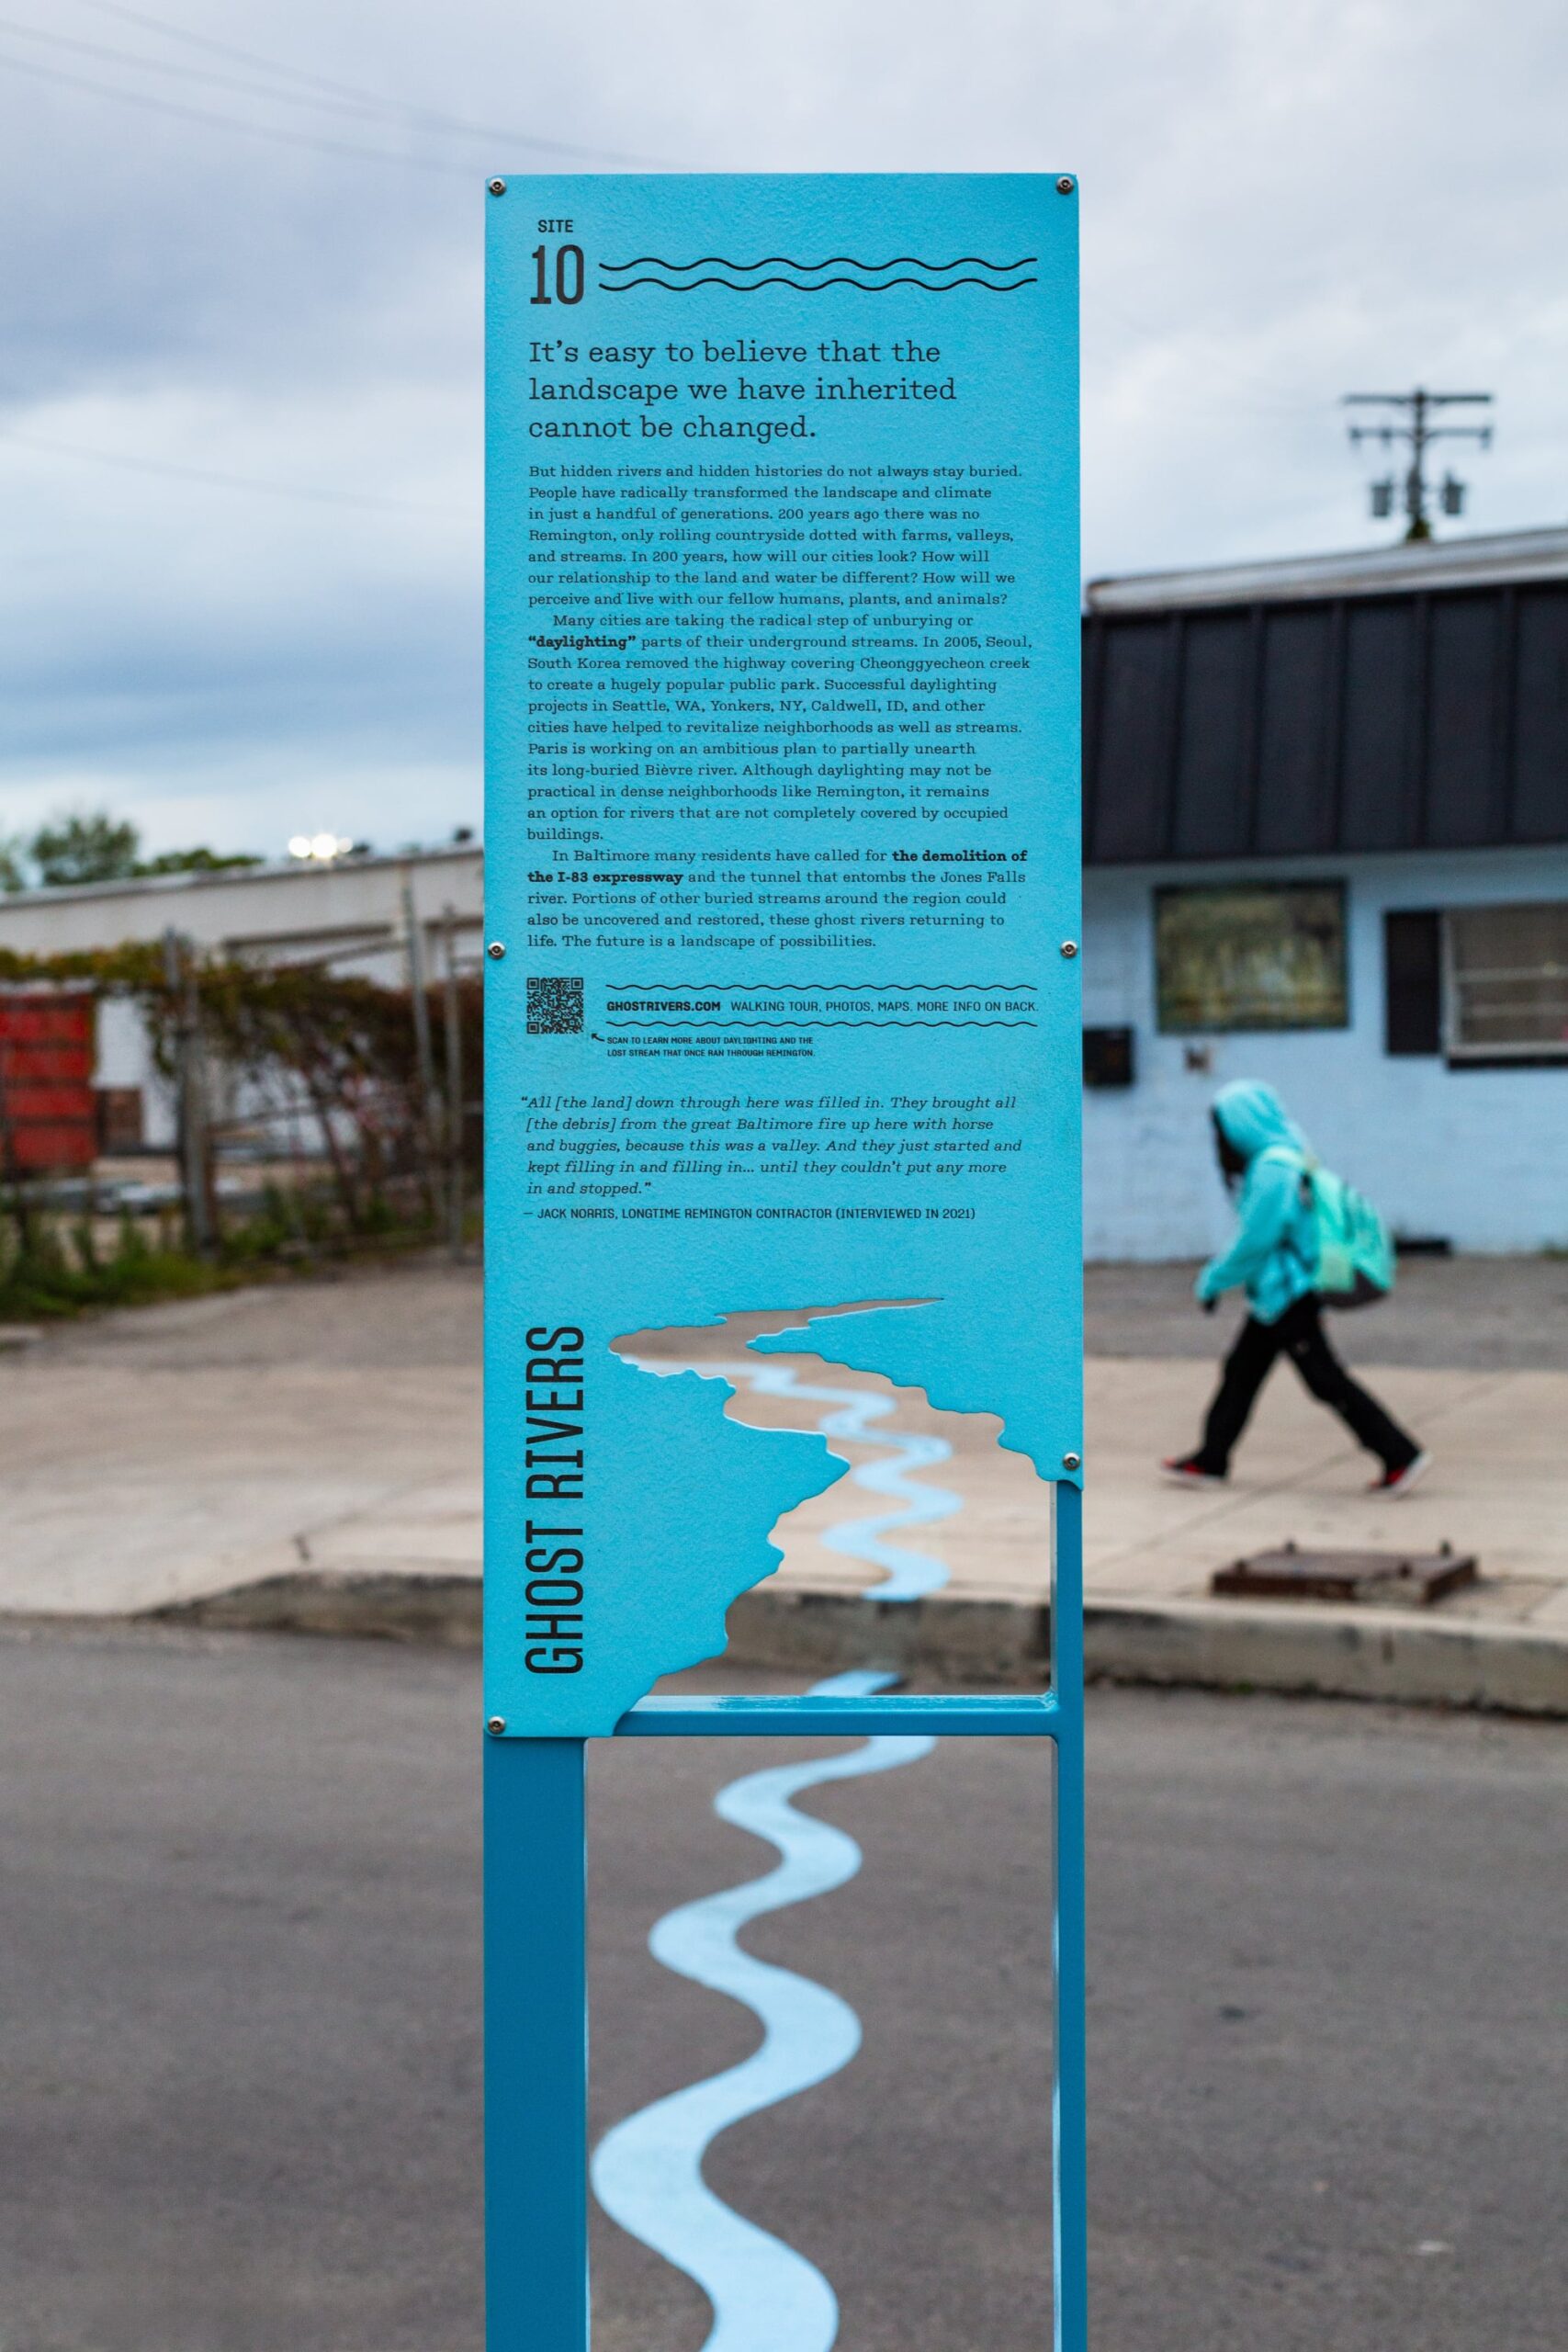
- Remembering Rivers Past
- A Comet’s Tail
- Light Pillars
- Liquid Metal Printing
- The Miscible Faraday Instability
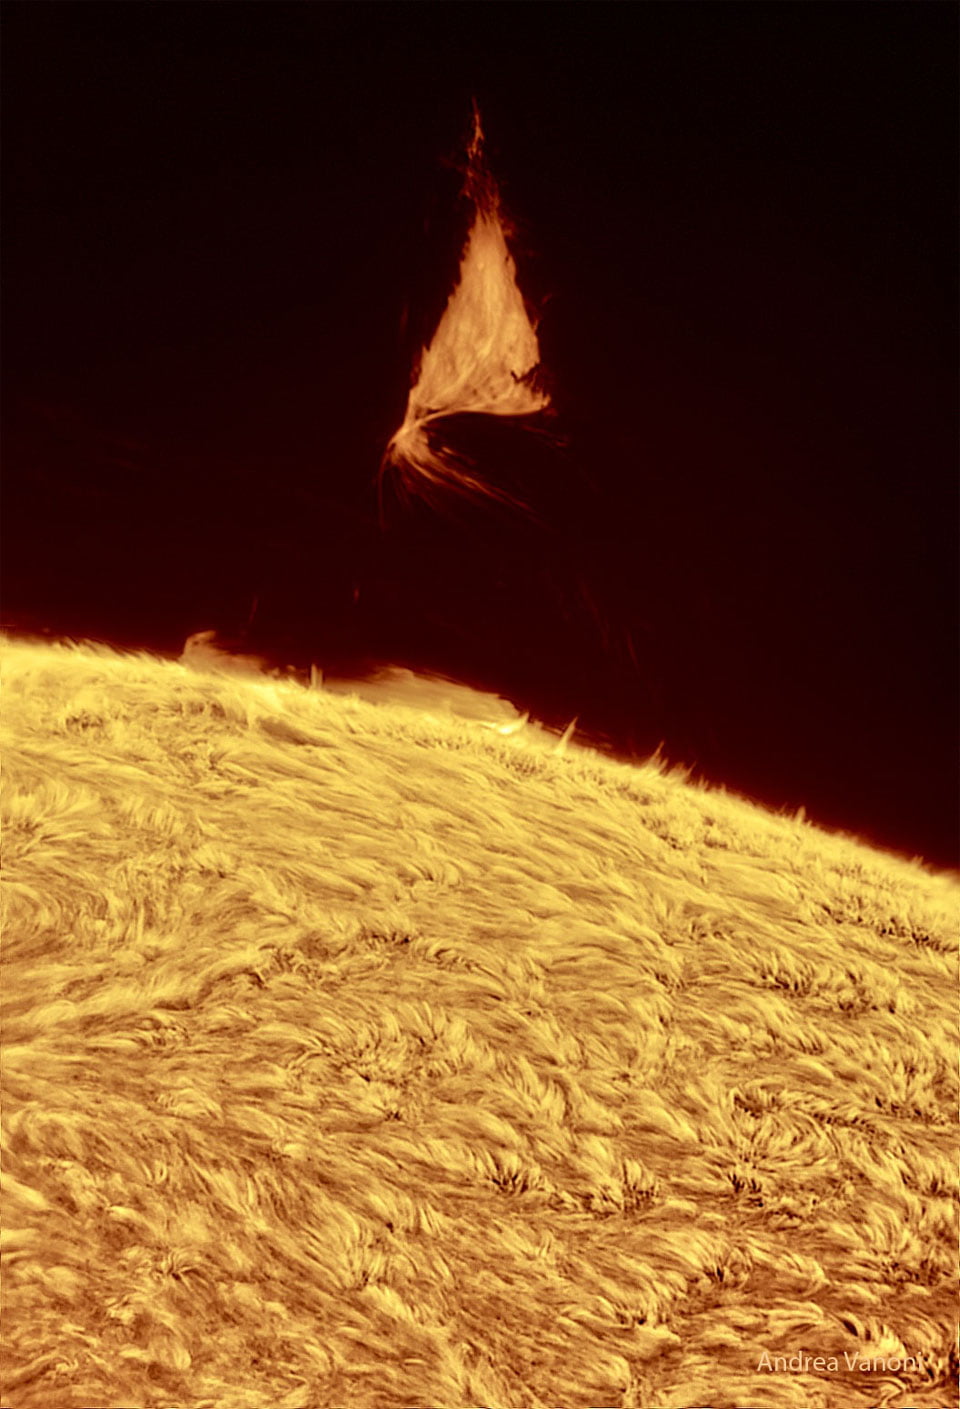
- A Triangular Prominence
This year’s topics are a good mix: fundamental research, civil engineering applications, geophysics, astrophysics, art, and one good old-fashioned brain teaser. Interested in what 2025 will hold? There are lots of ways to follow along so that you don’t miss a post.
And if you enjoy FYFD, please remember that it’s a reader-supported website. I don’t run ads, and it’s been years since my last sponsored post. You can help support the site by becoming a patron, buying some merch, or simply by sharing on social media. And if you find yourself struggling to remember to check the website, remember you can get FYFD in your inbox every two weeks with our newsletter. Happy New Year!
(Image credits: dam – Practical Engineering, ants – C. Chen et al., supernova – NOIRLab, sprinkler – K. Wang et al., wave tank – L-P. Euvé et al., “Dew Point” – L. Clark, paint – M. Huisman et al., iceberg – D. Fox, flame trough – S. Mould, sign – B. Willen, comet – S. Li, light pillars – N. Liao, chair – MIT News, Faraday instability – G. Louis et al., prominence – A. Vanoni)
Fediverse Reactions

Active Cheerios Self-Propel
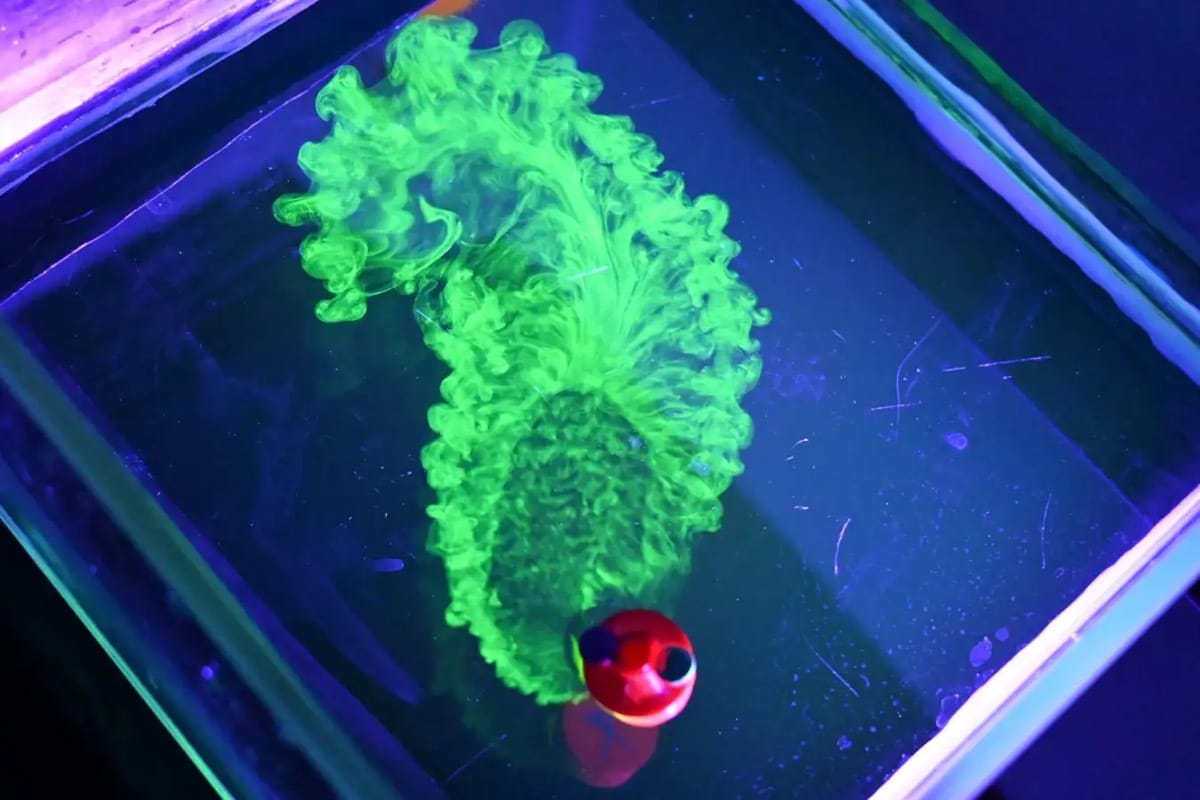
The interface where air and water meet is a special world of surface-tension-mediated interactions. Cereal lovers are well-aware of the Cheerios effect, where lightweight O’s tend to attract one another, courtesy of their matching menisci. And those who have played with soap boats know that a gradient in surface tension causes flow. Today’s pre-print study combines these two effects to create self-propelling particle assemblies.
The team 3D-printed particles that are a couple centimeters across and resemble a cone stuck atop a hockey puck. The lower disk area is hollow, trapping air to make the particle buoyant. The cone serves as a fuel tank, which the researchers filled with ethanol (and, in some cases, some fluorescent dye to visualize the flow). Like soap, ethanol’s lower surface tension disrupts the water’s interface and triggers a flow that pulls the particle toward areas with higher surface tension. But, unlike soap, ethanol evaporates, effectively restoring the interface’s higher surface tension over time.
With multiple self-propelling particles on the interface, the researchers observed a rich series of interactions. Without their fuel, the Cheerios effect attracted particles to each other. But with ethanol slowly leaking out their sides, the particles repelled each other. As the ethanol ran out and evaporated, the particles would again attract. By tweaking the number and position of fuel outlets on a particle, the researchers found they could tune the particles’ attractions and motility. In addition to helping robots move and organize, their findings also make for a fun educational project. There’s a lot of room for students to play with different 3D-printed designs and fuel concentrations to make their own self-propelled particles. (Research and image credit: J. Wilt et al.; via Ars Technica)
Fediverse Reactions
-

Inside the Squirting Cucumber
Though only 5 cm long, the squirting cucumber can spray its seeds up to 10 meters away. The little fruit does so through a clever combination of preparation and ballistic maneuvers. Ahead of launch, the plant actually moves water from the fruit into the stem; this reorients the cucumber so that its long axis sits close to 45 degrees. It also makes the stem thicker and stiffer.

This high-speed video shows the explosive release of the squirting cucumber’s seeds. When the burst happens, fruit spews out a jet of mucus that propels the seeds at up to 20 m/s. The initial seeds move the fastest — thanks to the fruit’s high-pressure reservoir — and fly the furthest. As the pressure drops, the jet slows and the fruit’s rotation sends the seeds higher, causing them to land closer to the original plant. With multiple fruits in different orientations, a single plant can spread its seeds in a fairly even ring around itself. (Research and image credit: F. Box et al.; via Gizmodo)
Fediverse Reactions
-

A Mini Jupiter
Astronaut Don Pettit posted this image of a Jupiter-like water globe he created on the International Space Station. In microgravity, surface tension reigns as the water’s supreme force, pulling the mixture of water and food coloring into a perfect sphere. It will be interesting to see a video version of this experiment, so that we can tell what tools Pettit used to swirl the droplet into the eddies we see. Is the full droplet rotating (as a planet would), or are we just seeing the remains of a wire passed through the drop? We’ll have to stay tuned to Pettit’s experiments to find out. (Image credit: NASA/D. Pettit; via space.com; submitted by J. Shoer)
Fediverse Reactions
-

Predicting Droplet Sizes
Squeeze a bottle of cleaning spray, and the nozzle transforms a liquid jet into a spray of droplets. These droplets come in many sizes, and predicting them is difficult because the droplets’ size distribution depends on the details of how their parent liquid broke up. Shown above is a simplified experimental version of this, beginning with a jet of air striking a spherical water droplet on the far left. In less than 3 milliseconds, the droplet has flattened into a pancake shape. In another 4 milliseconds, the pancake has ballooned into a shape called a bag, made up of a thin, curved water sheet surrounded by a thicker rim. A mere 10 milliseconds after the jet and drop first meet, the liquid is now a spray of smaller droplets.
Researchers have found that the sizes of these final droplets depend on the balance between the airflow and the drop’s surface tension; these two factors determine how the drop breaks up, whether that’s rim first, bag first, or due to a collision between the bag and rim. (Image credit: I. Jackiw et al.; via APS Physics)