Photographer Mike Olbinski is back with another storm-chasing timelapse entitled “Vorticity”. Like his previous work, this film is a breath-taking example of physics in action. It is well worth taking a few minutes to watch in fullscreen, at high resolution, and with headphones. Olbinski’s timelapses beautifully capture the incredible dynamic motion of our atmosphere. Fittingly, “Vorticity” is all about the swirling, roiling motion of supercell thunderstorms and the tornadoes they can spawn, but the film also captures many other great phenomena from the convection that builds clouds to unusual formations like undulatus asperatus and mammatus clouds. (Video credit: M. Olbinski; submitted by Paul vdB)
Tag: atmospheric science

Upcoming Webcast
This weekend I’ll be holding my second live webcast for FYFD patrons. This month we’ll be focusing on the subject of planetary science, one of the coolest applications out there for fluid dynamics. My guests will be Keri Bean, a NASA JPL mission operations engineer and atmospheric scientist, and Professor Geoffrey Collins, a geologist at Wheaton College in Massachusetts. Keri has worked on all the recent Martian missions, including Mars Curiosity and the Phoenix Lander. She currently works on operations for the Dawn mission to Ceres. Geoff studies the geophysics of icy planets and moons like Pluto and Titan. He was part of the Galileo and Cassini missions to Jupiter and Saturn and is currently part of the team working on a future mission to Europa.

Jovian Belts and Zones
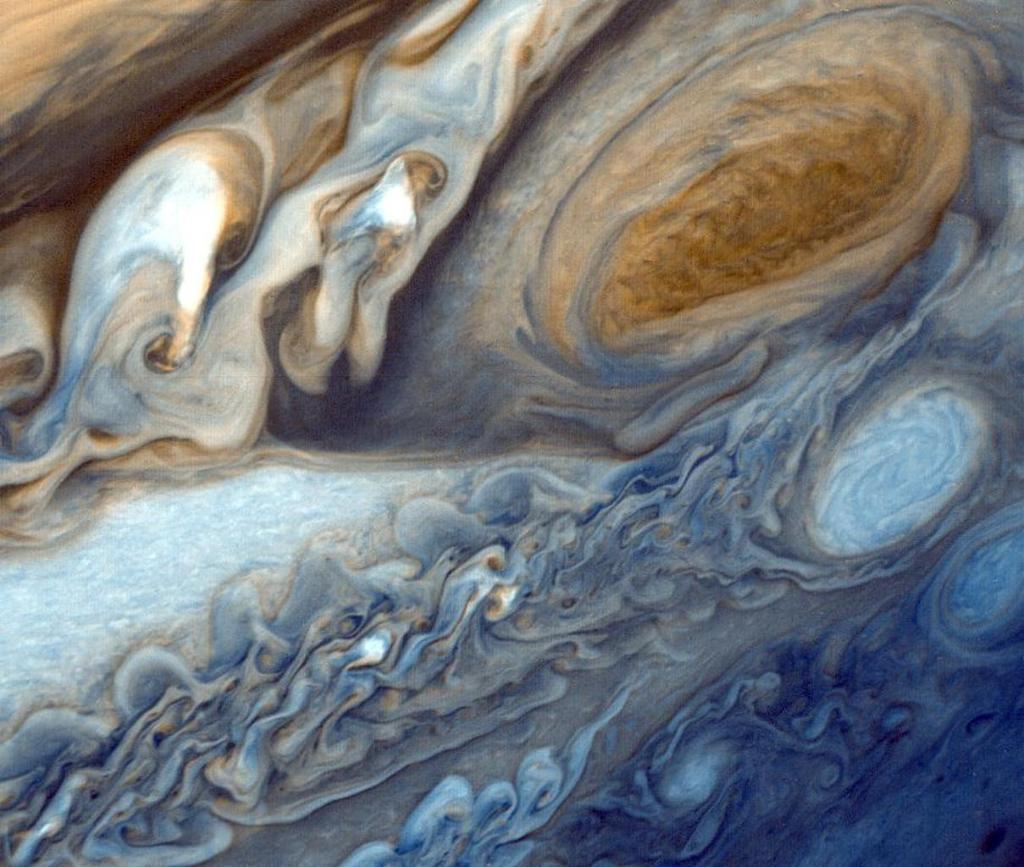
Jupiter’s colorful cloud bands alternate between dark belts and light zones. The bands mark convection cells in Jupiter’s atmosphere, and, like on Earth, powerful jet streams form due to this atmospheric heating and the planet’s rotation. The jet winds can even move in opposite directions, creating strong shear forces between neighboring cloud bands. The shear helps drive Kelvin-Helmholtz instabilities in the clouds, resulting in the regularly spaced waves and vortices seen along the edges of some bands. (Image credit: NASA/ESA; via APOD)

Jovian Dynamics
Our solar system’s largest planet is a mysterious and majestic font of fluid dynamics. Unlike rocky Earth, Jupiter is made entirely of fluids. Beneath its massive gaseous atmosphere lies an ocean of liquid hydrogen. The lack of solid ground to weaken storms may explain some of the longevity of Jupiter’s Great Red Spot, a hurricane that’s been raging on the planet for more than a hundred and fifty years. Part of the challenge of understanding Jupiter’s dynamics is that most of our data consists of observations of the uppermost layer of the atmosphere. It’s kind of like trying to describe an entire ocean based on the surface alone; what we see is part of the story, but it’s only a small portion of a much greater whole. (Image credit: NASA; submitted by jshoer)
——————
FINAL CALL: FYFD reader survey closes TODAY! I’ve teamed up with researcher Paige Brown Jarreau to create a survey of FYFD readers. By participating, you’ll be helping me improve FYFD and contributing to novel academic research on the readers of science blogs. It should only take 10-15 minutes to complete. You can find the survey here.

The Free Surface of a Typhoon

Gazing across the top of of Typhoon Maysak highlights the three-dimensionality of the storm. Like a swirling vortex seen in a bathtub, hurricanes are a kind of free surface vortex with a surface indentation near their eye. To understand this shape, imagine spinning a container of water on a rotating plate. Like the vortex, the water’s surface would take on a parabolic shape. The two forces acting on the rotating water are gravity in the downward direction and centrifugal force in the radial direction. By taking on a parabolic shape, the fluid remains perpendicular to the combination of these two forces at every point along the surface, thereby ensuring that pressure is a constant across the free surface of the fluid. (Image credits: S. Cristoferreti/ESA/NASA; T. Virts/NASA)

Cloud Formation
Clouds are so ubiquitous here on Earth that it’s easy to take them for granted. But there’s remarkable complexity in the mechanics of their formation. This great video from Minute Earth steps through the processes of evaporation and condensation that drive basic cloud formation. After evaporation, buoyancy lifts warm, moist air upward. That warm air expands and cools until it reaches an altitude where water droplets can condense onto dust particles in the atmosphere. These droplets form the wispy cloud we see. Turbulence mixes these droplets and helps them collide and grow. Interestingly, although we understand the basic process of cloud formation, relatively little is understood about the details, and the subject is still very much an area of active research. (Video credit: Minute Earth; via io9)
Earth’s Aerosols
The motions of Earth’s atmosphere move more than just air and moisture. As seen in this animation built from NASA satellite data, the atmosphere also transports large amounts of small solid particles, or aerosols, such as dust. Each year the wind carries millions of tons of Saharan dust across the Atlantic, depositing much of it in the Amazon basin. This provides much needed nutrients like phosphorus to plants and animals in the Amazon; check out this video from the Brain Scoop to see what happens in areas that don’t receive these nutrients. Dust is only one of many sources for atmospheric aerosols, though. Sea salt, volcanic eruptions, and pollution are others. All of these aerosols serve as potential nucleation sites for raindrops or snowflakes, and their transport all around the globe by atmospheric winds means that seemingly local effects–like a regional drought or increased pollution in developing countries–can have global effects. (Video credit: NASA Goddard; submitted by entropy-perturbation)
The Earth in Infrared
The motions of Earth’s atmosphere are often invisible to the human eye, but fortunately, we’ve built tools to reveal them. This timelapse video shows the Earth in infrared light, first from a satellite view centered on the Pacific Ocean and second from a satellite centered on Central America. The water vapor in clouds is an excellent insulator, so clouds appear dark in this video. Warmer areas look brighter. The large-scale motion of the atmosphere and the wind bands that cut east and west across the world are apparent in the first half of the video, largely because they are not being interrupted by any land masses. In the second half of the video, the western coast of South America is intermittently visible. This is because the Andes Mountains disrupt air flow, pushing warm, moist air upward and causing it to condense into the dark-colored clouds that recirculate over the Amazon. Look further south along the coast and you’ll see the Atacama Desert flashing white each day as it heats up. (Video credit: J. Tyrwhitt-Drake/NASA; submitted by entropy-perturbation)
Jupiter Timelapse
This timelapse video shows Jupiter as seen by Voyager 1. In it, each second corresponds to approximately 1 Jupiter day, or 10 Earth hours. Be sure to fullscreen it so that you can appreciate the details. The timelapse highlights the differences in velocity (and even flow direction!) between Jupiter’s cloud bands. It is these velocity differences that create the shear forces which cause Kelvin-Helmholtz instabilities–the series of overturning eddies–seen between the bands. Earth also has bands of winds moving in opposite directions, but there are fewer of them and the composition of our atmosphere is such that they do not make for such a dramatic naked eye view of large-scale fluid dynamics. (Video credit: NASA/JPL/B. Jónsson/I. Regan)

The Atmospheric River
Atmospheric rivers are long, narrow corridors of concentrated water vapor transport in the atmosphere. They often occur when winds from storms over the ocean draw moisture together and project it ahead of a cold front. The phenomenon was only recognized in the 1990s, but subsequent research has shown that atmospheric river conditions account for many instances of heavy rainfall and flooding in areas along the West Coast of the United States. Forecasters can now recognize the phenomenon in forecast models, allowing them to predict potential flood-inducing rainfall days in advance. To learn more, check out NOAA’s atmospheric river Q&A. (Image credit: NOAA)